I blew up my first funded account’s weekly buffer on a single indicator, and it was the friendliest one on my chart: the exponential moving average. Not some exotic oscillator — the humble EMA. For six weeks I treated the 9/21 EMA crossover like a buy button. Every time the fast line crossed above the slow one on the GBPUSD 15-minute chart, I bought. Cross down, I sold. It felt disciplined. It felt systematic. Then came the week before a US jobs report when cable chopped sideways in a 60-pip range for three straight days, and the 9 and 21 crossed each other eleven times. I traded every single one. When the dust settled I was down $438 in closed losses and spread, my personal daily stop was gone twice over, and the account was flirting with the firm’s 5% daily loss limit. The EMA was never lying to me — it is a trend-following average, and I was asking it to make decisions in a market with no trend. That is the core lesson of this guide: the EMA is the best trend filter in your prop firm toolbox, and a terrible signal generator when you let it make trades for you.
In this article
- The Morning I Bought Every Crossover
- What the EMA Actually Measures
- The One Formula You Need
- My Prop-Firm Settings: 9, 21, 50 and 200
- How I Read the Signals: Crossovers, Bounces and Slope
- I Tested It: A Worked EURUSD Trade With Real Drawdown Maths
- The Four EMA Mistakes That Burn Drawdown
- My One-Page EMA Routine for Challenge Days
- How the EMA Fits Prop Firm Rules
- Frequently Asked Questions
This is the EMA manual I needed that week, rewritten for the prop firm reality: what the exponential moving average actually measures, the one formula that explains its lag, the four settings I run on a challenge account, how I read crossovers, bounces and slope under a daily loss limit, a worked EURUSD trade with real position-sizing maths, and the mistakes that cost me the most drawdown. If you have read my MACD guide, half of this will feel familiar — the MACD line is literally the difference between two EMAs.
The Morning I Bought Every Crossover
It was a Tuesday, two days before non-farm payrolls, and GBPUSD had been dead since the London open — a 1.2680 to 1.2740 box, no news, no volume. At 10:40 the 9 EMA crossed above the 21 EMA. Buy at 1.2712. Price wiggled up 9 pips, then faded. At 11:25 the cross flipped down. Sell at 1.2701. By 14:00 I had taken four trades, won one, and paid $214 in losses and spread.
Here is what I did not understand at the time: a moving average is a summary of where price has been, weighted toward the recent past. In a range, where price has been is everywhere — so the average sits in the middle and price crosses it constantly. Every one of my “signals” was the indicator correctly reporting that recent price had shifted a few pips. None of them was a trade. A crossover in a range is not a signal, it is a symptom of a market you should be sitting out. My rule now, written on a sticky note on my monitor: if the 9 and 21 are tangled within a 15-pip band for more than two hours, the chart is off-limits until the London or New York session breaks it.
What the EMA Actually Measures
Strip away the jargon and the exponential moving average answers one question: where has price been recently, with more weight given to the most recent candles? Unlike a simple moving average, which treats the candle from 50 periods ago as equal to the candle that just closed, the EMA lets old data decay. That makes it faster to react when a trend starts — and also faster to get whipsawed when a trend does not exist.
This matters on a prop firm account for a specific reason: your enemy is not missing a trend, it is bleeding drawdown while waiting for one. An EMA’s job is to tell you whether a trend exists and which direction it points, so you only pay spread and commission when the odds justify the risk. I use it in three roles: the 200 EMA as a hard bias gate (no longs below it, no shorts above it), the 50 as a regime filter (is the day tradeable?), and the 9/21 pair as a timing aid inside an already-confirmed trend. The EMA does not predict. It summarises the recent past, and summaries of chop look exactly like chop.
The One Formula You Need
You do not need to compute the EMA by hand — every platform does it for you — but you need the formula, because it explains the lag, and the lag explains every EMA mistake I made that week. (The weighting logic here matches the BabyPips EMA lesson.) The exponential moving average updates like this:
EMA(today) = Price(today) × k + EMA(yesterday) × (1 − k)
k = 2 ÷ (N + 1), where N is the EMA period
Two consequences fall out of this, and each one is a trading rule in disguise. First, the smoothing constant k is what makes short EMAs twitchy and long EMAs slow: for a 9-period EMA, k = 2/10 = 0.20, so today’s price gets 20% of the vote; for a 200-period EMA, k = 2/201 ≈ 0.01, so today’s price barely moves the needle. Choosing an EMA length is choosing how much lag you are willing to buy in exchange for fewer false signals. Second, because the EMA is an average of past prices, it always sits behind live price during a fast move — a crossover after a 50-pip spike is not telling you a trend is starting, it is confirming one that is already halfway done. I use crossovers as permission to look for entries, never as the entry itself.
My Prop-Firm Settings: 9, 21, 50 and 200
The defaults everyone ships — 9 and 21 on intraday, 50 and 200 on higher timeframes — are genuinely fine for prop firm trading. The mistake is using one setting for every job. Each EMA has exactly one job on a challenge account, and I never let them swap:
| EMA | Chart | Its one job | Why it suits a challenge |
|---|---|---|---|
| 9 EMA | M15 | Timing aid — pullback depth gauge | Fast enough to show a pullback is over without the noise of the raw candles |
| 21 EMA | M15 / H1 | Trend filter — dynamic support/resistance | One clear line: price above it, longs only; price below it, shorts only |
| 50 EMA | H1 | Regime filter — is the day tradeable? | Flat 50 on H1 means chop — I cut my trade quota to zero before losing a pound |
| 200 EMA | H4 / D1 | Bias gate — the direction the account is allowed to face | Counter-trend trades are the statistical graveyard of challenge accounts |
Notice what is missing: there is no crossover system. The 9/21 cross is the most overused EMA pattern in retail trading, and on a prop firm account it has a structural problem — by the time the cross prints on M15, the move has often used up 40% of its room, shrinking your reward-to-risk below what a 5% daily loss limit tolerates. I let the 21 EMA bounce do the work the crossover used to do: wait for price to pull back to the 21 and enter on the resumption candle. Same trend, earlier entry, smaller stop.
How I Read the Signals: Crossovers, Bounces and Slope
The EMA gives you exactly three reads, each answering a different question. A crossover answers “has the recent direction changed?” — the slowest and least trustworthy of the three, useful only as a regime note on the H1, never as an M15 entry trigger. A bounce answers “is the trend still intact?” — price pulls back to a rising 21 EMA and holds. This is my bread-and-butter setup: it enters mid-trend with a stop just beyond the EMA instead of beyond the last swing, often 10–15 pips tighter.
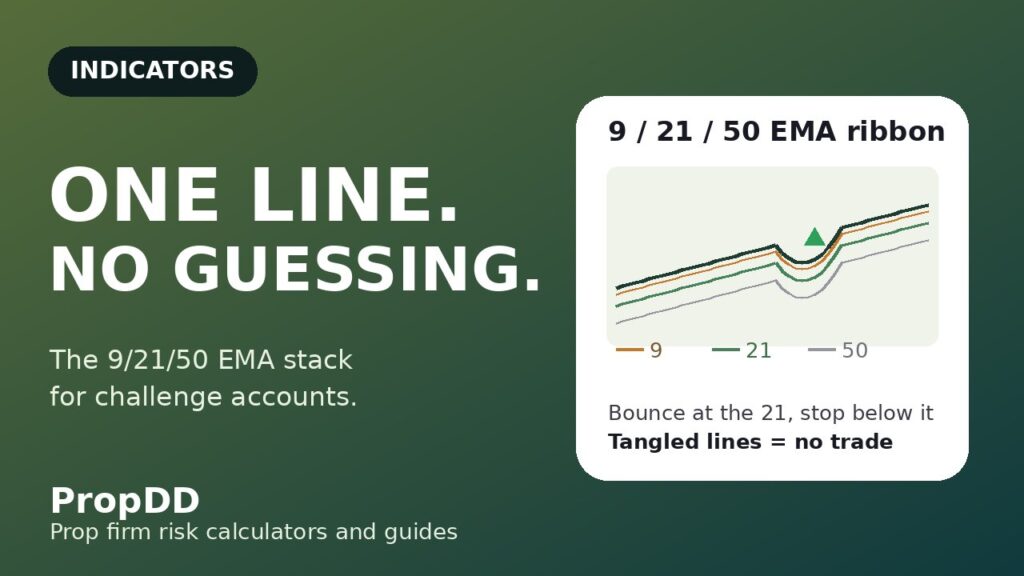
The third read, slope, is the one most traders ignore and the one that would have saved me that Tuesday. The gap between the 9 and the 21 is a visual momentum gauge: fanned wide apart means the trend has energy; converging means momentum is fading; tangled together means there is no trend and no trade. It pairs naturally with the pullback framework in my trend pullback strategy guide, where the same 20/50 structure defines the zone I wait for.
I Tested It: A Worked EURUSD Trade With Real Drawdown Maths
Theory is cheap; drawdown is the only examiner. Here is a real pullback trade on my current stack, sized the way a challenge account demands. The setup: $100,000 account, firm daily loss limit 5% ($5,000), and my personal daily stop set at half that — $2,500, per my personal daily stop guide. I risk a maximum of 0.5% ($500) per trade, because five full losers in a row must still leave the daily limit untouched.
EURUSD on M15, London session: price is above a rising 21 EMA, the 9 is above the 21 with a healthy gap, and the H1 50 EMA is rising too. Price pulls back from 1.0880 to touch the 21 EMA at 1.0862. Entry on the resumption candle at 1.0865. The stop goes 18 pips below, at 1.0847 — just beyond the pullback low. Position size = $500 risk ÷ 18 pips ÷ $10 per pip per standard lot = 2.77 standard lots. Target: 2R at 1.0901 (36 pips).
| Trade input | Value | Drawdown check |
|---|---|---|
| Account / firm daily limit | $100,000 / 5% = $5,000 | Personal stop $2,500 = half the firm limit |
| Risk per trade | 0.5% = $500 | 5 full losers = $2,500 = personal stop, still under the firm limit |
| Entry / stop / target | 1.0865 / 1.0847 / 1.0901 | 18-pip stop, 2R target — stop beyond the 21 EMA, not beyond the swing |
| Position size | 2.77 lots | $500 ÷ 18 pips ÷ $10/pip — verified in the Max Daily Drawdown calculator |
| Outcome | Target hit: +$1,000 (2R) | Floating peak +$760 never threatened the daily limit |
I logged ten of these 21-EMA bounce trades on a demo challenge over three weeks — six wins, four losses, average win 1.9R, average loss 1R. The headline is not the win rate; it is that no single trade ever risked more than 10% of my personal daily stop, so the worst day was −$1,000. That is what the EMA is for on a prop firm account: not picking winners, but keeping every loser small enough that the daily limit is never a live threat.
The Four EMA Mistakes That Burn Drawdown
Every one of these cost me real money. The pattern: treating a descriptive tool as a decision-maker.
| Mistake | What it cost me | The fix |
|---|---|---|
| Trading crossovers in a range | $438 in one week — eleven chop signals | Tangled 9/21 = no-trade zone, written rule, no exceptions |
| Using the same EMA on every timeframe | Counter-trend M15 entries against the H4 200 | Each EMA has one job and one chart — see the settings table |
| Ignoring the slope | Entered “bounces” while the 9/21 gap was collapsing | Only take bounces while the 9 is clearly above/below the 21 with a visible gap |
| Sizing from the crossover instead of the bounce | Late entries needed 35-pip stops, halving my size and my R | Enter at the 21-EMA pullback — the stop is 10–15 pips tighter |
The first mistake is the one to tattoo on your forearm. Crossovers are the most advertised EMA signal and the least useful one on a challenge account, because a lagging average in a sideways market generates the maximum number of trades at the minimum quality — the exact opposite of what a consistency rule rewards. My one-pair challenge guide makes the same point from the other direction: fewer, better trades is how accounts survive.
My One-Page EMA Routine for Challenge Days
The entire routine takes four minutes before the London open. If any step fails, there is no trade — the EMA stack is a filter stack, and filters are allowed to say no.
| Step | Check | Pass rule |
|---|---|---|
| 1 | D1/H4: price vs 200 EMA | Longs only above it, shorts only below it — no counter-trend trades |
| 2 | H1: 50 EMA slope | Flat 50 = chop day: zero trades, close the platform |
| 3 | M15: 9 vs 21 separation | Tangled lines = no-trade zone until a session break |
| 4 | Wait for the pullback | Price touches the 21 EMA, 9 flattens into it, enter on resumption |
| 5 | Size the trade | 0.5% risk max, stop beyond the EMA — check against the drawdown calculator |
Step 2 saves accounts. Most of my worst EMA days were not bad trades — they were trades taken on days the H1 50 EMA was dead flat, when no EMA-based setup has an edge. If you want the full risk-per-trade framework this routine sits inside, my risk-per-trade guide works through the numbers.
How the EMA Fits Prop Firm Rules
The EMA’s real value on a prop firm account is not prediction — it is compliance. The daily loss limit punishes frequency and size, not direction; the consistency rule punishes lottery tickets, not grinders. An EMA filter stack attacks both problems. The 200 EMA bias gate deletes counter-trend trades — the trades most likely to run 30+ pips against you and eat a day’s drawdown in one sitting. The flat-50 rule deletes chop days entirely, and chop days are where overtrading lives.
The consistency angle is subtler but just as important. Firms measure whether your best day stays under a share of total profit — typically 30–40%. A 21-EMA bounce system with fixed 0.5% risk and 2R targets produces days that look alike: +2R, +2R, −1R, +2R. No single day can balloon because position size is anchored to the daily limit, not to conviction. That framing — the EMA as a set of guardrails rather than a signal machine — is what finally got an account funded.
Frequently Asked Questions
What EMA settings are best for prop firm trading?
The stack I run is 9 and 21 on the 15-minute chart for timing, 50 on the H1 as a regime filter, and 200 on H4/D1 as a bias gate. The defaults (9/21 intraday, 50/200 higher timeframes) are fine — the important part is giving each EMA exactly one job instead of using all of them as entry signals.
Can I trade EMA crossovers on a funded account?
You can, but I would not build a system on them. A crossover is a lagging confirmation of a move that is already underway, so entries arrive late with wide stops — exactly what a 5% daily loss limit punishes. I use crossovers only as regime notes on the H1 and take entries at 21-EMA pullbacks instead.
Why does the EMA keep giving false signals in ranging markets?
Because the EMA summarises recent price, and in a range recent price is everywhere — the average sits mid-range and price crosses it constantly. The fix is the tangled-lines rule: when the 9 and 21 are wrapped around each other inside a tight band, the market has no trend and the chart is off-limits.
Is the EMA better than the SMA for challenge accounts?
For intraday challenge trading, yes — the EMA weights recent prices more heavily, so it reacts faster when a trend starts and hugs pullbacks more tightly, which means smaller stops. The SMA is fine on daily charts but too sluggish for the M15 entries a 5% daily limit demands.
How does the EMA relate to the MACD?
The MACD line is literally the 12-period EMA minus the 26-period EMA. If you understand the EMA — its weighting, its lag, its slope — you already understand half the MACD. My MACD guide builds directly on this one.
What is the biggest EMA mistake prop firm traders make?
Using it as a signal generator instead of a filter. The EMA’s job is to tell you whether a trend exists and which way it points so you only risk drawdown when the odds justify it. Every crossover traded in a range, every counter-trend entry against the 200, every ignored slope — all of them are the same mistake: asking a summary to make decisions.
Risk disclaimer: This article is for educational purposes only and is not financial advice. Trading on prop firm evaluation and funded accounts involves risk, and most challenges end without funding. Never risk money you cannot afford to lose, and always read your firm’s current rulebook before trading.




27 comments
[…] you read my EMA guide, you will notice a family resemblance — the Supertrend’s bands are built from the same […]
[…] five-loss day. Second, it satisfies consistency rules: same setup, same size, same sessions — the EMA trend filter I pair it with never changes either, so no single day can spike the account. Third, it has a […]
[…] it cannot size your position. For that I still cross-check every trade against the risk math in my EMA guide’s sizing section — trend freshness and correct size are two separate […]
[…] comparison, the EMA guide on this site shows the same pullback logic with a fixed average. The practical difference was not entry price […]
[…] this with the single-line approach in my EMA guide: one EMA tells you where price is relative to its own average, while the GMMA tells you whether two […]
[…] simplicity is the point. Most indicators I have covered, from EMA to ADX, answer a different question: where is momentum, or how strong is the trend. Supertrend […]
[…] back to. If you already trade moving-average pullbacks, the closest comparison on this site is my EMA guide, and the difference is exactly the lag: the EMA pullback entry arrives later, with a wider stop, […]
[…] you in and out of a range. It is distinct from the moving averages I have already covered here. An EMA has one fixed speed, whatever the market is doing. A Hull moving average is fast and low-lag, but […]
[…] deviation to draw bands around price, which is about volatility, not about stretch as a percentage. The EMA is the average itself, it never tells you how far price has wandered from it. On-Balance Volume and […]
[…] intraday bias and the channel decide the trend. And when the channel is flat, I do not force it: my EMA article explains why a flat average is a no-trade signal in any […]
[…] points-based version and its own funded-account rules. It shares its smoothing philosophy with the EMA guide, since both EMAs in the PPO are the same tool, and it belongs in the same momentum family as the […]
[…] pay for a line that will not fake you out every time the market sneezes. If you already trade an EMA setup, run the two lines side by side for a week before you commit — the difference in whipsaw count […]
[…] this with the EMA, which I covered earlier in this series. An EMA crossover needs two lines and a judgement about […]
[…] keep FRAMA honest. First, against a fixed average: an EMA with a fixed period, covered in the EMA guide, is always a compromise, too slow in trends or too twitchy in ranges, and the trader pays for the […]
[…] is what makes TEMA a different indicator from the EMA it is built from, and it is why the EMA guide on this site and this guide give different entries on the same […]
[…] who found EMA too twitchy and the adaptive averages too slow to trust on a funded clock. I use the EMA guide for fast entries elsewhere, the Hull guide for trend speed, and the TEMA guide when I want raw […]
[…] distinctions matter before you load it. First, the ZLEMA is not the same indicator as my plain EMA guide: the EMA is the raw material, and the ZLEMA is that material with a lag correction applied, so the […]
[…] which is why it stays smoother when KAMA starts to step. It is also worth distinguishing from the EMA guide on this site: EMA is the baseline every funded trader should understand first, and JMA is what you […]
[…] live guides on this site cover the neighbours in detail: my EMA guide explains the exponential weighting and its crossover rules, and my Hull Moving Average guide covers […]
[…] the slow end anchors the trend, and the middle lines show whether the move is holding together. My EMA funded-account article covers the single-line version in detail; the ribbon is what you graduate to when one line keeps […]
[…] Kaufman adaptive moving average lesson walks through the same three steps, and my EMA funded-account article explains the fixed-speed average that KAMA is built to improve […]
[…] same tools I use everywhere else on this site. A pullback to a fan line that also lines up with a moving average zone or a level from my trend pullback strategy is a stronger setup than a fan touch on its own. A […]
[…] EMA funded-account guide covers the fast end of this family, my weighted moving average guide covers the linear-weight […]
[…] makes VWMA a different animal from the moving averages most funded traders already know. The EMA guide weights recent bars more heavily, so it turns faster, but it still cannot tell a heavy bar from a […]
[…] EMA […]
[…] comparison that matters most is against the EMA, because that is the line most traders already have on their chart. Same length, same market, the […]
[…] is not the only trend tool on my chart: my ADX guide reads the same strength score on its own, my EMA guide sets the bigger-picture bias, and the Supertrend flip times my entry. They stack in one order — […]