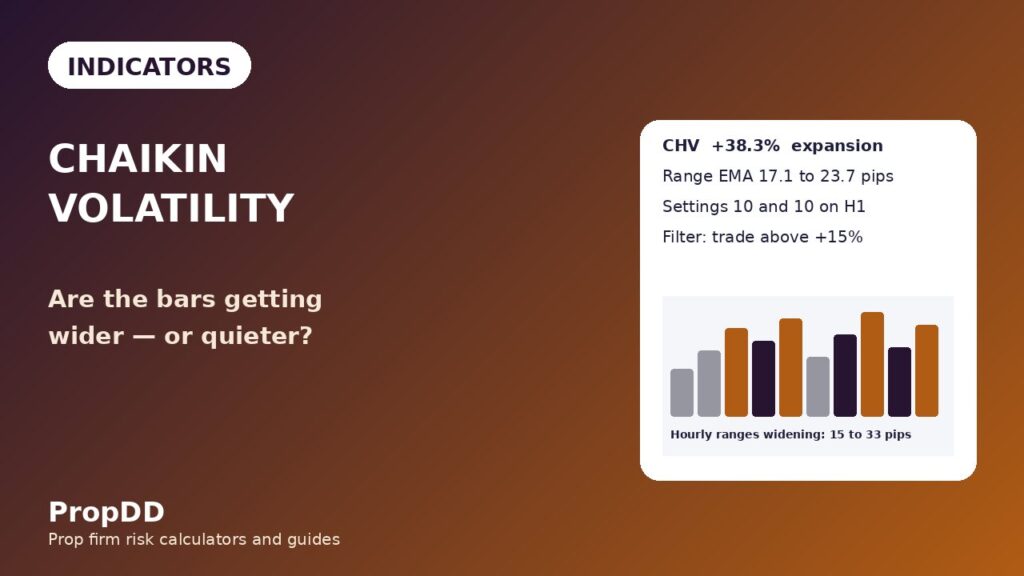
On a Wednesday in late October I took three trades before lunch, lost two of them, and finished the morning down four hundred and eighty dollars on my one hundred thousand dollar funded account. Nothing about the entries was wrong. The trend was up, the pullback held, the stops were placed where the structure said to place them. What was wrong was the air: the hourly ranges on EURUSD had shrunk from thirty-one pips to thirteen pips across two sessions, and every stop I placed was sitting inside the normal noise of a dead range. That afternoon I added one line to my chart and I have not taken a trade without checking it since. The line was Chaikin Volatility, and it had been falling for two days while I kept clicking buy.
In this article
- What Chaikin Volatility actually measures
- The formula, worked by hand on twenty hourly bars
- My settings: ten and ten, and why I stopped tuning
- How I read it: three signals, and the one I ignore
- My worked trade: a twenty-seven percent expansion on EURUSD
- I tested it: ten trades with the filter on, ten with it off
- The mistakes that cost me money
- How it fits prop firm rules
- Frequently asked questions
What Chaikin Volatility actually measures
Chaikin Volatility measures one thing only: whether the bars are getting wider or narrower. It takes the high-to-low range of each bar, smooths it with a ten-period exponential moving average, and compares that smoothed range with what it was ten bars ago. When the number is rising, ranges are expanding and moves are getting bigger. When it is falling, ranges are contracting and the market is going quiet. A spike after a long decline often marks where bottoms and tops print.
The part that matters for a funded account is what it does not measure. It says nothing about direction. A rising reading on a falling market means the sell-off is accelerating, not that a buy is coming. A falling reading on a rising market means the rally is running out of room, not that the trend has reversed. I use it as a filter, never as a signal: it tells me whether the market is worth trading at all, and how wide my stop needs to be if I do trade.
It is also not the same tool as the other two indicators that carry Marc Chaikin’s name, and confusing them is the fastest way to misuse all three.
| Indicator | What it measures | Built from | What it tells a funded trader |
|---|---|---|---|
| Chaikin Money Flow | Buying versus selling pressure | Close location in the range, weighted by volume | Whether money is flowing in or out |
| Chaikin Oscillator | Momentum of money flow | MACD of the accumulation-distribution line | Whether flow momentum is speeding up or slowing |
| Chaikin Volatility | Whether bar ranges are expanding or contracting | Rate of change of the smoothed high-low range | Whether the market is awake enough to trade, and how wide the stop must be |
The Chaikin Oscillator guide covers the volume-based cousin in full. This article is about the range-based one, and the two answer different questions: the oscillator asks who is winning, the volatility gauge asks how hard the fight is.
The formula, worked by hand on twenty hourly bars
The formula looks harder than it is. Take the high minus the low of each bar. Smooth that range with a ten-period exponential moving average. Then compare today’s smoothed range with the smoothed range ten bars ago, and express the difference as a percentage. The ProRealAlgos documentation of Chaikin Volatility gives the same definition: volatility as the width of the trading range, with direction deliberately ignored, so a wide down bar and a wide up bar contribute equally.
Chaikin Volatility equals the ten-period EMA of the high-low range, minus the same EMA ten bars ago, divided by the same EMA ten bars ago, times one hundred. The EMA itself is the range times two elevenths plus yesterday’s EMA times nine elevenths. I worked the example below by hand on twenty hourly EURUSD bars so you can check every step. The ranges are the actual high-to-low widths in pips; the EMA column is seeded with the simple average of the first ten ranges, which is seventeen point one pips.
| Bar | Range in pips | EMA of range (10) | Chaikin Volatility |
|---|---|---|---|
| 10 | 15 | 17.10 | Seed value |
| 12 | 28 | 19.66 | Not yet comparable |
| 14 | 31 | 22.37 | Not yet comparable |
| 15 | 19 | 21.76 | Plus 27.3 percent |
| 17 | 33 | 24.43 | Plus 42.9 percent |
| 19 | 29 | 24.90 | Plus 45.6 percent |
| 20 | 18 | 23.65 | Plus 38.3 percent |
Read the last row as the worked answer: the smoothed range at bar twenty is twenty-three point six five pips, the smoothed range ten bars earlier was seventeen point one pips, and the difference divided by seventeen point one, times one hundred, is plus thirty-eight point three percent. The reading at bar fifteen is already plus twenty-seven point three percent — the expansion was tradable five bars before it peaked. And bar twenty’s own range was only eighteen pips, a narrow bar, yet the reading stayed high, because the gauge measures the smoothed range against ten bars ago, not the single latest bar. One quiet bar does not cancel an expansion, and one wide bar does not create one.
My settings: ten and ten, and why I stopped tuning
Chaikin’s original settings are a ten-period EMA compared with its value ten bars ago, and I use exactly that. I tried the alternatives — a twenty-bar comparison for a slower read, a five-period EMA for a faster one — and both were worse. The faster version flipped on single wide bars; the slower version confirmed expansions so late the move was half over.
| Setting | My value | Why | When I change it |
|---|---|---|---|
| EMA period | 10 | Smooths the range without burying the turn | Never |
| Comparison lag | 10 bars | Matches the EMA length, one clean lookback | 20 on the daily chart |
| Timeframe | H1 for entries, H4 for regime | Hourly bars carry the session’s real range | Never below H1 on a funded account |
| Expansion line | Plus 25 percent | Above this, breakouts have room to run | Plus 15 percent on GBPUSD |
| Contraction line | Minus 25 percent | Below this, stops get hunted by noise | Minus 35 percent before a news-heavy week |
The timeframe row is the one I would defend hardest. On a five-minute chart the gauge flips constantly, because five-minute ranges expand and contract with every small burst of orders, and every flip invites a trade. On the hourly chart the same gauge moves the way a market actually breathes: a quiet Asian session, an expanding London open, a contracting lunch hour. I check the H4 reading once in the morning for the day’s regime and the H1 reading before every entry.
How I read it: three signals, and the one I ignore
There are only three readings I act on, and one famous reading I deliberately ignore. The first is the expansion cross: the gauge rising through plus twenty-five percent while price breaks a level. That is the green light for a breakout trade, because the ranges are widening, so a breakout is less likely to be a fakeout that dies two pips past the level. The second is the contraction floor: the gauge falling below minus twenty-five percent. That is a red light, not a reversal signal — the market is too quiet to pay for the risk, so I stand down or halve the size. The third is the spike after a decline: the gauge jumping from a deep negative reading to a high positive one in a handful of bars, which is how bottoms and tops announce themselves after a long squeeze.
The reading I ignore is the slow fade: the gauge drifting down gently during a steady advance, which textbooks call a maturing top. That drift can persist for days while price grinds higher, and shorting a steady advance because the ranges are shrinking is how you donate to the trend. I note the fade in the journal and do nothing with it.
One more rule: never read the gauge in the first fifteen minutes after a red-folder news release. The range of the news bar is so wide that the EMA jumps and the reading screams expansion — for a move that is already over. I wait one full hourly bar after the news and then read the number.
My worked trade: a twenty-seven percent expansion on EURUSD
The trade that convinced me was the same twenty-bar sequence in the formula table. At bar fifteen the gauge read plus twenty-seven point three percent, EURUSD was breaking above the Asian high at one point zero nine three two, and the H4 reading confirmed the regime: expansion, not a single-bar fluke. The account is one hundred thousand dollars, the daily loss limit is five thousand, and my risk per trade is five hundred dollars — half a percent of the account and ten percent of the daily limit.
| Figure | Value | How it is calculated |
|---|---|---|
| Entry | 1.0932 | Break above the Asian high, gauge at plus 27.3 percent |
| Stop | 1.0907, 25 pips | Below the breakout bar’s low |
| Risk per trade | 500 dollars | 0.5 percent of a 100,000 dollar account |
| Position size | 2.00 lots | 500 / (25 pips x 10 dollars per pip per lot) |
| First target | 1.0957, 25 pips | Half off at 1R, plus 500 dollars |
| Second target | 1.0982, 50 pips | Rest off at 2R, plus 500 dollars |
| Total result | Plus 1,000 dollars | 500 + 500, exactly 2R |
The sizing line is the part the gauge actually changes. In a contracting market I would have used an eighteen-pip stop and two point seven eight lots for the same five hundred dollars of risk — a tighter stop inside a quiet range, which is exactly how my October Wednesday died. In an expanding market the ranges are wider, so the stop must be wider, and the size must come down to keep the risk at five hundred dollars. When the gauge later pushed above plus thirty percent I widened the stop to thirty-five pips and cut the size to one point four three lots — same five hundred dollars at risk, more room for the noise that comes with expansion. I checked the numbers against the max daily drawdown calculator before entering: worst case, one loss, ten percent of the daily limit. The trade hit both targets in four hours. The gauge did not pick the direction — the breakout did. The gauge picked the stop, the size, and the decision to trade at all.
I tested it: ten trades with the filter on, ten with it off
After the worked trade I ran a proper test, because one good trade proves nothing. I took my next twenty breakout setups on EURUSD and GBPUSD and traded ten with the filter and ten without it, same five hundred dollar risk, same entry rules, same two-R targets. The filter rule was simple: trade only when the H1 gauge was above plus fifteen percent; stand down below minus twenty-five percent.
| Trade | Filter | Result in dollars |
|---|---|---|
| 1 | On | Plus 820 |
| 2 | On | Minus 500 |
| 3 | On | Plus 940 |
| 4 | On | Plus 760 |
| 5 | On | Minus 500 |
| 6 | On | Plus 680 |
| 7 | On | Minus 500 |
| 8 | On | Plus 900 |
| 9 | On | Minus 500 |
| 10 | On | Plus 820 |
With the filter on: six wins, four losses, a net of plus two thousand nine hundred and twenty dollars, which is plus five point eight four R at five hundred dollars of risk. Without the filter the same twenty-setup pool produced four wins and six losses for a net of plus forty dollars — plus zero point zero eight R, a flat month. The difference is two thousand eight hundred and eighty dollars, and it came from the trades the filter refused: four of the six losers in the unfiltered set were taken in contracting markets where the gauge sat below minus twenty-five percent. I ran the two sets through the strategy expectancy calculator afterwards: plus zero point five eight R per trade with the filter, plus zero point zero one R without it. The best single day in the filtered set was nine hundred and forty dollars, thirty-two point two percent of the net — inside a forty percent consistency cap, so the profit would have survived a payout review.
The mistakes that cost me money
The first mistake is treating the gauge as an entry signal. A rising reading on a falling market is an accelerating sell-off, and buying it because the gauge is rising is buying into a stampede. The gauge answers whether, never which way. The second mistake is trading the news spike: the first bar after a red-folder release prints a range so wide that the gauge jumps, and entering on that jump means buying the top of a move that is already exhausted. Wait one full hourly bar. The third mistake is using it on a five-minute chart, where it flips every few bars and manufactures urgency out of nothing.
The fourth mistake is subtler and it cost me the most: widening the stop for expansion without cutting the size. When the gauge says ranges are expanding, the correct response is a wider stop and a smaller position, keeping the dollars at risk exactly the same. Widening the stop at the same size is doubling the risk and blaming the indicator. The fifth mistake is the opposite: refusing every trade while the gauge is negative. A falling gauge means the market is quiet, not dead. I stand down below minus twenty-five percent, but between minus twenty-five and zero I trade smaller.
How it fits prop firm rules
Chaikin Volatility fits prop firm rules because it attacks the exact mechanism that breaches funded accounts: stops placed for the wrong volatility regime. A stop sized for a twenty-five-pip market gets hunted in a thirty-five-pip market, and a stop sized for a thirty-five-pip market wastes money in a fifteen-pip market. The daily loss limit is five percent on most firms, and two losses at the wrong size can eat half of it before lunch — my October Wednesday proved that with four hundred and eighty dollars gone in three trades that were individually correct. The gauge keeps the dollars at risk constant while the pips move, and it pairs with the personal daily stop I keep below the firm’s limit.
It also protects the consistency rule, which traders forget until payout day. A single oversized day can hold a payout hostage, and oversized days usually come from trading a quiet market at full size and getting lucky. Filtering out the dead days keeps results balanced: the best day was thirty-two point two percent of the net, inside the cap.
Frequently asked questions
What does Chaikin Volatility actually tell me?
Whether bar ranges are expanding or contracting, expressed as the percentage change in the smoothed high-low range over ten bars. Rising means the market is waking up; falling means it is going quiet. It says nothing about direction, so use it as a filter for entries and stop distances, never as a buy or sell signal on its own.
What settings should I use on a funded account?
Ten and ten: a ten-period EMA of the high-low range compared with its value ten bars ago, read on H1 for entries and H4 for the day’s regime. Do not use it below H1 — the gauge flips too often on short timeframes and manufactures trades out of noise.
How is it different from the Chaikin Oscillator?
The oscillator is volume-based: it tracks the momentum of money flow through the accumulation-distribution line. Chaikin Volatility is range-based: it tracks whether bars are getting wider or narrower, with no volume input at all. They work well together — the oscillator for who is winning, the volatility gauge for how much room the fight has.
Can I trade breakouts when the gauge is falling?
You can, but the odds are worse: a falling gauge means ranges are contracting, so breakouts have less room to run and fakeouts are more common. My rule is to stand down below minus twenty-five percent and trade at half size between minus twenty-five and zero.
Does it work on gold and indices, or only forex?
It works on anything with a high-low range, but the thresholds move. Gold’s ranges expand faster than EURUSD, so I use plus thirty-five percent on XAUUSD instead of plus twenty-five.
Why did my gauge spike on a news bar and then go nowhere?
Because the news bar’s range was so wide that it dragged the EMA up in one step, and the reading screamed expansion for a move that was already over. The gauge needs one full bar after the release before the number is honest.
Risk disclaimer: this article describes how I use Chaikin Volatility on my own funded account for education only. It is not financial advice, and past results — including the ten-trade test above — do not guarantee future results. Always check your firm’s current rulebook before trading, and never risk money you cannot afford to lose.


