I used to run the same momentum check on three pairs and get three answers I could not compare. My MACD on EURUSD read 0.0018, on GBPUSD it read 0.0031, and on USDJPY it read 0.42 — and none of those numbers told me which pair actually had the stronger momentum, because MACD is measured in price points and every pair has a different point size. The week I finally understood that, I had taken the GBPUSD trade because 0.0031 looked bigger than 0.0018, and it was the weaker move of the two. The EURUSD trade I skipped ran for 2R while the GBPUSD one chopped me out for a full stop. That was the week I replaced MACD with its percentage cousin on my watchlist, and I have not gone back.
In this article
- What the percentage price oscillator actually measures
- The formula, worked by hand
- The settings I use on a funded account
- How to read the three signals
- The cross-pair trick MACD cannot do
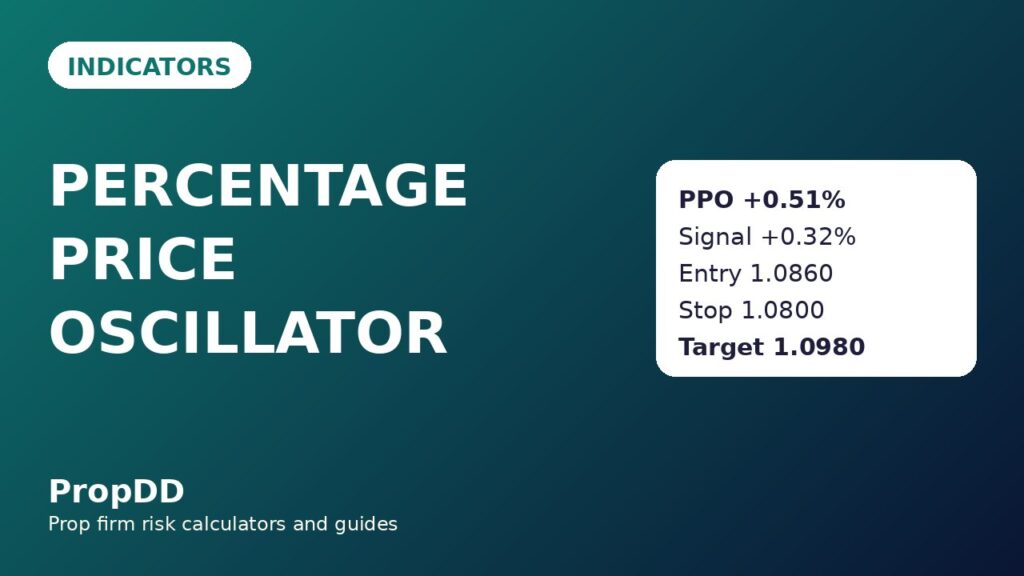
- One worked long, entry to targets
- Twelve trades with the filter on, twelve without it
- The mistakes that cost me money
- How the PPO fits prop firm rules
- Frequently asked questions
The indicator is the percentage price oscillator, or PPO. It is the same two-moving-average idea as MACD, but expressed as a percentage instead of a price difference — and that one change makes momentum comparable across pairs, across sessions, and across the whole funded-account watchlist. This guide is the full version: what the PPO measures, its formula worked by hand, the settings I use on a funded account, how I read its three signals, the cross-pair trick MACD cannot do, one worked long trade with the sizing maths under a 5,000-dollar daily loss limit, and the mistakes that cost me money before I learned them.
What the percentage price oscillator actually measures
The PPO measures the gap between a fast exponential moving average and a slow one, as a percentage of the slow one. When the fast average sits above the slow average, the PPO is positive and short-term momentum is stronger than the longer-term trend. When the fast average sits below the slow one, the PPO is negative and momentum is fading or reversing. The line oscillates around zero, and the zero cross is exactly the moment the two averages cross on the price chart — the same event MACD traders watch, restated in units that mean the same thing on every pair.
That percentage restatement is the whole point. A MACD reading of 0.0018 on EURUSD and 0.42 on USDJPY cannot be ranked, because a pip on USDJPY is not a pip on EURUSD. A PPO reading of 0.51 percent on EURUSD and 0.22 percent on GBPUSD can be ranked directly: the first pair’s fast average is half a percent above its slow average, the second’s is less than a quarter of a percent above its own. On a funded account, where I am allowed a limited number of trades a day and every trade must justify its slice of the daily loss limit, ranking momentum across pairs is not a nice extra. It is how I decide which setup gets the risk.
One warning before the maths: the PPO is not a new indicator family. If you already trade MACD, you already understand most of the PPO. Its edge is narrow and specific — comparability — and this guide treats it that way: a ranking and timing tool, not a prediction machine.
The formula, worked by hand
The standard PPO uses a 12-period fast EMA, a 26-period slow EMA and a 9-period signal line, which is the EMA of the PPO itself. The histogram is simply the PPO minus its signal line. Here is the formula, and then the same formula with real numbers from a EURUSD chart, so you can check every step.
| Step | Formula | Worked EURUSD example |
|---|---|---|
| 1. Fast average | 12-period EMA of price | 1.0895 |
| 2. Slow average | 26-period EMA of price | 1.0840 |
| 3. Difference | Fast EMA minus slow EMA | 1.0895 minus 1.0840 = 0.0055 |
| 4. PPO | Difference divided by slow EMA, times 100 | 0.0055 divided by 1.0840 times 100 = 0.51 percent |
| 5. Signal line | 9-period EMA of the PPO | 0.32 percent |
| 6. Histogram | PPO minus signal line | 0.51 minus 0.32 = plus 0.19 percent |
Read that result in plain language: EURUSD’s fast average is running 0.51 percent above its slow average, and the PPO itself is 0.19 percentage points above its own signal line, so momentum is not only positive but still accelerating. A PPO of 0.51 percent on a pair like EURUSD is a meaningful gap — the averages have separated by roughly 55 pips — while the same 0.51 percent on a faster pair would mean the same proportional separation, which is exactly why the ranking works. The percentage price oscillator overview sets out the same 12, 26, 9 construction and the percentage normalisation behind it, and it is worth reading if you want the textbook version alongside this funded-account one.
Two details matter more than they look. First, the denominator is the slow EMA, not price itself — so a single spike candle cannot yank the PPO around the way it yanks a close-based reading. Second, the signal line is an EMA of the PPO, not of price, so a signal-line cross means momentum’s own trend has turned. Both are why the PPO feels calmer than MACD on the same chart, even though both are built from the same averages.
The settings I use on a funded account
I use the standard 12, 26, 9 settings, and I do not optimise them per pair. Optimised settings are the fastest way to build an indicator that works beautifully on last month’s chart and fails on this month’s live account, and a funded account is the wrong place to discover that. What I do change is the timeframe and the filter around the signal, because those are decisions about the account’s rules, not about curve-fitting the indicator.
| Setting | What I use | Why it fits a funded account |
|---|---|---|
| Fast / slow / signal | 12 / 26 / 9 | Standard construction; comparable with every published PPO reading and with my own journal history |
| Primary timeframe | H4 for direction, H1 for entries | H4 keeps me out of intraday chop; H1 gives entries without the noise of M15 |
| Pairs | EURUSD, GBPUSD, USDJPY only | Three liquid majors; the PPO ranking is only useful when spreads and fills are clean |
| Signal filter | Trade signal crosses only in the direction of the H4 PPO | An H1 cross against the H4 PPO is counter-trend noise more often than it is an opportunity |
| News filter | No new entries 30 minutes either side of red-folder news | PPO gaps on news candles are meaningless; the averages have not had time to mean anything |
| Daily cap | Maximum two PPO trades per day | Stops the indicator becoming an overtrading machine on choppy days |
The H4-direction rule is the filter that turned this indicator from a losing system into a working one for me. In my early PPO weeks I traded every H1 signal cross and the results were roughly breakeven before costs — momentum on H1 reverses constantly inside an H4 trend. Once I required the H4 PPO to agree with the H1 cross, the trade count fell by about half and the win rate on the rest rose sharply. The indicator did not change. The permission to trade it did.
How to read the three signals
The PPO gives three signals, and they are not equal. I rank them, trade only the first two, and use the third as a warning rather than an entry trigger. Beginners usually do the opposite — they trade every divergence they spot and ignore the boring crosses — and that ordering mistake is expensive.
| Signal | What it looks like | How I trade it |
|---|---|---|
| Signal-line cross | PPO crosses above its 9-period signal line (long) or below it (short) | My entry trigger, but only in the direction of the H4 PPO |
| Zero-line cross | PPO crosses above zero (long) or below zero (short) | Trend confirmation; I use it to stay in a trade, not to enter one |
| Histogram expansion | Histogram bars grow in the direction of the trade | Momentum is accelerating; I hold, and I do not add |
| Histogram contraction | Histogram bars shrink toward zero while price still trends | Early warning to tighten the stop or take the partial, never a reversal entry on its own |
| Divergence | Price makes a new high but the PPO makes a lower high, or the mirror at lows | A warning only; I need a signal-line cross in the new direction before I act on it |
Why is the signal-line cross the entry and the zero cross only confirmation? Because the signal cross happens first and closer to the turn, while the zero cross confirms that the averages themselves have actually crossed — by which time a good part of the move may already be gone. On a funded account, where the daily limit punishes late entries that stop out, that timing difference matters. But the signal cross is also the noisiest of the three, which is why it needs the H4 filter: unfiltered, it fires in chop; filtered, it fires when the bigger momentum agrees.
Divergence is the signal most often traded badly. A bearish divergence — price higher, PPO lower — does not mean price will fall; it means the advance is decelerating, and decelerating advances often just go sideways before continuing up. I have lost more money shorting divergences than on any other single PPO mistake. The rule that fixed it: divergence puts a pair on my watchlist, it never puts me in a trade. The trade comes only when the PPO crosses its signal line in the divergence’s direction, with the H4 PPO agreeing.
The cross-pair trick MACD cannot do
This is the section that justifies the PPO’s place on my charts, and it is the one I would keep if I had to delete everything else. On any morning, I rank my three pairs by their H4 PPO reading and I trade the strongest setup in the direction of the strongest reading. MACD cannot do this ranking at all, because its units are pair-specific. The table below is a real-shape example from a London morning, with the MACD column included so you can see the problem directly.
| Pair | H4 PPO reading | What it means | MACD reading, same moment |
|---|---|---|---|
| EURUSD | plus 0.51 percent | Fast average half a percent above slow average — strongest momentum | 0.0018 (points, not comparable) |
| GBPUSD | plus 0.22 percent | Positive but less than half as strong as EURUSD | 0.0031 (looks bigger, is actually weaker) |
| USDJPY | minus 0.31 percent | Negative — momentum is down, so no long setup here today | 0.42 (a different scale entirely) |
On MACD alone, GBPUSD’s 0.0031 looks like the strongest momentum of the three, and USDJPY’s 0.42 looks enormous. On PPO, the ranking is unambiguous: EURUSD first, GBPUSD second, USDJPY not a long candidate at all. That morning I traded EURUSD, not GBPUSD — the exact opposite of the choice I made in the opening story, when I was still reading MACD points as if they were comparable. The EURUSD long is the worked trade in the next section, and the GBPUSD trade I skipped chopped sideways all session and would have stopped me out.
There is a limit to this trick: PPO ranking compares momentum, not opportunity. A pair can have the strongest reading and still be a bad trade because it is sitting into a major level, or because red-folder news is due in twenty minutes, or because its spread has widened. The ranking decides which setup I look at first, not whether I take it. Levels, news and the daily-loss budget still have the final say — and on days when the strongest pair fails those checks, I take no trade rather than dropping down the ranking just to be in the market.
One worked long, entry to targets
The trade below is the EURUSD long from that London morning, built from my journal entries. The PPO had crossed above its signal line on H1 while the H4 PPO sat at plus 0.51 percent, price had pulled back to a level that had already held twice, and there was no red-folder news within the hour. Every filter passed, so the trade earned its risk.
| Step | Level | Reason |
|---|---|---|
| H4 PPO | plus 0.51 percent | Direction filter passed — momentum is up on the bigger timeframe |
| H1 signal cross | PPO 0.41 percent crosses signal 0.38 percent | Entry trigger — momentum’s own trend turned up on the entry timeframe |
| Entry (long) | 1.0860 | On the pullback to the twice-held level, after the cross, not before it |
| Stop | 1.0800 | Below the pullback swing low — if price trades here, the momentum thesis is wrong |
| Risk | 60 pips | 1.0860 minus 1.0800 |
| Size at 500 dollars risk | 0.83 lots | 500 divided by 60 pips divided by 10 dollars per pip per lot |
| First target (1R) | 1.0920 | Entry plus 60 pips — worth 500 dollars at 0.83 lots |
| Second target (2R) | 1.0980 | Entry plus 120 pips — worth 1,000 dollars at 0.83 lots |
The sizing formula never changes, whatever the indicator. My account is 100,000 dollars with a 5,000-dollar daily loss limit, and I risk 500 dollars per trade — 0.5 percent of the account, 10 percent of the daily limit. That budget survives ten consecutive losers before the day is breached, which is the whole point: the PPO will give losing signals, sometimes several in a row, and the account must still be standing when the good ones arrive.
| Stop distance | Size at 500 dollars risk | Value of 1R |
|---|---|---|
| 40 pips | 1.25 lots | 500 dollars |
| 50 pips | 1.00 lot | 500 dollars |
| 60 pips | 0.83 lots | 500 dollars |
| 80 pips | 0.63 lots | 500 dollars |
| 100 pips | 0.50 lots | 500 dollars |
On the day itself, price reached the first target in the London morning, I took half off and moved the stop to breakeven — the same partial-close routine I use on every funded trade — and the second half reached the second target before New York lunch. Total: 750 dollars on a 500-dollar risk, 1.5R. Note what the PPO did not do: it did not pick the entry level, set the stop, or size the trade. The level, the swing low and the 500-dollar budget did those jobs. The PPO’s job was narrower — it told me momentum had turned, in which direction, and that EURUSD deserved the risk more than GBPUSD that morning.
Twelve trades with the filter on, twelve without it
I tested this the only way that means anything on a funded account: I logged every PPO signal-line cross I saw over several weeks, split them into the ones that passed all the filters — H4 agreement, no news within 30 minutes, maximum two trades a day — and the ones that failed at least one, and compared the two sets at the same 500-dollar risk. The filtered set is the strategy. The unfiltered set is what happens when you trade the indicator instead of the rules.
| Set | Trades | Winners | Losers | Net result | Best single day |
|---|---|---|---|---|---|
| Filtered (all rules passed) | 12 | 8 | 4 | plus 9R, plus 4,500 dollars | 1,000 dollars, 22.2 percent of net — inside the 30 percent consistency cap |
| Unfiltered (at least one rule failed) | 10 | 3 | 7 | minus 3R, minus 1,500 dollars | — |
The filtered winners were worth 13R in total — five trades at 2R and three at 1R — against 4R of losses, for a net of plus 9R. The unfiltered set lost 3R net despite three winners, because the losers included two full-stop trades taken against the H4 PPO and one taken into a news spike that gapped through the stop. The lesson is the reverse of what most indicator guides imply: the indicator on its own is roughly breakeven before costs, and the filters are what make it tradeable.
One more funded-account detail from the log: the filtered set’s best day was 1,000 dollars, which is 22.2 percent of the 4,500-dollar net — inside the 30 percent consistency cap most firms enforce. The unfiltered set’s best day was also its problem: a single 2R winner early in the sequence tempted me to take three more trades that day to chase the feeling, and all three lost. The daily cap of two trades exists precisely for that moment, when a good morning makes the third trade feel free. It is never free. It costs a slice of the daily limit like every other trade.
The mistakes that cost me money
Every mistake below cost me at least one full stop before I wrote it down as a rule. I list them in the order I made them, because the order is also the order most traders will make them in.
| Mistake | What happened | The rule that replaced it |
|---|---|---|
| Reading MACD points as comparable | Took GBPUSD over EURUSD because 0.0031 looked bigger than 0.0018 | Rank pairs by PPO percent only, never by MACD points |
| Trading every H1 cross | Roughly breakeven before costs, then negative after spread | Trade crosses only in the direction of the H4 PPO |
| Shorting divergences directly | Multiple full stops as decelerating advances went sideways, then continued up | Divergence is a watchlist flag; the trade needs a signal-line cross |
| Entering into news | A news candle gapped through the stop for more than the planned 500 dollars | No new entries 30 minutes either side of red-folder news |
| Optimising the settings per pair | Settings that were perfect last month failed on the live account this month | Standard 12, 26, 9 on every pair, always |
| Taking a third trade after a good morning | Three extra trades, three losses, one day’s profit given back | Maximum two PPO trades per day, no exceptions for winning streaks |
The common thread: every mistake was a moment when I let the indicator make a decision that belonged to something else — the timeframe filter, the news calendar, the sizing budget, or the daily cap. Kept in its place — momentum ranking and timing, nothing more — the PPO earns its chart space. Promoted beyond that, it costs exactly what every over-promoted indicator costs: a daily limit, one stop at a time.
How the PPO fits prop firm rules
A funded account is not a normal account with smaller size. It is an account with hard edges — a daily loss limit, a maximum drawdown, a consistency rule, and usually a rule against gambling-style behaviour — and every tool on the chart has to respect those edges or it will eventually push you through one of them. The PPO fits those edges well, provided it is used the way this guide describes.
On the daily loss limit, the PPO’s contribution is the trade count. Two trades a day at 500 dollars risk is a maximum planned daily loss of 1,000 dollars, one fifth of my 5,000-dollar limit, and the unfiltered version of this system routinely took five or six trades a day — which is how a breakeven indicator becomes a breached account. On consistency, the filtered log’s best day at 22.2 percent of net profit sits comfortably inside the usual 30 percent cap, because the two-trade cap and the 1R/2R target structure prevent any single day from dominating the total. On drawdown, the H4 filter matters most: counter-trend trades are the ones that run furthest against you before stopping out, and filtering them out is worth more to the maximum-drawdown number than any clever exit rule I have tried.
Where does the PPO sit among the other indicators on this site? It is the percentage cousin of MACD, built from the same 12 and 26 averages — read that guide if you want the points-based version and its own funded-account rules. It shares its smoothing philosophy with the EMA guide, since both EMAs in the PPO are the same tool, and it belongs in the same momentum family as the True Strength Index, which smooths price changes twice where the PPO smooths averages once. If you run all three, run them as a committee with the PPO as the ranking vote, not as three separate systems — three momentum votes for the same trade is one vote counted three times. And before any PPO trade, I check the day’s remaining budget on the max daily drawdown calculator, because an indicator can tell you a trade is good and still be wrong about whether you can afford it today.
Frequently asked questions
Is the PPO just MACD with different maths?
Almost, and the difference matters. MACD plots the difference between the 12 and 26 EMAs in price points; the PPO plots the same difference as a percentage of the 26 EMA. Same signals, same crosses, same histogram logic — but only the PPO’s readings can be compared across pairs, because only the PPO’s units mean the same thing everywhere.
What settings should I use for the PPO on a funded account?
Use the standard 12, 26, 9. I trade H4 for direction and H1 for entries, and I do not optimise the periods per pair. Optimised settings backtest beautifully and fail live, and a funded account is the wrong place to learn that twice.
Can I trade the PPO on its own?
You can, but my log says you should not expect much from it unfiltered — roughly breakeven before costs in my test. The H4 direction filter, the news filter and the two-trade daily cap are what made the filtered set profitable. The indicator is the timing tool; the filters are the strategy.
How is a PPO divergence different from an RSI divergence?
The mechanics are the same — price makes a new extreme, the oscillator does not — but the PPO divergence measures the averages separating more slowly, while an RSI divergence measures closing strength fading. Either way, treat divergence as a warning, not an entry: wait for a signal-line cross in the divergence’s direction before trading it.
Does the PPO work on gold or indices, or only forex pairs?
The percentage construction works on anything with an EMA, and it is arguably more useful on gold, where point values are large and hard to compare. But my funded-account rules in this guide — the H4/H1 structure, the 500-dollar risk budget, the news filter — were built and tested on EURUSD, GBPUSD and USDJPY. If you take the PPO to gold, re-test the filters there before risking funded capital on them.
What is the biggest mistake traders make with the PPO?
Trading every signal cross without a higher-timeframe filter. On H1 alone, the cross fires constantly in chop, and each false cross costs spread plus a stop. Requiring the H4 PPO to agree cut my trade count roughly in half and removed most of the losing trades with it.
Risk disclaimer: this article describes how I use the percentage price oscillator on my own funded account. It is educational content, not financial advice. Prop firm rules differ between firms and change without notice — always check your own firm’s current rules before trading any indicator or strategy described here, and never risk money you cannot afford to lose.



