On a Tuesday in late October I shorted EURUSD into what looked like a tired rally, twice. The first short lost two hundred and forty dollars. The second, taken an hour later at a slightly better price, lost the same again. What I did not see was that the volume behind the rally was growing with every push. The buyers were not tired. They were accumulating. My average treated a quiet candle and a heavy candle as equals, and that equality cost me four hundred and eighty dollars before lunch. That afternoon I put the volume weighted moving average on the same chart, and the rally I had been fading was sitting comfortably above a rising VWMA the whole time.
In this article
- What the VWMA actually measures
- The formula, worked with real numbers
- VWMA vs SMA, EMA and VWAP: the comparison that matters
- Best settings for prop-firm trading
- My worked example: the pullback trade I tested
- Ten trades on the VWMA pullback
- When the VWMA fails
- My daily VWMA routine
- How it fits prop firm rules
- Frequently asked questions
The volume weighted moving average, VWMA for short, is a moving average that lets volume vote. A bar that traded heavily counts for more than a bar that barely traded, so the line follows where the money actually went instead of where the clock went. For a funded trader that distinction is worth real money, because a prop firm daily loss limit does not care whether your setup looked pretty. It cares whether you were trading with the volume-backed trend or against it. This guide covers what the VWMA measures, its formula worked with real numbers, the settings I use on a funded account, and the pullback trade I tested on EURUSD, sized so one loss never takes more than ten percent of my daily limit.
What the VWMA actually measures
A simple moving average answers one question: where has price been, on average, over the last twenty bars? Every bar counts the same, so a sleepy Asian-session bar counts exactly as much as a London-open bar where ten times the volume changed hands. The market itself does not treat those bars as equals. The VWMA fixes the weighting: it multiplies each close by that bar’s volume, adds the results up, and divides by the total volume. Bars that traded heavily pull the line toward themselves. Bars that traded lightly barely move it.
What you get is a trend line that leans toward the prices where the most trading happened. When price sits above a rising VWMA, the bulk of recent trading happened lower and the buyers who bought there are in profit: a healthy trend. When price sits below a falling VWMA, the volume happened higher and the sellers are in control. When price keeps crossing the line back and forth, the volume has no conviction either way and the market is ranging. The line does not predict anything. It reports where the weight of recent trading sits.
One honest caveat belongs here first. On forex CFDs there is no central exchange and therefore no true traded volume: what your platform calls volume is tick volume, the number of price updates inside the bar. It is a proxy, not a count of contracts, but a good one, because bars with heavy real trading also produce heavy tick activity. The same caveat applied to the money flow index guide, and the practical answer is the same: use the VWMA for direction and pullback entries, never as a precise volume measurement. On index and gold CFDs the tick feed is dense enough that the proxy is reliable. On an exotic pair in the Asian session it is thin, and I simply do not trade the setup there.
The formula, worked with real numbers
The formula is short enough to check by hand, and checking it once shows exactly why the line behaves the way it does. Over n bars, multiply each bar’s close by its volume, add the products together, and divide by the total volume of the same n bars. The VWMA is the volume-weighted average price of the lookback window. No smoothing constant, no hidden step.
| Bar | Close | Tick volume | Close x volume |
|---|---|---|---|
| 1 | 1.0880 | 1,200 | 1,305.60 |
| 2 | 1.0885 | 1,500 | 1,632.75 |
| 3 | 1.0890 | 900 | 980.10 |
| 4 | 1.0895 | 2,100 | 2,287.95 |
| 5 | 1.0900 | 1,800 | 1,962.00 |
| Total | 7,500 | 8,168.40 |
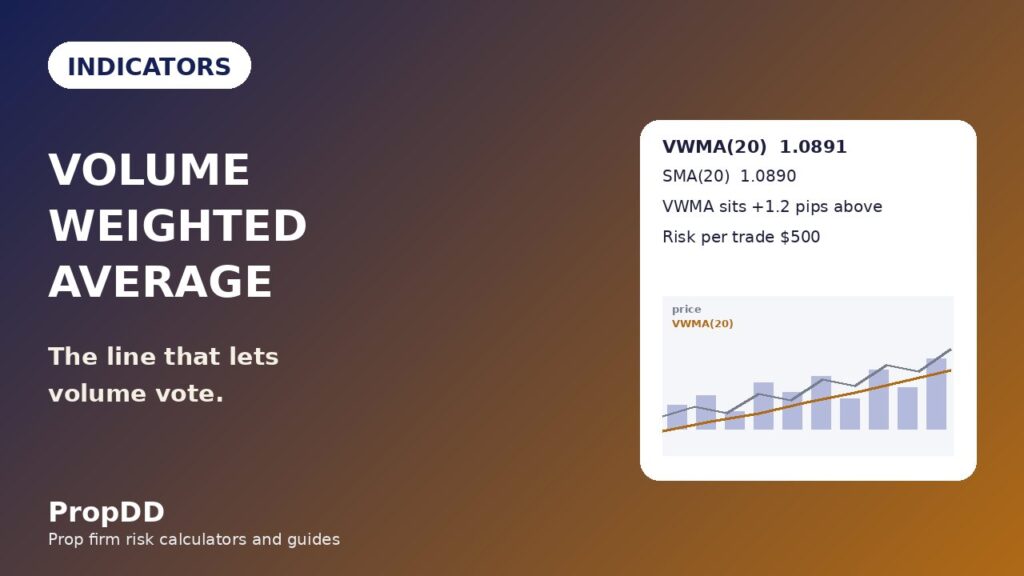
The five closes above are a quiet EURUSD drift upward, and the volumes are the point. The highest closes, bars four and five, also carry the heaviest volume: two thousand one hundred and one thousand eight hundred. Divide the total of the products, eight thousand one hundred and sixty-eight point four, by the total volume, seven thousand five hundred, and the VWMA is 1.08912. The simple moving average of the same five closes is 1.08900. The VWMA sits one point two pips above the SMA, because the heavy-volume bars were the higher ones and they dragged the line up with them. That one point two pips is the whole indicator in miniature.
Reverse the volumes and the lesson flips: heavy volume on the lowest closes would have printed the VWMA below the SMA, showing the selling had the weight even while closes drifted up. That is the signal the SMA cannot give you, because it never looks at volume. The formula to remember is one line: VWMA equals the sum of close times volume, divided by the sum of volume, over your chosen lookback.
VWMA vs SMA, EMA and VWAP: the comparison that matters
Traders confuse the VWMA with three neighbours, and each confusion costs money in a different way. The SMA weights every bar equally. The EMA weights recent bars more heavily, which makes it faster but also more nervous. The VWMA weights bars by volume, so it is faster exactly when the market is active and slower exactly when it is quiet: a genuinely different behaviour. The VWAP is not a moving average in the usual sense at all: it accumulates from the session open and never drops old bars, so it answers what the average buyer paid today, not what the trend of the last twenty bars is.
| Line | What weights each bar | Window | Resets | Best use on a funded account |
|---|---|---|---|---|
| VWMA | Volume | Fixed, e.g. 20 bars | Never, rolls forward | Volume-backed trend and pullback entries |
| SMA | Nothing, all equal | Fixed, e.g. 20 bars | Never, rolls forward | Slow trend filter, nothing more |
| EMA | Recency | Fixed, e.g. 20 bars | Never, rolls forward | Fast trend filter, noisy in ranges |
| VWAP | Volume, cumulative | Whole session | Every session open | Intraday fair value, mean reversion to the line |
On the chart, the difference is plain. In a volume-backed trend the VWMA hugs price more tightly than the SMA, because the heavy bars are the trending bars, and it whipsaws less than the EMA, because a single quiet bar cannot drag it. In a range, all three lines flatten and tangle, and none of them is tradeable. I reach for the VWAP when I want to know whether I am buying above or below today’s average price, and for the VWMA when I want to know whether the trend of the last twenty bars has volume behind it. My VWAP guide covers the session-anchored version in full. For a second opinion on the moving-average family, the For Traders moving-averages guide puts SMA, EMA, Hull and VWAP side by side with the same prop-firm framing.
Best settings for prop-firm trading
The VWMA has one setting that matters, the lookback, and two values cover nearly all funded-account use. Twenty periods is my working line: fast enough to catch a pullback entry on the hourly chart, slow enough not to flip on every fifteen-minute wobble. Fifty periods is my filter line: it defines the trend I am allowed to trade and nothing else. Shorter than twenty turns the line into noise on a tick-volume feed, because a single heavy bar can drag a ten-period VWMA several pips. Longer than fifty turns it into wallpaper. The table below is the whole settings system: an indicator with one knob cannot be curve-fitted into a false sense of precision.
| Timeframe | VWMA period | Job | Rule |
|---|---|---|---|
| Daily | 50 | Trend filter | Only trade in the direction the daily VWMA(50) slopes |
| 4-hour | 20 | Swing bias | Pullbacks to a rising H4 VWMA(20) are long candidates only |
| 1-hour | 20 | Entries | Enter on the pullback touch, stop below the line |
| 15-minute | 20 | Session bias | Confirm direction at the London or New York open, never enter here |
Two rules keep the system honest. First, never trade a VWMA signal against the daily VWMA(50) slope: if the daily line slopes down and the hourly line gives a long pullback entry, the entry is a counter-trend trade, and counter-trend trades on a funded account pay for their optimism out of the daily loss limit. Second, never use the VWMA where the tick feed is thin. The Asian session on an exotic pair can print bars with a tenth of London’s tick volume, and a VWMA built on that feed is mostly guessing. EURUSD and GBPUSD in London and New York, gold in New York: those are the feeds where the volume weighting means something. The EMA guide uses the same session discipline for the same reason. Thin feeds lie.
My worked example: the pullback trade I tested
Here is the trade, with the real numbers, on a one-hundred-thousand-dollar funded account with a five-thousand-dollar daily loss limit and a five-hundred-dollar risk budget per trade, half a percent of the account. EURUSD on the hourly chart, VWMA(20) rising, price pulling back toward the line after a London morning push. The daily VWMA(50) slopes up, the four-hour VWMA(20) slopes up, and the hourly line is rising at 1.0888. Price touches 1.0892, four pips above the line, and prints a bullish hourly candle with a long lower wick. That is the entry: long at 1.0892, with the line itself as the invalidation.
I checked the size against the max daily drawdown calculator before I clicked anything. The table below is what I tested: the stop is fifteen pips, the risk is five hundred dollars, and the position size follows from those two numbers, not from a feeling about the setup.
| Figure | Value | How it is calculated |
|---|---|---|
| Account | $100,000 | Funded account balance |
| Daily loss limit | $5,000 | 5% of the account |
| Risk per trade | $500 | 0.5% of the account, 10% of the daily limit |
| Entry (long) | 1.0892 | Pullback touch, 4 pips above VWMA(20) at 1.0888 |
| Stop loss | 1.0877 | 15 pips, below the VWMA and below the pullback low |
| Target | 1.0922 | 30 pips, 2R, just under the prior swing high at 1.0925 |
| Position size | 3.33 lots | $500 risk / 15 pips = $33.33 per pip, at $10 per pip per lot |
| Reward if right | +$1,000 | 30 pips x $33.33 per pip, 2.0R |
The trade ran to target the same afternoon: price never closed below the VWMA, and the thirty-pip target filled at 1.0922 for one thousand dollars. Two details matter more than the win. First, the stop sat below the line, not below a round number, so the trade could only lose if the volume-backed trend itself failed, which is the correct invalidation for this setup. Second, the risk was ten percent of the daily limit, so five consecutive losses like this one still leave half the daily limit untouched. The indicator picks the trade, and the daily loss limit picks the size.
Ten trades on the VWMA pullback
One trade proves nothing, so I ran the same setup for ten sessions, one trade a day, same rules, same half-percent risk, same fifteen-pip stop and thirty-pip target. The rules were fixed before the first trade: daily VWMA(50) sloping in my direction, hourly VWMA(20) sloping the same way, entry on the pullback touch, stop below the line, target at two times the risk. No discretionary overrides, no moving the stop, no taking profit early. The table below is the log.
| Day | Pair | Result | P&L | Running total |
|---|---|---|---|---|
| 1 | EURUSD | Win, 2.0R | +$1,000 | +$1,000 |
| 2 | GBPUSD | Loss, 1.0R | -$500 | +$500 |
| 3 | EURUSD | Win, 2.0R | +$1,000 | +$1,500 |
| 4 | EURUSD | Win, 2.0R | +$1,000 | +$2,500 |
| 5 | GBPUSD | Loss, 1.0R | -$500 | +$2,000 |
| 6 | EURUSD | Win, 2.0R | +$1,000 | +$3,000 |
| 7 | GBPUSD | Loss, 1.0R | -$500 | +$2,500 |
| 8 | EURUSD | Win, 2.0R | +$1,000 | +$3,500 |
| 9 | EURUSD | Win, 2.0R | +$1,000 | +$4,500 |
| 10 | GBPUSD | Loss, 1.0R | -$500 | +$4,000 |
Six wins, four losses, sixty percent win rate, net plus four thousand dollars. Expectancy is nought point eight R per trade: six wins at two R minus four losses at one R, divided by ten trades. The number that matters most for the funding rules is the best day: a single one-thousand-dollar win, twenty-five percent of the four thousand total, inside the thirty percent best-day cap most firms enforce. The consistency rule guide explains why that percentage, not the profit, is the number that ends funded accounts. The worst day was a single five-hundred-dollar loss, ten percent of the daily limit. Ten trades is a small sample, but the shape is right: bounded losses, a positive expectancy, and no single day dominating the total.
When the VWMA fails
The VWMA fails in four ways, and three of them are my fault when they happen. The first is the news spike: a red-folder release prints one enormous high-volume candle, and that single bar drags the twenty-period VWMA several pips toward itself, because volume is the weight. For the next few bars the line describes the news candle, not the market. I do not trade the VWMA within thirty minutes either side of CPI, NFP or a rate decision. The second failure is the flat market. In a range the VWMA goes horizontal and price crosses it a dozen times a session, and every crossing looks like a signal. It is not. A flat VWMA is the indicator telling you there is no trend to trade, and the correct response is to wait.
The third failure is fading the line. Price stretched far above a rising VWMA looks overbought, and the temptation is to short it back to the line. That is exactly the trade that cost me four hundred and eighty dollars in the opening story: the stretch was volume-backed, the buyers were not tired, and the line kept rising to meet price instead of price falling to meet the line. A stretched VWMA is a strong trend, not an overbought signal. The fourth failure is the thin feed: on an exotic pair, or in the dead hours between sessions, the tick volume is so light that one medium bar can swing the VWMA. If the feed is thin, the indicator is decoration.
My daily VWMA routine
I run this routine every trading morning, and it takes about fifteen minutes. The point is to decide, before the market opens, whether today is a VWMA day at all, and which direction I am allowed to trade if it is. Most mornings the answer is one pair and one direction, and that narrowness is the whole advantage: a funded account survives on the trades you do not take as much as the ones you do.
| Time | Check | Decision it forces |
|---|---|---|
| 07:00 | Daily VWMA(50) slope on EURUSD and GBPUSD | Direction for the day; flat means no trades |
| 07:05 | News calendar for red-folder events | No VWMA entries within 30 minutes either side |
| 07:10 | H4 VWMA(20) slope and distance from price | Whether swing bias agrees with the daily filter |
| 08:00 | London open, H1 VWMA(20) slope | Whether the hourly trend is alive or flat |
| 08:00-11:30 | Wait for the pullback touch, one trade maximum | Entry only on the touch; no chasing |
| After the trade | Log the result; stop for the day if down $500 | Personal daily stop enforced early |
The last row is the one that matters, and it is the reason my personal daily stop sits at five hundred dollars, one losing trade, ten percent of the firm’s five-thousand-dollar limit. A VWMA pullback system loses four trades out of ten by design, and two losses in a row are normal. If I let a normal losing streak run to the firm’s limit, the system is not the problem. My discipline is. One trade a day, one loss and I stop.
How it fits prop firm rules
The VWMA fits funded trading for a boring reason: it makes you trade with the volume-backed trend, in small size, with a stop that means something. The daily loss limit is the binding constraint on every funded account, and this system respects it three ways: The risk per trade is half a percent, ten percent of the daily limit, so no single loss can hurt the account. The stop sits below the volume-weighted line, so a loss means the trend failed, not that noise took you out. And the one-trade-a-day rule caps the total daily risk at the same half percent.
The consistency rule is the second fit. A two-to-one system with a sixty percent win rate produces steady, same-sized winning days, and the ten-trade log above shows the best day at twenty-five percent of the total profit, inside the thirty percent cap. Systems that produce one giant winning day and nine flat ones are the ones that trip the consistency rule; the VWMA pullback does the opposite by construction, every win the same size and every loss the same size. The minimum trading days rule is the third fit: one trade a day clears it without ever forcing a trade on a day when the setup is not there. If the VWMA is flat, I still log the day, note the no-trade, and move on.
Frequently asked questions
What is the volume weighted moving average?
The VWMA is a moving average that weights each bar by its volume: over n bars it equals the sum of each close multiplied by its volume, divided by the sum of the volume. Bars that traded heavily pull the line toward themselves, so the line follows where the money went, not just where the clock went.
How is the VWMA different from the VWAP?
The VWAP accumulates every bar since the session open and resets each day, so it describes the whole day’s average price. The VWMA uses a fixed rolling window, usually twenty bars, and drops old bars as new ones arrive, so it describes the recent trend. Use the VWAP for the day’s fair value and the VWMA for the trend’s health.
What are the best VWMA settings for prop firm trading?
Twenty periods on the hourly chart for entries and fifty on the daily chart as the trend filter. Shorter than twenty turns the line into noise on a tick-volume feed, and longer than fifty turns it into wallpaper.
Does the VWMA work on forex, where there is no real volume?
It works as a direction and pullback tool, with one honest caveat: forex platforms feed tick volume, the number of price updates, not central traded volume. Tick volume is a good proxy on dense feeds like EURUSD and gold in London and New York, and a poor one on thin feeds. Use it where the feed is dense.
Can the VWMA alone pass a prop firm challenge?
No indicator alone passes a challenge. The VWMA picks the direction and the entry, but the pass comes from the risk rules around it: half a percent per trade, a stop below the line, one trade a day, and a personal daily stop at ten percent of the firm’s limit.
Why did my VWMA trade lose when price was above the line?
Because above a rising VWMA is a trend condition, not a guarantee. The usual causes are a news spike distorting the line, a flat VWMA in a range printing false crossings, or a stop placed too close to the line. Check the news calendar, check the slope, and put the stop below the pullback low, not just below the line.
Risk disclaimer: this article describes how I trade a simulated funded account for education. It is not financial advice. Prop firm trading involves the risk of losing the challenge fee and the account, and past results, including the ten-trade log above, do not guarantee future results. Always check your firm’s current rules before trading any setup described here.



