My pullback trades used to fail in the planning, not the patience. I would spot a beautiful retracement into the 50% level, feel disciplined about it, and then improvise the stop — a bit too tight so the “maths worked”, a bit too loose when I got scared. On a funded account, an improvised stop on a pullback trade is how you donate 0.8% to a setup you read perfectly. The Trend Pullback Calculator at the top of this page removes the improvisation. You give it the impulse swing high and low, the pullback depth, and your risk budget; it hands back the entry zone, the stop beyond the swing extreme, the exact lot size, and the 2R/3R targets. It is the arithmetic engine for my trend pullback strategy guide — the five-rule plan this tool was built to execute. If you have not read that guide yet, start there; this page is the calculator that does its maths for you.
In this article
What the Calculator Checks First
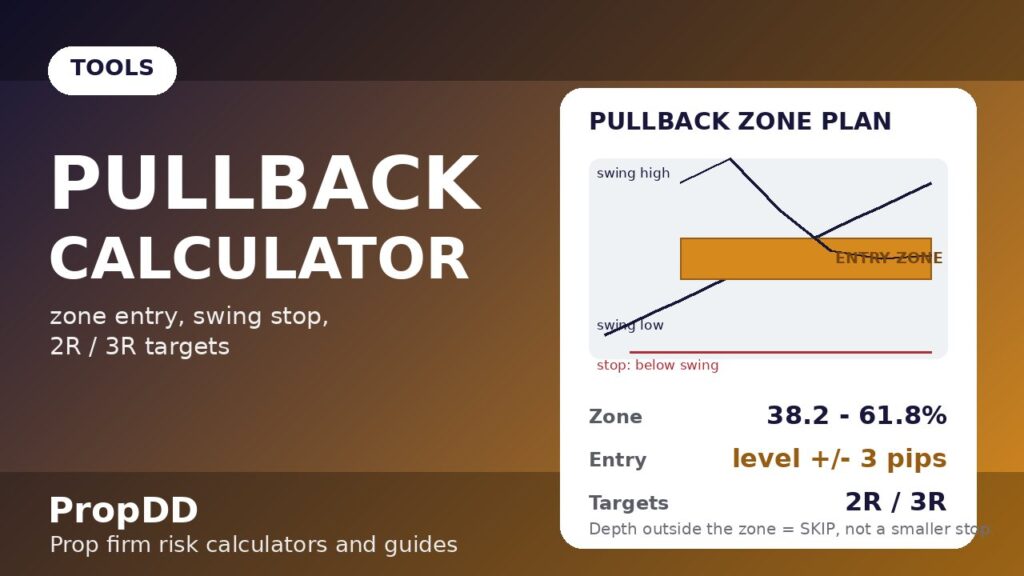
Most traders type an entry and stop into a calculator and never ask whether the pullback deserved a trade at all. This one asks first. It reads your pullback depth and gates the whole plan on the strategy’s zone: only 38.2% to 61.8% of the impulse leg counts as a tradeable pullback. Shallower than 38.2% is noise — a 10-pip dip inside a 90-pip leg is not a discount, it is a pause. Deeper than 78.6% means the leg is probably dead and you are staring at a reversal, not a pullback, which is a different strategy with different rules. If the depth fails the gate, the verdict is SKIP — no entry zone, no stop, no debate. That ordering matters on a prop firm account, where half the bad “pullback” trades I took in 2024 were really the start of a reversal I refused to name.
Only after the depth passes does the tool plan the trade. The entry zone is the pullback level plus and minus your buffer — three pips by default on majors — because the exact retracement line is rarely the exact turn; the zone is where the 15-minute trigger candle does its work. The stop sits beyond the swing extreme by default five pips, because the swing extreme is the invalidation and the buffer keeps spread and stop-hunts from taking you out of a good idea. The 2R and 3R targets follow the strategy rule: minimum two-to-one reward, since counter-swing entries that only pay 1R do not survive the losers.
The Pullback Formula
Impulse leg = |Swing high − Swing low|
Long pullback level = Swing high − (Depth % × Leg) | Short pullback level = Swing low + (Depth % × Leg)
Entry zone = Pullback level ± (Entry buffer × Pip size)
Long stop = Swing low − (Stop buffer × Pip size) | Short stop = Swing high + (Stop buffer × Pip size)
Stop distance (pips) = |Pullback level − Stop| ÷ Pip size
Lots = (Account × Risk %) ÷ (Stop distance × Pip value per lot)
2R / 3R target = Entry ± (2 or 3 × Stop distance × Pip size)
Worked: EURUSD long — swing high 1.0960, swing low 1.0880, depth 50%. Leg = 80 pips. Pullback level = 1.0960 − 40 pips = 1.0920. Entry zone = 1.0917–1.0923 (3-pip buffer). Stop = 1.0880 − 5 pips = 1.0875. Stop distance = 45 pips. $100,000 × 0.5% = $500 risk → 500 ÷ (45 × $10) = 1.11 lots. 2R target = 1.1010, 3R = 1.1055. $500 risk is inside the $5,000 daily limit → verdict: TRADE IT.
One Leg, Worked End to End
A real leg from my journal, the kind I now plan in thirty seconds. EURUSD ripped 80 pips through the London open — swing low 1.0880 at 08:00, swing high 1.0960 at 10:30 — then started drifting back. The 50% retracement at 1.0920 sat on the rising 20 EMA, which is the strategy’s “whichever is deeper” zone in its purest form. The calculator’s depth gate passed at exactly 50%, the entry zone printed 1.0917–1.0923, the stop went to 1.0875, and 1.11 lots carried my $500 risk. The 15-minute trigger candle closed back up at 1.0921 inside the zone — entry filled — and price never looked at the stop again: 2R tagged at 1.1010 before the New York lunch hour. The table below is the full anatomy of that trade as the calculator saw it:
| Check | Calculator output | What it meant |
|---|---|---|
| Depth gate | 50.0% — PASS | Inside the 38.2–61.8% zone, a real pullback |
| Entry zone | 1.0917 – 1.0923 | Trigger candle fired at 1.0921, inside the zone |
| Stop | 1.0875 | 5 pips beyond the swing extreme — the invalidation |
| Position size | 1.11 lots | $500 risk ÷ 45 pips — no guessing |
| 2R / 3R targets | 1.1010 / 1.1055 | 2R tagged; 3R left on the table by choice |
| Verdict | TRADE IT | Zone valid, size inside daily limit |
When the Calculator Says SKIP
The SKIP verdict is the feature I am proudest of, because it automates the discipline I used to break. It fires in four situations, all of them straight from the strategy rules. First, the depth is shallower than 38.2% — a dip, not a zone. Second, the depth is deeper than 78.6% — the leg is likely dead, and forcing a pullback entry into a reversal is how funded accounts die. Third, the trade risk exceeds your daily loss limit: one stop-out eating your whole day’s budget means the swing is too wide for your account plan, and since the stop is never negotiable, the trade is skipped, not shrunk. Fourth, the maths lands under 0.01 lots — technically tradeable, practically noise.
There is a fifth skip the calculator cannot make for you: the trend read. It checks the depth of the pullback, not whether the leg was a real trend. A 50% retracement of a choppy range is still a skip — the strategy demands price above a rising 20 EMA with the 20 above a rising 50 on H1. Pair this tool with my RSI divergence strategy guide for the flip side of this coin: when a pullback keeps failing and momentum starts diverging, that is the market telling you the trend is tired — and divergence gives you the reversal plan for it.
Gold, Indices and JPY Pairs
The pip-size selector exists because pullback maths is identical across instruments but the decimal places are not. On gold, a swing leg runs $15 to $30 with a pip size of 1 and a pip value near $100 per lot — the same 38.2–61.8% gate, the same buffer logic, wildly different lot sizes. On indices, set 0.1; on JPY pairs, 0.01. The one input you must get right on each instrument is the pip value per standard lot, because that is what converts your risk dollars into a position. If you are unsure what your broker quotes for gold, my max daily drawdown calculator page walks through pip-value conventions — get it wrong here and every number downstream is fiction.
| Instrument | Pip size | Typical H1 swing leg | What to watch |
|---|---|---|---|
| EURUSD / GBPUSD | 0.0001 | 60–120 pips | Buffers of 3 / 5 pips work as defaults |
| Gold (XAUUSD) | 1 | $15–$30 | Pip value ~$100/lot — sizes get small fast |
| USDJPY | 0.01 | 50–90 pips | Round-number zones (150.00) hold pullbacks best |
| NAS100 / US30 | 0.1 | 150–400 points | Legs are wide — SKIP verdict fires often, correctly |
My 5-Step Pullback Routine
The calculator is step three of a five-step routine I run every time, and the routine is what keeps the tool honest. One, confirm the trend on H1 — price above a rising 20 EMA, 20 above a rising 50, higher highs and higher lows. Two, mark the impulse leg and wait for price to reach the 38.2–61.8% zone or the 20 EMA, whichever is deeper. Three, run the numbers through this calculator and obey the verdict. Four, wait for the 15-minute candle to close back in the trend direction from inside the zone, then enter with the planned stop and targets attached — set-and-forget. Five, log the depth, the zone and the outcome in my trading journal, because the only way to know your real pullback edge is a hundred logged legs. Do this and the pullback becomes what it should be on a funded account: a mechanical, pre-planned trend-continuation entry with the stop drawn by the structure itself.
Frequently Asked Questions
Does the calculator replace my trend pullback strategy rules?
No — it executes them. The five-rule plan (H1 trend definition, 38.2–61.8% zone, 15-minute trigger, stop beyond the swing extreme, London/NY session filters) lives in my trend pullback strategy guide; this tool does the arithmetic that plan demands, including the SKIP verdict when the depth fails the zone gate.
Why does it say SKIP on a pullback that looks tradeable?
Usually the depth is outside the 38.2–61.8% gate — most commonly a shallow 20% dip that is noise, or an 85% retracement that is a reversal wearing a pullback’s clothes. The second cause is risk exceeding your daily loss limit. Both are deliberate: on a funded account, a strict zone filter is cheaper than a generous one.
Can I use it for short pullbacks too?
Yes — switch the direction to Short and the tool mirrors everything: the pullback level measures up from the swing low, the stop goes beyond the swing high, and the targets project downward. The 38.2–61.8% gate works identically in both directions.
How is this different from a Fibonacci retracement tool?
A Fib tool draws the levels; this one decides whether the pullback is tradeable and sizes the position. The depth gate, the swing-beyond stop, the lot-size maths from your risk budget, and the SKIP verdict are the parts a Fib retracement never gives you — and they are the parts that protect a daily loss limit.
What if price blows through the zone and keeps falling?
Then it was a reversal, not a pullback — and the stop beyond the swing extreme is exactly what gets you out cleanly. If momentum starts diverging at the lows while price keeps pushing, read my RSI divergence strategy guide: that is the plan for trading the reversal the pullback became.
Risk disclaimer: Trading on a funded or challenge account involves real risk of loss, including the loss of your evaluation fee. Pullback entries fail regularly — backtest any plan on demo for at least 30 trades before risking a challenge, and never risk money you cannot afford to lose.