I deleted a channel off my chart in the middle of a funded afternoon, and that was the smartest thing I did that week. It was a Tuesday, EURUSD on the hourly chart, and the channel I had drawn that morning looked perfect: price had touched the lower band three times and bounced every time. I bought the fourth touch, price sliced straight through the band, and by the time I cut the trade I was 380 dollars down on a day I had planned to risk 500 in total. The channel had not lied to me. It had done exactly what channels do: it redrew itself on the new bars, the slope flattened, and the band I bought had quietly moved twenty pips while I was watching the old line. I had traded a screenshot, not a live indicator.
In this article
- What the linear regression channel actually measures
- The formula, in plain numbers
- My funded settings: period, deviation, timeframe
- How I read its signals
- The worked trade: a lower-band pullback with full sizing maths
- The twelve-trade test: filtered versus unfiltered
- Where the channel fails on a funded account
- My daily routine with the channel
- How the channel fits prop firm rules
- Frequently asked questions
This article is the linear regression channel plan I use now on a 100,000 dollar funded account with a 5,000 dollar daily loss limit: what the channel actually measures, the formula in plain numbers, my funded settings, the band-touch rules I trade, a worked pullback with full sizing maths, and a twelve-trade test with the filter on versus off. It sits next to my volume profile article, but where volume profile tells me where the day’s business was done, the regression channel tells me whether the trend is still orderly enough to buy a pullback inside it.
What the linear regression channel actually measures
A linear regression channel is a straight line fitted through the last N closes so that the total squared distance from price to the line is as small as possible, plus two parallel bands above and below it. The middle line is the market’s average drift over that window. The bands show how far price normally wanders from that average. When the channel slopes up, the average drift is up. When it slopes down, the average drift is down. When it is flat, there is no drift worth trading, and that is the single most useful thing the channel tells a funded trader: flat means sit out.
Three readings matter, and only three. First, the slope: rising slope, I only look for longs; falling slope, only shorts; flat slope, no trades from this tool at all. Second, price position: price near the lower band of a rising channel is a pullback inside an uptrend; price near the upper band of a rising channel is extended, not a breakout to chase. Third, the fit quality, called R-squared: it runs from 0 to 1 and says how neatly price actually followed the line. A channel with an R-squared of 0.78 describes a genuinely orderly trend. A channel with an R-squared of 0.30 is a straight line drawn through noise, and trading its bands is guessing with extra steps.
The funded-account point is simple. A funded account punishes disorder: every whipsaw costs real room under a daily loss limit that does not reset until tomorrow. The regression channel is my disorder filter. If the slope is clear and the fit is strong, pullbacks have a structure I can put a stop behind. If either is missing, I am not being patient by waiting; I am refusing to pay for randomness.
The formula, in plain numbers
The maths looks intimidating and is not. The regression line has the form y = mx + b, where m is the slope, b is the intercept, and y is the fitted price at bar x. The slope is the sum of (bar number minus average bar number) times (close minus average close), divided by the sum of (bar number minus average bar number) squared. The bands sit a chosen number of standard deviations of the residuals away from the line, where a residual is simply the gap between the actual close and the fitted line on the same bar.
| Piece | What it is | Toy example, five closes |
|---|---|---|
| Closes | The last N closing prices | 1.0800, 1.0820, 1.0840, 1.0860, 1.0880 |
| Average close | The mean of those closes | 1.0840 |
| Slope (m) | Average rise per bar | Plus 20 pips per bar |
| Fitted line | y = mx + b through the window | Rises 20 pips a bar through 1.0840 |
| Residual | Actual close minus fitted price | Zero on every bar here, a perfect fit |
| Bands | Fitted line plus and minus 2 standard deviations | With real noise, about 40 pips each side on hourly EURUSD |
| R-squared | How much of price movement the line explains | 1.00 in this toy case, 0.70-plus is strong in real markets |
Two practical consequences fall out of the formula. The line is fitted to the whole window, so one wild bar cannot drag it far, but a window full of chop flattens the slope and widens nothing: the bands stay honest about the noise because they are built from the residuals. And because the line refits on every new bar, the channel repaints by design. That is not a flaw to complain about; it is the reason I never trade a band touch from a screenshot and always confirm the band’s live position before entry.
My funded settings: period, deviation, timeframe
I use the channel on the hourly chart for funded trading, with a 100-period lookback and two standard deviations. The hourly chart is slow enough that a band touch is a decision, not a reflex, and fast enough that a funded day still offers one or two clean setups. The 100-period window covers about four trading days, long enough for a real trend to show and short enough that last week’s regime does not vote on today’s trade. Two deviations gives bands wide enough that price touches them a few times a week rather than every hour.
| Setting | My funded value | Why |
|---|---|---|
| Timeframe | H1 | Band touches are decisions, not reflexes; one or two setups a day |
| Lookback | 100 bars | About four trading days; a real trend, not last week’s regime |
| Deviation | 2 standard deviations | Bands touched a few times a week, not every hour |
| Minimum slope | At least 0.5 pips per bar on EURUSD | Below that the channel is flat and I sit out |
| Minimum R-squared | 0.60 | Below that the line is decoration, not structure |
| Session | London and New York only | Asian-band touches fill too slowly and fake out too often |
Shorter lookbacks, like 50 bars, make the channel twitchy: the slope flips on a single strong session and band touches multiply into overtrading. Longer ones, like 200 bars, make it stubborn: the line keeps pointing up long after the trend has rolled over, and I buy pullbacks into a dead trend. The 100-bar setting is a compromise I arrived at by losing money on both extremes, and I do not retune it per pair. Retuning per pair is how a funded trader curve-fits their way into a rulebook they cannot follow under pressure.
How I read its signals
The channel gives me four situations, and only one of them is an entry. A pullback to the with-trend band in a sloping channel with a strong fit is the entry. Everything else is information or a warning. A touch of the against-trend band is extension, not a reversal signal on its own. A close outside the with-trend band that holds for two hourly closes is the trend breaking, and I stop trading that direction. A flat channel is a no-trade zone however pretty the bands look.
| Situation | Channel state | What I do |
|---|---|---|
| Pullback to the with-trend band | Slope clear, R-squared above 0.60, price touches the lower band in an uptrend | Entry candidate; wait for a confirming hourly close back inside the band |
| Touch of the against-trend band | Price reaches the upper band of a rising channel | No entry; extension, take partials if already long, never chase |
| Close outside the with-trend band | Two hourly closes beyond the lower band in an uptrend | Trend broken; stop trading longs, channel redraws, reassess |
| Flat channel | Slope under 0.5 pips per bar or R-squared under 0.60 | No trades from this tool; switch to a range tool or sit out |
| Band touch during red-folder news | Any channel state, news within 30 minutes | No entry; news breaks bands and my daily limit in the same candle |
The confirmation rule is what separates this from blind band-fading. I do not buy the touch itself; I buy the hourly close back inside the band after the touch. The touch tells me where the buyers might stand. The close back inside tells me they actually stood there. That one-bar wait costs me a few pips of entry and saves me from most of the band slices that used to eat my daily limit, because a band that price closes through twice is not support, it is a door.
The worked trade: a lower-band pullback with full sizing maths
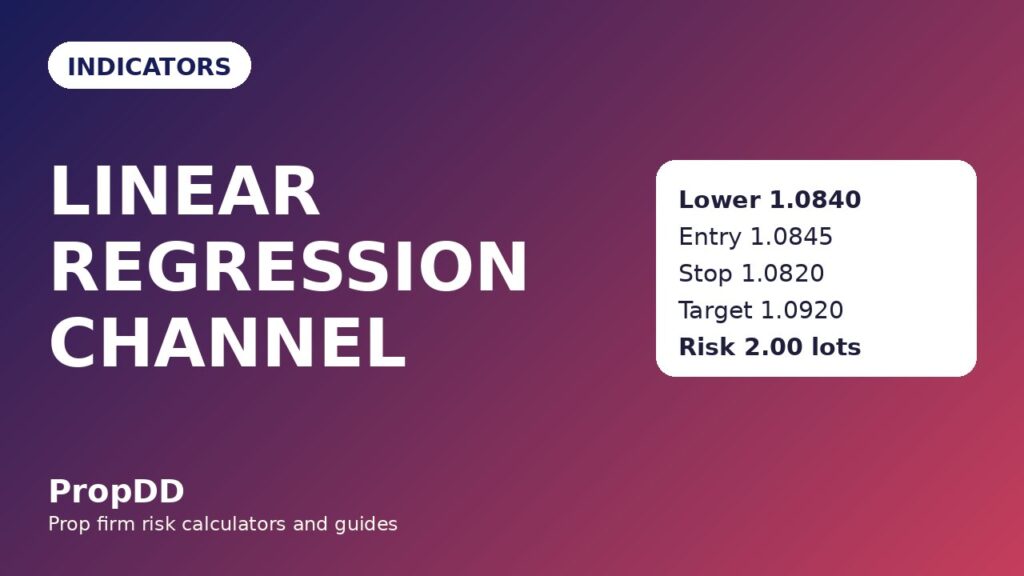
Here is a real-shaped example from a rising hourly EURUSD channel, with the exact numbers I would have used. The 100-bar channel slopes up at 0.8 pips per bar with an R-squared of 0.78. The bands sit 40 pips either side of the median: lower band 1.0840, median 1.0880, upper band 1.0920. Price pulls back, touches 1.0842, and closes the hour back inside at 1.0845. That close is my entry trigger.
| Step | Level | Reasoning |
|---|---|---|
| Entry | Buy at 1.0845 | Hourly close back inside after a lower-band touch |
| Stop loss | 1.0820, 25 pips below entry | Below the lower band, giving the band room to breathe |
| First target | 1.0880, the median, plus 35 pips | Price returns to average drift; bank half the position here |
| Second target | 1.0920, the upper band, plus 75 pips | The full channel ride; remainder runs to extension |
| Risk | 500 dollars, 0.5 percent of a 100,000 account | One tenth of the 5,000 daily loss limit |
| Position size | 500 divided by (25 pips times 10 dollars) = 2.00 lots | Standard EURUSD pip value, 10 dollars per pip per lot |
| First target value | 35 pips times 10 dollars times 2 lots = 700 dollars | 1.4R on the full position |
| Second target value | 75 pips times 10 dollars times 2 lots = 1,500 dollars | 3.0R on the full position |
The stop placement is the whole funded point of this tool. Because the band is a visible line, my stop has a reason to sit where it sits: below the band, not below a round number I liked. If price closes twice below the band, the premise is dead and I am out for 500 dollars, which is 10 percent of my daily limit, not a day-ender. If price runs to the median, I bank half and move the rest to breakeven, which turns the trade into a free ride to the upper band. The sizing grid below is the one I keep beside the chart, so I never do this division under pressure.
| Stop distance | Lots at 500 dollars risk | What it means on the chart |
|---|---|---|
| 20 pips | 2.50 lots | Tight band, calm session; fine, but a wick can take it |
| 25 pips | 2.00 lots | My standard hourly setup, as in the worked trade |
| 30 pips | 1.67 lots | Wider band on a volatile day; size down, do not widen the stop |
| 40 pips | 1.25 lots | Wide channel; half the usual size keeps the same dollars at risk |
| 50 pips | 1.00 lot | Very wide band; if the stop needs 50 pips, the setup is usually not worth it |
Notice what the grid enforces: the dollars at risk never change, only the lots do. A wide band does not mean a bigger risk, and a tight band does not mean a bigger position for fun. That discipline is what keeps a 500 dollar stop a 500 dollar stop when the channel is wide, which is exactly when undisciplined traders blow through their daily limit on one “small” trade.
The twelve-trade test: filtered versus unfiltered
I tested the rules over twelve hourly EURUSD setups, first the way most traders use channels, then with my full filter. Unfiltered meant buying every lower-band touch in any channel, any slope, any fit, any session. Filtered meant slope above 0.5 pips per bar, R-squared above 0.60, London or New York session only, no red-folder news within 30 minutes, and an hourly close back inside the band before entry. Same 500 dollar risk, same median and upper-band targets.
| Trade | Filtered result | Unfiltered result |
|---|---|---|
| 1 | Win, plus 3.0R | Win, plus 1.4R |
| 2 | Win, plus 3.0R | Loss, minus 1.0R |
| 3 | Win, plus 2.0R | Loss, minus 1.0R |
| 4 | Win, plus 2.0R | Win, plus 1.0R |
| 5 | Win, plus 1.4R | Loss, minus 1.0R |
| 6 | Win, plus 1.4R | Win, plus 1.0R |
| 7 | Win, plus 1.0R | Loss, minus 1.0R |
| 8 | Win, plus 1.0R | Loss, minus 1.0R |
| 9 | Loss, minus 1.0R | Loss, minus 1.0R |
| 10 | Loss, minus 1.0R | Loss, minus 1.0R |
| 11 | Loss, minus 1.0R | Win, plus 0.6R |
| 12 | Loss, minus 1.0R | Loss, minus 1.0R |
| Total | 8 wins, 4 losses; winners 14.8R, losers 4.0R, net plus 10.8R = plus 5,400 dollars | 4 wins, 8 losses; winners 4.0R, losers 8.0R, net minus 4.0R = minus 2,000 dollars |
The filtered run’s best single trade was 1,500 dollars, which is 27.8 percent of the 5,400 dollar net, inside the 30 percent consistency cap most funded firms apply to a best day. The unfiltered run lost 2,000 dollars, which is 40 percent of a 5,000 dollar daily limit, across setups that looked identical on a screenshot. The difference was never the indicator. It was the filter: slope, fit, session and confirmation, four checks that took under a minute and removed the eight worst trades from the list. A channel without a filter is a suggestion. A channel with a filter is a plan.
Where the channel fails on a funded account
The channel fails in four places, and all four cost funded traders their daily limit when they ignore them. First, it repaints: the band you bought can move against you on the next bar, which is why I trade the confirming close, not the touch. Second, it lags: after a real reversal, the slope keeps pointing the old way for hours while price walks the other direction, which is why two closes outside the with-trend band end the trade idea. Third, it means nothing in a range: a flat channel’s bands are just the edges of chop, and buying them is buying noise with a stop attached. Fourth, it breaks on news: a red-folder release can jump clean through both bands, and no stop placement inside the channel survives a gap it was never built for.
| Failure | What it looks like | Funded cost if ignored | My fix |
|---|---|---|---|
| Repainting band | Band moves 10 to 20 pips after entry | Stop sits in the wrong place, taken out by normal noise | Enter only on the hourly close back inside |
| Lag after reversal | Slope still up, price falling for hours | Repeated pullback buys into a dead trend | Two closes outside the band ends the direction |
| Flat channel | Slope near zero, price ping-ponging between bands | Whipsaw losses stack toward the daily limit | No trades when slope or R-squared is below my minimum |
| News jump | Price gaps through both bands in one candle | Slippage past the stop, one trade eats the day | No entries within 30 minutes of red-folder news |
The common thread is that every failure is visible before it costs money, if you look for it. The slope tells you the trend is tired. The R-squared tells you the line is fiction. The calendar tells you news is coming. Funded trading is mostly the discipline of reading those warnings and doing nothing, and the channel is useful precisely because it prints its warnings on the chart instead of hiding them in a feeling.
My daily routine with the channel
My routine takes about ten minutes and happens once, before London opens. I check the slope and fit on the hourly EURUSD channel, mark the bands, note the news calendar, and decide whether today is a channel day at all. If it is not, the channel comes off the decision list and I trade something else or nothing. During the session I watch only for the confirmed band touch; I do not redraw the channel intraday to make a setup appear, because redrawing until a setup appears is just drawing the answer I want.
| Time | Step | What I write down |
|---|---|---|
| Before London | Check slope, R-squared and bands on H1 | Slope, R-squared, lower band, median, upper band |
| Before London | Check the news calendar | Red-folder times; no entries within 30 minutes of them |
| Before London | Decide: channel day or not | Yes only if slope and fit pass; otherwise sit out |
| London and New York | Wait for a confirmed band touch | Touch price, confirming close, entry, stop, targets |
| After a trade | Log slope, fit, result and R multiple | One line per trade; review weekly, never mid-session |
| End of day | Check daily loss used against the 5,000 limit | Two 500 dollar losses and I am done for the day |
That last line is the real rule. Two full-stop losses is 1,000 dollars, and on a funded account I stop at two losses whether the channel offers a third setup or not, because the third setup after two losses is almost always revenge dressed as analysis. The channel will be there tomorrow with a fresh window and a fresh slope. The daily limit will not be.
How the channel fits prop firm rules
The channel fits funded rules because it turns the three rules firms actually enforce into visible lines. The daily loss limit becomes a stop placed below a band, sized to 500 dollars, not a hope. The consistency rule is protected by the filter: the test above kept the best day at 27.8 percent of net, inside the usual 30 percent cap, because filtered trades win bigger and lose the same. The no-overtrading expectation is met by the routine itself: one or two confirmed setups a day, sessions filtered, flat days skipped. For the position-sizing maths behind the 500 dollar risk figure, I use the same sizing logic as my trend pullback strategy, and for placing stops behind visible structure rather than round numbers, my Williams fractal article covers the swing-marker version of the same idea. When price sits between the channel bands and the daily pivot levels, I let the pivot decide the intraday bias and the channel decide the trend. And when the channel is flat, I do not force it: my EMA article explains why a flat average is a no-trade signal in any form.
For the generic maths behind the channel itself, the guide at Technical Analysis Pro’s linear regression channel guide lays out the regression line, the deviation bands and the R-squared reading in the same terms I use here. Nothing in this article requires a paid indicator: every charting platform with a regression channel tool already draws exactly this, and the edge is in the filter, not the tool.
Frequently asked questions
Is the linear regression channel a leading or lagging indicator?
Lagging, by construction: it fits a line to past closes and refits on every bar. That is why I use it to judge whether a trend is orderly and where its normal range ends, not to predict tops and bottoms. The confirming close and the two-close invalidation rule exist precisely because the line moves after price does.
What settings should a funded trader start with?
Start with the settings in this article: hourly chart, 100 bars, two standard deviations, minimum slope 0.5 pips per bar on EURUSD, minimum R-squared 0.60. Trade them unchanged for at least twenty setups before retuning anything, because retuning after five trades is fitting the indicator to your last loss, not to the market.
Why do I need R-squared at all?
Because a sloping line through chop looks identical to a sloping line through a trend until you check the fit. R-squared is the only number on the chart that tells you whether the line describes price or decorates it. Below 0.60 I treat the channel as unusable, however clean the slope looks.
Can I trade the channel on lower timeframes?
You can, but the funded maths gets worse: bands get tighter, touches multiply, and a 25 pip stop on the hourly becomes a 10 pip stop on the fifteen-minute chart that normal spread and noise can take out. If you drop timeframes, shrink the risk per trade as well, because the same daily limit now has to survive three times as many decisions.
What do I do when price closes outside the channel?
One close outside is a warning; two hourly closes outside the with-trend band end the trade idea in that direction. Do not average down into the break and do not redraw the channel to hide it. Let the channel refit over the next sessions and reassess when a new slope and fit have formed.
Does the channel work on gold and indices too?
The construction works on any market, but the numbers change: gold’s bands are far wider in dollar terms and indices gap more overnight, so the same pip-based minimum slope does not transfer. Re-derive the slope minimum and the stop grid in the instrument’s own units before trading it, and keep the dollar risk per trade at the same 500.
Risk disclaimer: this article is educational and is not financial advice. Trading carries a risk of loss, and past market behaviour does not guarantee future results. Define your risk before every trade, and never trade a funded account with rules you have not tested on your own numbers first.




2 comments
[…] look close enough to the CFO to cause confusion, so the differences are worth stating plainly. The linear regression channel uses the same regression line, but it draws bands around it and trades price touching the bands. […]
[…] so the tick-volume problem on spot forex CFDs never touches it. And it is not the same thing as the linear regression channel I covered separately — the channel plots bands around a regression line, while this article is about the line itself […]