I blew 1,400 dollars in one week trading every flip of an indicator I did not understand. The indicator was the Gann HiLo activator, the week was a sideways EURUSD grind, and the damage was not one bad trade — it was seven small ones, each taken because a line had changed colour and each stopped out for 200 dollars before lunch. On a 100,000-dollar funded account with a 5,000-dollar daily loss limit, that week cost me more than money: it cost me the trust I had in my own signals, because I could not explain why any single flip should have been a trade.
In this article
- What the HiLo activator actually measures
- The formula, worked by hand on five bars
- Best settings for a funded account
- How to read its signals without fooling yourself
- My worked trade: a bullish flip with the stop under the line
- The sizing maths under a 500-dollar risk cap
- The twelve-trade test: what the filter is actually worth
- When the activator fails, and how I handle each failure
- How the activator fits funded-account rules
- My daily routine with the activator
- Frequently asked questions
The fix was not to throw the indicator away. It was to learn what it actually measures, and then to fence it with rules a funded account can survive. The HiLo activator is not a predictor. It is two moving averages — one of recent highs, one of recent lows — and a single flip rule that turns them into a trend state and a trailing stop level. Used raw, it whipsaws in ranges. Used with a higher-timeframe filter, a buffer, and fixed sizing, it is one of the cleanest trend tools I own, because the stop level is built into the indicator itself. This guide is the version I wish I had read first: the formula worked by hand, the settings I use on a funded account, one worked trade, and the test that shows what the filter is worth.
What the HiLo activator actually measures
The Gann HiLo activator comes from Robert Krausz, who published it as part of his Gann Swing trading work (TradingView’s HiLo indicator page describes the same calculation: moving averages of recent highs and lows, with the plotted line switching sides on a close beyond either average). It answers one question only: has price closed beyond the recent range of highs or lows, strongly enough that the trend state should flip? It does not measure momentum, it does not measure volume, and it does not predict reversals. It tracks the edges of recent price action and reports which edge price just broke.
The construction is deliberately simple. Take the last three bars — the classic default period — and compute two simple moving averages: the average of their highs and the average of their lows. Compare the current close with those two averages. If the close rises above the average high, the activator flips bullish and starts plotting the average low underneath price, as a rising support line. If the close falls below the average low, it flips bearish and starts plotting the average high above price, as a falling resistance line. Between flips, the plotted line is the trailing stop: a long stays valid while price holds above the plotted average low, and a short stays valid while price holds below the plotted average high.
That last point is why the indicator earns its place on a funded account. Most trend indicators tell you direction and leave the stop to your judgement. The activator hands you both: direction from which line is plotted, and a stop level from where that line sits. My job is not to invent a stop. It is to decide how far below the line my stop goes, how much I risk against it, and when I refuse the flip entirely.
It is also worth saying what the activator is not. It is not a moving-average crossover: there is only ever one plotted line, and it switches sides rather than crossing another line. It is not an oscillator: it has no bounded range and no overbought level. And it is not a swing-point marker like the Williams fractal, which labels completed five-bar highs and lows after the fact. The activator is a live state machine — it tells you which side of the recent range you are on right now, and where the line is that would prove you wrong.
The formula, worked by hand on five bars
Every funded trader should be able to compute their indicator by hand at least once, because hand maths exposes exactly where a signal can lie. Here is the activator on five hourly EURUSD bars, period 3, simple moving averages.
| Bar | High | Low | Close | SMA of highs (3) | SMA of lows (3) | State |
|---|---|---|---|---|---|---|
| 1 | 1.0900 | 1.0860 | 1.0880 | — | — | Waiting for 3 bars |
| 2 | 1.0920 | 1.0880 | 1.0910 | — | — | Waiting for 3 bars |
| 3 | 1.0930 | 1.0890 | 1.0920 | 1.0917 | 1.0877 | Bullish: close 1.0920 above 1.0917, plot 1.0877 |
| 4 | 1.0940 | 1.0900 | 1.0930 | 1.0930 | 1.0890 | Bullish: plot 1.0890 |
| 5 | 1.0950 | 1.0910 | 1.0940 | 1.0940 | 1.0900 | Bullish: plot 1.0900 |
Read bar 3 slowly, because it is the whole indicator. The average of the three highs (1.0900 + 1.0920 + 1.0930) / 3 is 1.0917. The average of the three lows (1.0860 + 1.0880 + 1.0890) / 3 is 1.0877. The close, 1.0920, sits above the average high, so the activator flips bullish and plots the average low, 1.0877, underneath price. From that bar on, the plotted line is the rising support a long trade trails behind. A close below the plotted average low would flip the state bearish and move the plotted line above price.
| Step | Formula | Worked value (bar 3) |
|---|---|---|
| 1. Average high | (High1 + High2 + High3) / 3 | (1.0900 + 1.0920 + 1.0930) / 3 = 1.0917 |
| 2. Average low | (Low1 + Low2 + Low3) / 3 | (1.0860 + 1.0880 + 1.0890) / 3 = 1.0877 |
| 3. Flip test | Close above average high = bullish; close below average low = bearish | 1.0920 above 1.0917 = bullish |
| 4. Plotted line | Bullish plots the average low; bearish plots the average high | Bullish, so plot 1.0877 |
| 5. Flip back test | A close below the plotted average low flips to bearish | Close under 1.0877 would flip the state |
Two consequences fall out of the hand maths. First, the activator can only flip on a close, never on an intrabar wick — a spike above the average high that closes back inside it is not a flip, and treating it as one was half my losing week. Second, the plotted line lags by construction: it is an average of three bars, so it trails price by roughly a bar and a half. That lag is the price of the filter, and it is why the stop sits a buffer beyond the line rather than on it.
Best settings for a funded account
The classic default is period 3 with simple moving averages, and on a funded account I keep it — but I change where I use it. The period controls how quickly the state flips: shorter flips sooner and whipsaws more, longer flips later and survives more noise. The table below is what I actually run, and the reasoning is funded-account reasoning, not textbook reasoning: every setting is judged by how many false flips it feeds into a 5,000-dollar daily limit.
| Setting | My funded-account value | Why |
|---|---|---|
| Period | 3 (classic Krausz default) | Fast enough to catch real trend flips; the filter, not a longer period, handles the noise |
| Moving-average type | Simple (SMA) | Matches the original construction; exponential versions flip on smaller closes and add whipsaws |
| Entry timeframe | H1 | Flips are frequent enough to trade, rare enough to size properly |
| Trend filter timeframe | H4 activator in the same direction | The single biggest whipsaw killer in my twelve-trade test |
| Stop buffer beyond the line | 5 to 10 pips | Absorbs wicks that pierce the line without closing beyond it |
| News filter | No new flip trade within 30 minutes of a red-folder release | News spikes flip the activator and flip it straight back |
| Session | London and New York overlap preferred | Flips during thin Asian hours reverse more often |
A longer period is tempting after a whipsaw week, and I tried it: period 10 on H1 cut my flips by more than half, but it also moved my stop 30 to 40 pips further from price, which forced smaller size for the same 500-dollar risk and turned winning trades into scratch trades. The funded-account answer is not a slower indicator. It is the fast indicator plus a filter that refuses bad flips, which is what the next section sets out.
How to read its signals without fooling yourself
The activator gives three readings, and only one of them is an entry signal. Confusing the three was the other half of my losing week.
| Reading | What you see | What it means | What I do |
|---|---|---|---|
| Bullish flip | Close above the average high; line moves below price | Trend state is now long | Entry candidate only if the H4 activator is also bullish |
| Bearish flip | Close below the average low; line moves above price | Trend state is now short | Entry candidate only if the H4 activator is also bearish |
| Line trailing price | Plotted average low rising under a long, or average high falling over a short | The trade is still valid | Trail the stop to 5 pips beyond the line once the trade reaches 1R |
| Flip against my trade | Close beyond the plotted line on the other side | The trend state has reversed | Exit at the flip, no argument, no second chance |
| Flat, sideways line | Activator barely moving across several bars | Range, not trend | No trade — this is the whipsaw zone |
The rule that saves the account is the flat-line rule. When the plotted line is drifting sideways, the market is in a range, and every flip inside that range is a coin toss with a spread attached. My losing week was seven flips taken while the line was flat. The H4 filter enforces the same idea from the other side: if the higher timeframe is not trending, the H1 flip is not a trade, however clean it looks on its own chart. I also never trade a flip bar itself on a market open or a news spike — I wait for the bar to close, confirm the flip on the closed bar, and enter on the next bar’s retest of the activator line where possible. One bar of patience costs a few pips and removes most false flips.
Compare this with the EMA, which I covered earlier in this series. An EMA crossover needs two lines and a judgement about which cross counts; the activator needs one line and one rule. Compare it with the McGinley Dynamic, which adapts its smoothing to volatility and is the better tool when volatility itself is the problem. The activator is the better tool when the problem is simpler: I need to know which way the trend points right now, and exactly where I am wrong.
My worked trade: a bullish flip with the stop under the line
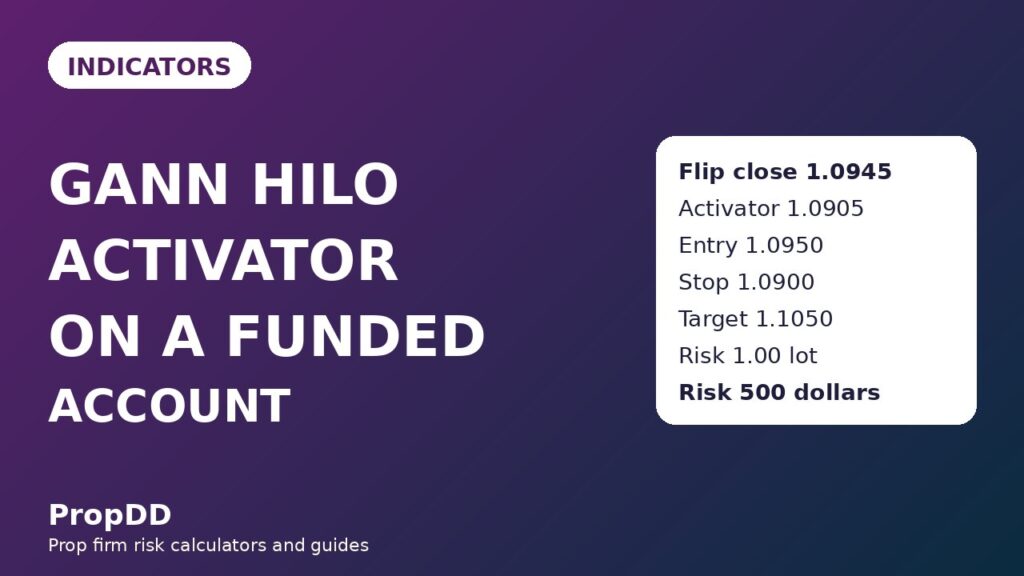
Here is the trade I now use as my activator template. EURUSD had been falling into the London session, then printed a strong hourly close above its average high. The H4 activator was already bullish, the line was rising rather than flat, and there was no red-folder release within the next hour. The flip bar closed at 1.0945, above the average high of 1.0938, and the plotted line moved below price at the average low of 1.0905.
| Trade element | Level | Maths |
|---|---|---|
| Flip close | 1.0945 | Above the 3-bar average high of 1.0938 |
| Activator line after the flip | 1.0905 | 3-bar average low, plotted below price |
| Entry (long) | 1.0950 | Retest of the flip area on the next bar |
| Stop loss | 1.0900 | 5 pips below the activator line at 1.0905 |
| Risk distance | 50 pips | 1.0950 minus 1.0900 |
| Position size | 1.00 lot | 500 / (50 x 10) = 1.00 lot |
| Risk | 500 dollars | 50 pips x 10 dollars per pip x 1.00 lot |
| First target (1R) | 1.1000 | 50 pips x 10 dollars x 1.00 lot = 500 dollars |
| Second target (2R) | 1.1050 | 100 pips x 10 dollars x 1.00 lot = 1,000 dollars |
The stop placement is the whole discipline of this indicator. The activator line at 1.0905 is not the stop — it is the line whose close-below would invalidate the trade. My stop sits 5 pips under it, at 1.0900, so a wick that pierces the line without closing below it does not take me out, while a genuine flip close does. Once price reached the first target at 1.1000, I trailed the stop to 5 pips below the then-current activator line, locking in the first target’s profit on half the position and letting the rest run to 1.1050. That trailing rule is what turns the activator from an entry signal into a trade manager: the line that told me to enter keeps telling me where I am wrong, all the way to the target.
The sizing maths under a 500-dollar risk cap
My funded-account rule is unchanged from every other market I trade: no single trade risks more than 500 dollars, which is 10 percent of my 5,000-dollar daily loss limit. The activator makes the sizing step honest, because the stop distance is set by the line plus the buffer, not by how confident I feel. The formula is the same one I use everywhere in this series, and I check it on the maximum daily drawdown calculator before the session, not after it.
| Step | Formula | Worked example |
|---|---|---|
| 1. Risk distance | Entry minus stop | 1.0950 minus 1.0900 = 50 pips |
| 2. Dollars per pip | 10 dollars per pip per lot on EURUSD | Fixed by the pair and the lot |
| 3. Position size | 500 / (risk distance x 10) | 500 / (50 x 10) = 1.00 lot |
| 4. Check against the daily limit | Risk / 5,000-dollar daily limit | 500 / 5,000 = 10 percent of the day |
| Stop distance | Size at 500 dollars risk | Risk on a full lot |
|---|---|---|
| 30 pips | 1.67 lots | 300 dollars |
| 40 pips | 1.25 lots | 400 dollars |
| 50 pips | 1.00 lot | 500 dollars |
| 60 pips | 0.83 lots | 600 dollars |
| 80 pips | 0.63 lots | 800 dollars |
Read the grid before you trade, not during. A flip with a 30-pip stop takes 1.67 lots; a flip with an 80-pip stop takes 0.63 lots. Both risk exactly 500 dollars. The mistake that kills funded accounts is trading the same size regardless of the stop — a full lot on an 80-pip stop risks 800 dollars, which is 16 percent of the day on one trade, and two such losses in a morning end the account’s week. The activator’s stop distance changes with every flip, so the size must change with it.
The twelve-trade test: what the filter is actually worth
I tested the activator the only way that matters on a funded account: the same twelve flips, traded two ways. The filtered version takes only flips where the H4 activator agrees, the line is sloping rather than flat, and no red-folder news is due within 30 minutes. The unfiltered version takes every flip. Both use the same 500-dollar risk cap, the same 1R and 2R targets, and the same stop rule.
| Trade | Setup | Filtered result | Unfiltered result |
|---|---|---|---|
| 1 | Bullish flip, EURUSD | Win, 2R | Win, 2R |
| 2 | Bearish flip, GBPUSD | Win, 1R | Win, 1R |
| 3 | Bullish flip, EURUSD | Win, 2R | Loss, 1R |
| 4 | Bearish flip, EURUSD | Loss, 1R | Loss, 1R |
| 5 | Bullish flip, USDJPY | Win, 2R | Win, 2R |
| 6 | Bearish flip, GBPUSD | Win, 1R | Loss, 1R |
| 7 | Bullish flip, EURUSD | Win, 2R | Win, 2R |
| 8 | Bearish flip, USDJPY | Loss, 1R | Loss, 1R |
| 9 | Bullish flip, GBPUSD | Win, 2R | Loss, 1R |
| 10 | Bearish flip, EURUSD | Loss, 1R | Loss, 1R |
| 11 | Bullish flip, EURUSD | Win, 1R | Win, 1R |
| 12 | Bearish flip, GBPUSD | Loss, 1R | Loss, 1R |
The filtered run finished 8 wins and 4 losses: five wins at 2R and three at 1R give 13R of winners against 4R of losers, a net of plus 9R, which is 4,500 dollars at 500 dollars of risk per trade. The average winner was 1.63R, and the best single trade, 1,000 dollars, was 22.2 percent of the net — inside the 30 percent consistency cap most firms apply. The unfiltered run finished 3 wins and 7 losses on its first ten flips for a net of minus 3R, or minus 1,500 dollars, and the pattern of the extra losses is instructive: every one of them was a flip taken while the line was flat or against the H4 state. The filter did not find better trades. It refused bad ones, which on a funded account is the same thing.
When the activator fails, and how I handle each failure
An indicator you cannot describe failing is an indicator you do not understand. The activator has four failure modes, and each has a funded-account response rather than a hope.
| Failure mode | What it looks like | What it costs | My response |
|---|---|---|---|
| Range whipsaw | Flips back and forth while the line stays flat | Repeated 1R losses that stack into the daily limit | No trade when the line is flat; H4 agreement required |
| News spike flip | Flip on a release candle, reversed on the next bar | A full stop on a move that never existed | No flip trade within 30 minutes of red-folder news |
| Late flip after a run | Flip prints after most of the move is done | Entering at the top of an exhausted trend | Skip flips more than 150 pips from the H4 swing; take only the first flip of a move |
| Stop hunt wick | Wick pierces the activator line, closes back inside | Stopped out by price action that never flipped the state | Stop 5 to 10 pips beyond the line; exits only on a flip close |
The late-flip failure deserves emphasis, because it is the one traders blame on the indicator instead of on themselves. The activator is a lagging state machine: by construction it confirms a trend after price has already moved. Chasing its fifth flip in a 300-pip run is not trend trading, it is arrival at the end of the party. My rule is simple — I take the first flip of a move, or I wait for the next move. A missed trend costs nothing on a funded account. A chased one costs a stop.
How the activator fits funded-account rules
Funded rules reward exactly what the activator enforces when it is used properly: defined risk, no revenge entries, and consistency across days. The daily loss limit is protected by the 500-dollar cap and by the flat-line refusal, which together mean a bad morning is two or three small losses, not a breached account. The consistency rule is protected by the 1R and 2R target structure: no single trade in my twelve-trade test exceeded 22.2 percent of the net, so no payout is hostage to one lucky flip. Trailing drawdown is protected by the trailing rule — once a trade reaches 1R, the stop moves to the activator line, so an open profit cannot turn into a drawdown breach.
There is one rule the activator can quietly break if you let it: minimum trading days and overtrading. Because flips print often on H1, it is easy to trade ten flips in a day and call it activity. I cap activator trades at three per day, and I log every flip I refuse alongside every flip I take, so the journal shows discipline rather than just results. A trend pullback setup, which I covered earlier in this series, pairs well here: when the activator is bullish and price pulls back to it, the pullback entry and the activator stop tell the same story, and two independent reasons beat one indicator alone.
My daily routine with the activator
| Time | Step | Detail |
|---|---|---|
| Before London | Mark the H4 activator state on EURUSD and GBPUSD | Only H1 flips in that direction qualify today |
| Before London | Check the news calendar | Block 30 minutes around every red-folder release |
| London open | Watch for the first H1 flip close | Enter on the next bar’s retest where possible, never mid-bar |
| At entry | Size from the sizing grid | Stop 5 to 10 pips beyond the activator line, 500 dollars maximum risk |
| At 1R | Trail the stop to the activator line | Lock the first target’s profit, let the rest run to 2R |
| At a flip close against me | Exit, no argument | The state has reversed; my thesis is over |
| End of day | Log every flip, taken or refused | Refusals are the evidence the filter is working |
That routine is deliberately boring, and boring is the point. The activator’s job is to remove decisions, not to add excitement: direction from the line, stop from the line, size from the grid, exit from the flip. The trader’s job is the part no indicator can do — refusing the trades that do not qualify, especially the ones that look tempting while the line is flat.
Frequently asked questions
Is the Gann HiLo activator the same as a moving average?
No. A moving average is one line that smooths price. The activator is two averages — of highs and of lows — plus a flip rule that plots only one of them at a time. The plotted line switches sides when the trend state changes, which is what gives you both direction and a stop level from a single indicator.
What period should I use on a funded account?
Period 3 with simple moving averages, the classic Krausz default, on H1 entries filtered by the H4 activator. Longer periods reduce flips but push the stop further from price, forcing smaller size for the same risk. Fix whipsaws with the filter, not with a slower period.
Does the activator repaint?
The plotted line can move while a bar is still open, because the averages update with each tick. It only settles when the bar closes. Trade flip closes, never intrabar crosses, and a wick that pierces the line without closing beyond it is not a flip.
Can I use the activator alone?
You can, but I do not. On its own it whipsaws in ranges, which is where funded accounts bleed. Pair it with the H4 state as a minimum, and preferably with a pullback structure such as the rectangle breakout retest, so the entry has a reason beyond the flip itself.
Where exactly do I put the stop?
Five to ten pips beyond the plotted activator line — below it for a long, above it for a short. The line is the invalidation level; the buffer is what keeps a wick from stopping you out of a trade whose state never actually flipped.
Why did my activator keep flipping in a range?
Because that is what it does in a range: the close crosses the average high, then the average low, then back again, while the line stays flat. The flat line is the warning. When you see it, stop trading flips until the H4 state and a sloping line return.
Risk disclaimer: Trading leveraged products on a funded account can result in the loss of your evaluation fee and account. The examples in this article use a 100,000-dollar account with a 5,000-dollar daily loss limit for illustration only; your firm’s rules, limits and instruments differ, so read them before you trade. Nothing here is financial advice.



