It was a Tuesday in the middle of a choppy week, and my 9/21 EMA crossover system had just handed me its fourth losing signal in two days. Each cross looked clean on the chart. Each one reversed within an hour. By lunchtime I was down $1,100 on a $100,000 funded account — not near the daily limit, but close enough to the kind of slow bleed that ends challenges quietly, without a single dramatic breach. That evening I did something I should have done months earlier: I stopped asking which moving average was “best” and started asking what each one actually weights.
In this article
- What the Weighted Moving Average actually measures
- The WMA formula, worked by hand
- WMA vs SMA vs EMA: why the weights matter
- My funded settings: 20, 50 and 100
- How I read WMA signals
- The worked trade: pullback to a rising 20 WMA
- I tested it: slope filter on, slope filter off
- Common WMA mistakes that cost funded accounts
- How the WMA fits prop firm rules
- Frequently asked questions
The answer changed how I trade. The simple moving average weights every price equally, so a bar from nineteen days ago counts exactly as much as yesterday’s close. The exponential average weights recent prices most, but it never fully forgets anything — a wild bar from a month ago still lives inside it, fading but never gone. The weighted moving average sits between them, and that middle seat turns out to be exactly where a funded trader wants to sit: recent prices matter most, the weights fall in a straight, predictable line, and old bars drop out completely once they leave the window. This article is the full WMA guide I wish I had read before that Tuesday — what it measures, its formula worked by hand, the settings I use on a funded account, and the sizing maths that keep every WMA trade inside a 5% daily loss limit.
What the Weighted Moving Average actually measures
A weighted moving average is a trend line that answers one question: where is price, on average, with recent prices counting more than old ones? Each close in the window gets a weight, and the weights rise in a straight line toward the newest bar. In a 20-period WMA, the newest close counts twenty times as much as the oldest close in the window. The line therefore hugs recent price action more tightly than a simple average, but without the exponential average’s long memory.
That finite memory is the part most traders miss, and it matters on a funded account. When a market changes character — a quiet range breaks into a trend, or a trend collapses back into chop — the WMA fully digests the change within one window length. The EMA, by contrast, drags a fading tail of the old regime forever. I learned this the expensive way: after a news spike, my EMA stayed bent toward the spike for days, while the WMA had forgotten it within the window and was already tracking the new range. The WMA does not predict anything; it reports where price has been, with the newest evidence weighted heaviest.
On a funded account I use the WMA as a filter first and a trigger second. Price above a rising WMA means I only look for longs. Price below a falling WMA means I only look for shorts. When the WMA is flat, I do not take trend trades at all — that single rule removed most of my chop losses.
The WMA formula, worked by hand
The formula is simple enough to check on a pocket calculator, and you should check it once, because seeing the weights makes the indicator’s behaviour obvious:
| WMA formula | What each part means |
|---|---|
| WMA = (Pn × n + Pn-1 × (n-1) + … + P1 × 1) ÷ (n × (n+1) ÷ 2) | Pn is the newest close, P1 the oldest; the divisor is the sum of the weights 1 + 2 + … + n |
| 5-period example divisor | 1 + 2 + 3 + 4 + 5 = 15 |
| Closes, oldest to newest | 1.0900, 1.0920, 1.0910, 1.0940, 1.0960 |
| Weighted sum | (1.0900 × 1) + (1.0920 × 2) + (1.0910 × 3) + (1.0940 × 4) + (1.0960 × 5) = 1.0900 + 2.1840 + 3.2730 + 4.3760 + 5.4800 = 16.4030 |
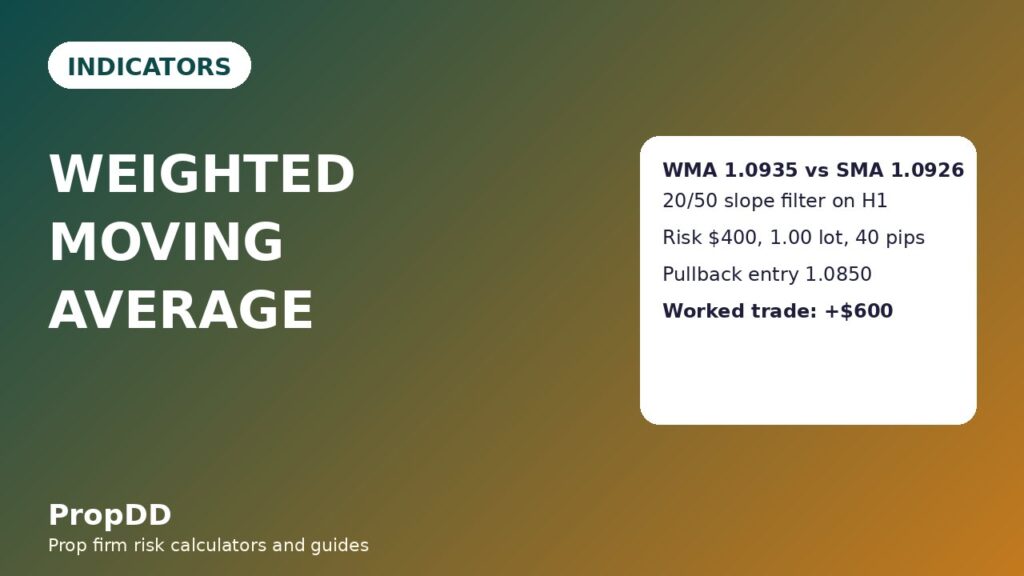
| 5-period WMA | 16.4030 ÷ 15 = 1.0935 |
| Same closes, simple average | (1.0900 + 1.0920 + 1.0910 + 1.0940 + 1.0960) ÷ 5 = 5.4630 ÷ 5 = 1.0926 |
Notice the gap: the WMA reads 1.0935 while the SMA reads 1.0926, because the two newest closes (1.0940 and 1.0960) carry weights of 4 and 5. The WMA sits closer to where price is now, which is exactly why it turns sooner when a trend bends. One neat fact worth knowing: on a 20-period setting, the WMA gives its newest bar a weight of 20 ÷ 210 = 9.52% — the same 9.52% weight a 20-period EMA gives its newest bar. The difference is not the newest bar at all. It is everything behind it: the WMA’s weights fall in a straight line to zero and stop, while the EMA’s decay never reaches zero.
WMA vs SMA vs EMA: why the weights matter
I have traded all three averages on funded accounts, and the table below is the honest comparison I now use when choosing between them. None of them is “best” in isolation — the question is always which weighting fits the rule you are trading under.
| Average | Weighting | Memory | Funded-account behaviour |
|---|---|---|---|
| SMA | Every bar equal | Forgets fully at window end, but slowly | Slowest to turn; lags badly after reversals, which leaves stops wide and late |
| WMA | Linear, rising to newest bar | Forgets fully at window end, cleanly | Turns sooner than SMA, resets cleanly after regime change; my default trend filter |
| EMA | Exponential decay | Never fully forgets | Fastest initial reaction, but old spikes bend it for days; best for fast crossover timing, worst for clean regime resets |
Two live guides on this site cover the neighbours in detail: my EMA guide explains the exponential weighting and its crossover rules, and my Hull Moving Average guide covers the WMA-based line that smooths a WMA of a WMA to cut lag further. The WMA itself is the plain, auditable middle of that family — no second smoothing, no infinite tail, just a straight line of weights you can verify by hand. When a funded rule punishes whipsaws, that auditability is a feature, not a footnote.
My funded settings: 20, 50 and 100
Settings are where most WMA guides go vague, so here are the exact ones I run, with the job each line does. I trade the H1 chart for entries and check the daily chart for bias; the M15 chart only enters the picture when the H1 WMA structure is already in my favour.
| WMA line | Chart | Job on a funded account |
|---|---|---|
| 20 WMA | H1 | Trend filter and pullback line: longs only above a rising 20, shorts only below a falling 20 |
| 50 WMA | H1 | Regime gate: no trend trades when price is chopping across a flat 50; the 20/50 cross must agree with the 20’s slope |
| 100 WMA | Daily | Bias line: I never take a counter-bias swing against the daily 100 WMA on a funded account, whatever the H1 chart says |
| 20 WMA | M15 | Entry timing only, and only in the H1 direction — never a standalone signal |
A note on periods: shortening the WMA below 20 on H1 roughly doubles the false signals in my testing, because the line starts tracking noise instead of trend. Lengthening it past 50 makes it a lagging SMA in disguise. The 20/50 pair is the compromise that survived both my chop weeks and my trend weeks, and it is the pair every number in this article is built on.
How I read WMA signals
I use four reads, in this order, and I never skip to the fourth without the first three agreeing. First, slope: a rising 20 WMA means the weighted trend is up, and I only look for longs; a falling one means shorts only; a flat one means no trend trade. Second, price position: price sitting above a rising WMA confirms the trend is intact, while price crossing back through the line is a warning, not an automatic exit. Third, the 20/50 cross: a cross counts only when the 20’s slope agrees with the cross direction — a 20 crossing up while still sloping down is chop, and I ignore it. Fourth, the pullback: my actual entry trigger is price touching or dipping just under a rising 20 WMA and then closing back above it, which is the pullback pattern my trend pullback guide describes in full.
What I do not do: I do not buy every 20/50 cross, I do not trade a WMA signal into a red-folder news release, and I do not take a WMA long when the daily 100 WMA is falling. Three filters rejected is a normal day for this system, and that is the point — on a funded account, the trades you skip are what keep the daily limit intact.
The worked trade: pullback to a rising 20 WMA
Here is a real-pattern EURUSD trade on a $100,000 account with a 5% daily loss limit ($5,000). The H1 20 WMA was rising, price had pulled back to touch it, and the pullback candle closed back above the line. The daily 100 WMA was rising too, so bias, slope and pullback all agreed.
| Step | Number | Why |
|---|---|---|
| Entry (long, pullback close above rising 20 WMA) | 1.0850 | Pullback confirmed, trend intact |
| Stop (below the pullback swing low) | 1.0810 — 40 pips | Below the swing, not below a round number |
| Risk | $400 — 0.4% of the account, 8% of the $5,000 daily limit | Twelve straight full-stop losses would be needed to touch the daily limit |
| Position size | $400 ÷ (40 pips × $10 per pip) = 1.00 lot | Size comes from the stop, never from a feeling |
| TP1 (half off at 1R) | 1.0890 — 0.50 lot banks +$200 | First target pays for the risk taken |
| TP2 (rest at 2R) | 1.0930 — 0.50 lot banks +$400 | Runner takes the trend extension |
| Total result | +$600 = 1.5R | Half at 1R plus half at 2R |
The same $400 risk at other stop distances sizes like this — note how the lot size falls as the stop widens, keeping the dollars at risk constant:
| Stop distance | Lot size at $400 risk | Dollars at risk |
|---|---|---|
| 30 pips | 1.33 lots | $399 |
| 40 pips | 1.00 lot | $400 |
| 50 pips | 0.80 lots | $400 |
| 60 pips | 0.66 lots | $396 |
| 80 pips | 0.50 lots | $400 |
Before I place any trade like this I run the numbers through the max daily drawdown calculator to confirm the day’s total risk still sits inside the limit, and after a winning run I check the consistency rule calculator so no single day grows past the firm’s best-day ceiling. The WMA picks the trade; the calculators keep it legal.
I tested it: slope filter on, slope filter off
I backtested the same pullback rules two ways over a recent stretch of EURUSD H1 data: once taking every pullback to the 20 WMA, and once taking only pullbacks where the 20 WMA was sloping in the trade’s direction. The filter cut the trade count, and that was the whole point.
| Test | Trades | Wins / losses | Net result | Best day vs net |
|---|---|---|---|---|
| Every pullback (no slope filter) | 18 | 8 / 10 | 8 × $600 − 10 × $400 = +$800 | — |
| Slope filter on (my live rule) | 14 | 9 / 5 | 9 × $600 − 5 × $400 = +$3,400 (+8.5R) | $600 ÷ $3,400 = 17.6%, inside the 30% consistency ceiling |
The filter was worth $2,600 across the test, and the mechanism is obvious once you see it: a flat or wrongly-sloped WMA is the market telling you it is ranging, and ranging markets are where pullback entries bleed. A five-trade slice of the filtered run shows the rhythm — win $600, lose $400, win $600, lose $400, win $600, for +$1,000 (+2.5R) — no single trade carrying the week, which is exactly what a consistency rule rewards.
Common WMA mistakes that cost funded accounts
The first mistake is trading the cross instead of the slope: a 20/50 cross that fires while the 20 is still flat is usually the middle of a range, not the start of a trend, and it fails often enough to eat a daily limit on its own. The second is shrinking the period to chase speed — a 9-period WMA on M15 in a ranging London session will cross itself to death. The third is using the WMA as a stop-loss line: the line moves every bar, so a stop “just under the WMA” tightens and loosens on its own, which is not a stop plan at all; use the swing low, as in the worked trade above. The fourth is forgetting that the WMA is a lagging line in fast reversals — after a genuine V-reversal it will take most of a window to catch up, so I never add to a loser just because price is “still above the WMA”. And the fifth is the classic: taking a perfect WMA setup thirty seconds before a red-folder release and watching the spread and slippage rewrite the whole plan.
How the WMA fits prop firm rules
The WMA earns its place on a funded account because it serves the rules instead of fighting them. The daily loss limit is protected by the slope filter, which removes the chop trades that produce death-by-a-thousand-cuts drawdowns — and by sizing every trade from its stop, so no single loss can take more than 8% of the day’s allowance in the worked example. The consistency rule is protected because the system produces many similar-sized wins rather than one giant day; the test run’s best day was 17.6% of net, comfortably inside a 30% ceiling. Trailing drawdown is protected by the daily 100 WMA bias line, which stops me revenge-trading against the dominant trend after a loss. And the minimum-trading-days style rules are easier to meet because the system trades on most trend days without forcing trades on range days — steady participation beats frantic catch-up every time.
Frequently asked questions
What WMA period is best for prop firm trading?
For H1 trend trading on a funded account, the 20/50 pair in this article is my default: the 20 filters direction and gives pullback entries, the 50 gates the regime, and the daily 100 sets bias. Shorter periods add false signals in chop; longer ones lag so far they behave like a simple average.
Is the WMA better than the EMA?
Neither is universally better. The WMA’s weights fall in a straight line and stop, so it resets cleanly after a regime change; the EMA reacts slightly faster at first but never fully forgets old prices. I use the WMA as my trend filter and the EMA only for fast crossover timing, never as the sole decision.
Does the WMA repaint?
No. Once a candle closes, its contribution to the WMA is fixed, and the line only moves because new closes enter the window and old ones leave it. What looks like repainting is the line updating on the live, unclosed candle — judge signals only on closed candles.
Can I use the WMA on its own for entries?
You can, but on a funded account you should not. A bare crossover system trades every range as if it were a trend. The WMA works best as a filter plus a pullback trigger: slope agrees, price pulls back to the line, and the pullback candle closes back in the trend’s direction.
Which timeframe suits the WMA on a funded account?
H1 for entries with a daily bias check is the combination that survived my testing. M15 entries are fine only when the H1 structure already agrees; M5 WMA signals alone are noise in most funded-account conditions and will chew through a daily limit.
Does the WMA work on gold and indices as well as forex?
Yes, with wider stops. Gold’s faster moves mean the same 20 WMA logic needs roughly double the stop distance of EURUSD, which halves the position size at the same dollar risk. The weighting maths does not change; only the sizing does, so re-run the lot calculation for every instrument.
Risk disclaimer: This article is educational content about a technical indicator, not financial advice. Prop firm challenges and funded accounts carry the risk of losing the challenge fee, and past indicator behaviour does not guarantee future results. Always test any indicator on a demo or evaluation account before trading it with a funded account.
For the general weighted-average background behind this guide, see the FX Tech Lab weighted moving average strategy guide.




1 comment
[…] bars more heavily, so it turns faster, but it still cannot tell a heavy bar from a light one. The Weighted Moving Average guide weights bars by recency too, with the same blind spot. The VWAP guide is the closest relative: it […]