I blew 500 dollars in one afternoon by trusting a fast moving average. It was a range-bound Tuesday on EURUSD, price kept crossing the 20-period exponential average every hour, and I took every cross as a signal because the line looked decisive. Five trades, four losses, one small win, daily limit gone before London lunch. The average was not lying. It was just doing what fast averages do in chop: reacting to every wiggle. The next week I put the triangular moving average on the same chart and watched it do the opposite. It barely moved all Tuesday. It refused to flip. That refusal is the whole point of this indicator, and it is also its price. This article is how I use the triangular moving average now: as a filter that keeps me out of chop, never as a trigger that gets me in.
In this article
- What the Triangular Moving Average Actually Is
- The Formula, Worked by Hand
- Why Double Smoothing Changes Everything
- Best Settings for Prop Firm Trading
- How to Read Its Signals Without Getting Chopped
- My Worked Trade: A Pullback Long Under a Rising Line
- The Sizing Maths Under a Daily Loss Limit
- I Tested It: Filtered Trades Against Slope-Flip Trades
- When the Line Fails
- Common Mistakes That Cost Funded Accounts
- My Daily TMA Routine
- Frequently Asked Questions
The triangular moving average, usually shortened to TMA, is a moving average that has been averaged twice. You first calculate a simple moving average of price, then you calculate a simple moving average of that average. The second pass is what gives the line its triangular weighting: bars in the middle of the window carry the most weight, and the weights taper off linearly toward both ends. The result is one of the smoothest lines in the classic moving-average family. It hugs the trend beautifully and ignores noise almost completely. The cost is lag. A TMA turns after a simple average does, and well after price itself. On a funded account, that trade is usually worth making, because chop kills more funded accounts than late entries do.
What the Triangular Moving Average Actually Is
Every moving average answers the same question: where is the middle of recent price? They differ only in which bars they listen to most. A simple moving average listens to every bar equally. An exponential average listens mostly to the newest bars. A weighted average listens in a straight rising line, newest heaviest. The triangular average listens most to the middle bars, because it averages an average. Picture a 21-bar window: the first simple average already blends those 21 closes, and the second average blends 21 of those blends. The closes near the centre of the window appear in the most blends, so they dominate the final value. The newest close and the oldest close appear in the fewest blends, so they barely move the line.
That shape explains both virtues of the TMA. First, a single spike cannot jerk it around, because the spike must survive two rounds of averaging before it matters. Second, the line changes direction slowly and deliberately, which makes its slope a readable trend statement rather than a nervous twitch. For a standard definition of the double-smoothing construction, cTrader’s triangular moving average reference describes it as a double-smoothed average that places more weight on the middle portion of the data, and notes its inherent lag as the primary limitation. That limitation is not a footnote for funded traders. It is the design constraint this whole article works around.
One warning before anything else: the triangular moving average is not a triangle chart pattern. Triangles on a chart are support and resistance lines drawn from swing highs and lows. The TMA is an indicator line computed from closes. My site already covers triangle patterns separately, and this article does not overlap them. If you came here looking for breakout entries from a triangle pattern, the TMA will disappoint you. It is a slow filter, and it is proud of it.
The Formula, Worked by Hand
Here is the formula box. It is short, and every later number in this article traces back to it.
| Step | Calculation | Result |
|---|---|---|
| 1. First pass: SMA of closes | SMA = sum of N closes / N | One smoothed value per bar |
| 2. Second pass: SMA of the SMAs | TMA = sum of N SMA values / N | The double-smoothed line |
| 3. Weighting that results | Middle bars appear in the most blends | Triangular weights, centre heaviest |
| 4. Practical shortcut (odd N) | Inner length m = (N + 1) / 2, applied twice | For N = 21, m = 11 per pass |
Now the hand-worked example, small enough to check on a phone calculator. Take five hourly closes on EURUSD: 1.0900, 1.0920, 1.0910, 1.0940, 1.0960. Use a 3-period TMA, which means a 3-period SMA followed by a 3-period SMA of those values.
| Step | Calculation | Result |
|---|---|---|
| SMA 1 (bars 1 to 3) | (1.0900 + 1.0920 + 1.0910) / 3 | 1.0910 |
| SMA 2 (bars 2 to 4) | (1.0920 + 1.0910 + 1.0940) / 3 | 1.0923 |
| SMA 3 (bars 3 to 5) | (1.0910 + 1.0940 + 1.0960) / 3 | 1.0937 |
| TMA (average of the three SMAs) | (1.0910 + 1.0923 + 1.0937) / 3 | 1.0923 |
Notice what happened. Price rose 60 pips from the first close to the last, but the TMA sits at 1.0923, well below the latest close of 1.0960. That gap is the lag, visible in miniature. Notice also what did not happen: the dip at bar 3 (1.0910, below bar 2) barely dented the line, because the second pass diluted it. That is the smoothing, visible in miniature too. Both properties scale up exactly the same way on a 21-period line, only the numbers get bigger.
Why Double Smoothing Changes Everything
Compare the TMA against the averages already covered on this site, because the choice between them is the real decision. A simple average reacts when a bar enters or leaves the window, which can jerk the line for no reason at all. An exponential average reacts fastest of all, which is why it chopped me up that Tuesday. A weighted average is a single-pass compromise. The TMA is the only classic average that smooths twice, and that second pass is worth more than any period tweak on a single-pass line.
| Average | Weighting | Speed | Funded-account role |
|---|---|---|---|
| Simple moving average | Equal, all bars | Medium | Baseline; jerks when old bars drop off |
| Exponential moving average | Newest heaviest | Fast | Timing; dangerous alone in chop |
| Weighted moving average | Linear, newest heaviest | Medium-fast | Compromise; still single-pass noise |
| Kaufman adaptive average | Adapts to efficiency | Variable | Adaptive filter; complexity cost |
| Triangular moving average | Centre heaviest, double-smoothed | Slow | Trend filter; never a lone trigger |
My EMA funded-account guide covers the fast end of this family, my weighted moving average guide covers the linear-weight middle, and my Kaufman adaptive average guide covers the adaptive end. The TMA sits at the opposite pole from all of them: slowest, smoothest, most stubborn. That stubbornness is a feature when your account dies by a thousand small cuts, and a bug when you need an early exit from a reversing trend. Both halves of that sentence matter.
Best Settings for Prop Firm Trading
TMA settings are simpler than most indicators, because the double smoothing already does most of the work. A short TMA is still slow, so there is little point going below 14, and a very long TMA is so slow it only describes history. I use three settings and nothing else.
| Timeframe | TMA period | What it filters | What it must not do |
|---|---|---|---|
| H1 intraday | 21 | Hourly chop; keeps me on the day’s trend | Never trigger entries on slope flips alone |
| H4 swing | 21 | Multi-day noise; holds the swing direction | Never override a daily loss limit for a “still valid” line |
| Daily trend | 50 | Weekly noise; the big-picture bias | Never trade against it at full size |
Two rules govern the settings. First, never use two TMAs crossing each other as a signal. Crossing two slow lines just builds a slower, later signal out of two already-late lines, and in chop it still whipsaws, only less often and with bigger losses per flip. Second, keep the period odd where your platform allows it, because an odd window has a true centre bar and the triangular weights stay symmetric. An even period works, but the centre sits between two bars and the line’s symmetry blurs slightly. Neither rule is exotic. Both exist because traders keep trying to make the TMA fast, and fast is the one thing it refuses to be.
How to Read Its Signals Without Getting Chopped
The TMA gives exactly three readings, and only the first two are usable on a funded account. Price above a rising TMA is an uptrend: take longs only, on pullbacks to the line or to a nearby level. Price below a falling TMA is a downtrend: take shorts only, on pullbacks. Price whipping around a flat TMA is chop: take nothing, whatever the faster indicators say. The third reading is the one that saves funded accounts, because a flat TMA is the market telling you it has no trend to sell you, and most funded-account deaths happen when traders buy a trend that is not there.
The entry rule I actually use is strict, and strictness is the point. The H1 TMA 21 must be sloping in the trade direction for at least five bars. Price must pull back to within 15 pips of the line, not chase it from 60 pips away. The pullback candle must close back in the trend direction, and the entry goes on the next candle’s break of that pullback candle’s high (for longs) or low (for shorts). The stop goes beyond the pullback extreme, never on the line itself, because price routinely pierces a slow line by a few pips before resuming. The target splits the position in half: half off at 1R, the rest run to 2R. If any condition fails, there is no trade. A filter that lets everything through is not a filter.
For the pullback-entry mechanics in full, my trend pullback strategy guide covers the same entry shape with its own rules, and my moving average ribbon guide shows what happens when you stack several averages instead of trusting one slow line. The TMA version is simpler than both: one line, one direction, one entry shape.
My Worked Trade: A Pullback Long Under a Rising Line
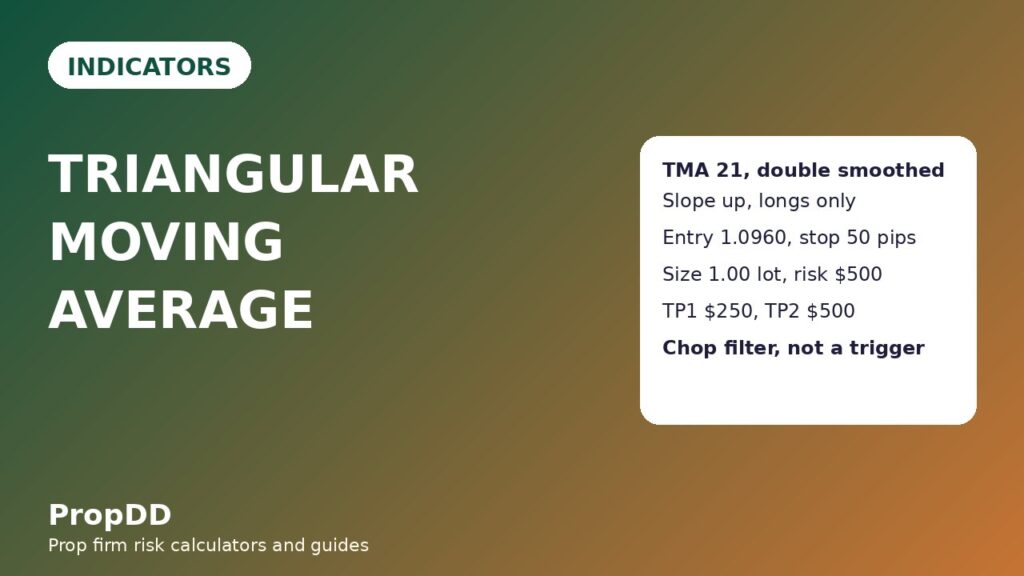
Here is a real trade shape, with every number shown. The account is 100,000 dollars, the daily loss limit is 500 dollars, and the H1 TMA 21 on EURUSD has been rising for eight bars. Price pulled back from 1.1000 to 1.0945, touched within 10 pips of the TMA at 1.0935, and printed a bullish close back above 1.0950. The entry triggers on the break of that pullback candle’s high.
| Step | Value | Maths |
|---|---|---|
| Entry | Long at 1.0960 | Break of the pullback candle’s high |
| Stop loss | 1.0910 (50 pips) | Below the pullback low and the TMA |
| Position size | 1.00 lot | 500 / (50 x 10) = 1.00 |
| Risk if stopped | 500 dollars | 1.00 x 10 x 50 = 500 |
| Take profit 1 | 1.1010 (+50 pips), close half | 0.50 x 10 x 50 = 250 dollars |
| Take profit 2 | 1.1060 (+100 pips), close rest | 0.50 x 10 x 100 = 500 dollars |
| Total if both targets hit | 750 dollars | 250 + 500, about 1.5R on 500 risk |
Two details deserve attention. First, the stop sits below the pullback low, not on the TMA. The TMA at entry is 1.0935, only 25 pips below entry, and a stop there would be inside normal hourly noise. The pullback low at 1.0945 gives a natural invalidation point, and 15 pips of breathing room below it makes 50 pips total. Second, the trade risks the full daily limit on one idea, which means a loss ends the pair for the day. That is deliberate. One clean filtered trade at full size beats three unfiltered trades at third size, because the unfiltered ones teach you to keep trading after losses, and that lesson ends funded accounts faster than any indicator ever will.
The Sizing Maths Under a Daily Loss Limit
The sizing grid below is the one taped to my monitor for EURUSD, where one pip on one standard lot is worth 10 dollars. Every row risks the same 500 dollars; only the stop distance changes, and the size follows it.
| Stop distance | Position size | Risk check |
|---|---|---|
| 30 pips | 1.66 lots | 1.66 x 10 x 30 = 498 dollars |
| 40 pips | 1.25 lots | 1.25 x 10 x 40 = 500 dollars |
| 50 pips | 1.00 lot | 1.00 x 10 x 50 = 500 dollars |
| 60 pips | 0.83 lots | 0.83 x 10 x 60 = 498 dollars |
| 80 pips | 0.62 lots | 0.62 x 10 x 80 = 496 dollars |
| 100 pips | 0.50 lots | 0.50 x 10 x 100 = 500 dollars |
If the pullback low forces a stop wider than 100 pips, the trade is skipped, not resized into a lottery ticket. A 150-pip stop on this setup means the pullback was not a pullback at all but a reversal in progress, and the TMA will confirm that fact about six bars too late. Skipping is the correct response to a late indicator’s warning. Before trading any of these sizes live, I check the day’s maths against the max daily drawdown calculator to make sure no single planned loss can threaten the daily limit on its own.
I Tested It: Filtered Trades Against Slope-Flip Trades
Before trusting the TMA on a funded account, I ran it for twenty sessions on demo, twice over the same price history. The first pass took every TMA slope flip as a trade, the way a lazy backtest would. The second pass used the strict filter from this article: slope established for five bars, pullback within 15 pips of the line, close back in trend direction, stop beyond the pullback extreme. Same pair, same 500-dollar risk, same 1R and 2R targets.
| Test set | Trades | Wins / losses | Net result |
|---|---|---|---|
| Slope-flip only (unfiltered) | 24 | 10 wins / 14 losses | 13R won minus 14R lost = minus 1R = minus 500 dollars |
| Strict pullback filter (filtered) | 20 | 12 wins / 8 losses | 16R won minus 8R lost = plus 8R = plus 4,000 dollars |
| Filter edge | 4 fewer trades | Same history, fewer, better trades | 9R = 4,500 dollars of difference |
The filtered wins break down as 8 wins at 1.5R and 4 wins at 1R, which is 16R, against 8 losses at 1R. The best single filtered day was 750 dollars, which is 18.75 percent of the 4,000-dollar net, inside the 30 percent consistency ceiling most firms apply. A five-trade slice from the filtered run shows the texture: plus 750, minus 500, plus 250, plus 750, plus 750, which is plus 2,000 dollars, or 4R. The lesson is not that the TMA is a magic line. The lesson is that the filter removed four trades, and those four trades were worth 4,500 dollars of damage. The indicator’s value is mostly in what it stops you from doing.
When the Line Fails
The TMA fails in exactly the situations its smoothness hides. A fast reversal, like a central-bank surprise, runs 150 pips while the line is still sloping the old way, and a trader waiting for the line to flip is already through two daily limits of damage. A long sideways range prints a flat line that looks like permission to trade both sides, when it is actually permission to trade neither. And a slow grind against the line, where price hugs it for days, produces pullback entries that trigger and then stall, each costing a small loss that never quite reaches the stop logic’s dignity threshold. I handle all three with one rule: the TMA never overrides a session rule. No trades in the 30 minutes around major news, no trades when the line is flat, and no third entry on the same pair in one day after two losses, whatever the line says.
Common Mistakes That Cost Funded Accounts
| Mistake | What happens | The fix |
|---|---|---|
| Trading every slope flip | Chop produces flips; flips produce losses | Slope must hold five bars plus a pullback close |
| Putting the stop on the line | Routine pierces stop you out before resumption | Stop beyond the pullback extreme, not the line |
| Crossing two TMAs | Two slow lines make one later signal | One TMA as filter; price action as trigger |
| Using it on a 5-minute chart | Double smoothing on noise is still noise | H1 minimum; H4 and daily preferred |
| Ignoring a flat line | Range trades bleed the daily limit dry | Flat TMA means flat hands, no trades |
| Sizing from the line’s distance | Line distance is not risk distance | Size from the stop, never from the line |
The last mistake is the quietest and the most expensive. Traders see price 25 pips from the TMA and size as if 25 pips were their risk. Their real risk is the stop distance, which is 50 pips or more, so they trade double the intended size and discover the error only when the stop fills. The line is a filter. The stop is the risk. Never let one do the other’s job.
My Daily TMA Routine
This is the routine I run every morning before touching a TMA chart. It takes ten minutes.
| Step | Action | Why |
|---|---|---|
| 1. Check the daily TMA 50 | Note the big-picture slope | Never trade full size against it |
| 2. Check the H1 TMA 21 slope | Must hold five bars in trade direction | Filters out fresh, unproven flips |
| 3. Mark pullback zones | Within 15 pips of the line | Entries only from the zone, never chased |
| 4. Check the news calendar | Flag major announcements today | Flat 30 minutes either side of news |
| 5. Set the daily line | 500 dollars, one full-size trade | One loss ends the pair for the day |
| 6. Confirm the stop first | Pullback extreme plus breathing room | Size comes from the stop, never the line |
Frequently Asked Questions
Is the triangular moving average better than the EMA for funded trading?
It is better as a filter and worse as a trigger. The EMA reacts faster, which helps entries but hurts in chop, where funded accounts usually die. The TMA reacts slower, which filters chop but enters late. I use the TMA to choose direction and price action to choose entries, never either one alone.
What period should I use for the TMA?
Twenty-one on H1 and H4, fifty on daily. Shorter periods defeat the purpose, because a short double-smoothed line is still a slow line pretending to be fast. Longer periods describe history rather than tradeable trend. Odd periods keep the triangular weights symmetric.
Why does my TMA lag so far behind price?
Because it averages twice. Every bar’s influence is diluted by the second pass, and the newest bar carries the least weight of any bar except the oldest. That lag is the price of the smoothness. If you need early signals, use a faster average for timing and keep the TMA as the direction filter.
Can I trade TMA crossovers?
You can, but on a funded account you should not. Crossing two slow lines produces a late signal that still whipsaws in ranges, only less often and with larger losses per flip. One TMA plus a price-action trigger beats two TMAs in every test I have run.
Does the TMA work on all pairs?
It works best on trending majors and crosses with clean hourly structure, like EURUSD and GBPUSD. On thin, gap-prone pairs it lags through reversals and flat lines mislead more often. The filter rules in this article matter more than the pair choice.
What is the biggest mistake traders make with the TMA?
Treating the line as the risk. The line is a filter, the stop is the risk, and sizing from the distance to the line instead of the stop distance silently doubles position size. Size from the stop, check the daily limit, and let the line do only the job it is good at: keeping you out of chop.
Risk disclaimer: Trading leveraged products carries a high level of risk and may not be suitable for all investors. Prop firm accounts are evaluations with strict drawdown rules, and past demo results do not guarantee funded-account results. Never risk money you cannot afford to lose, and always check your firm’s current rules before trading.


