On a Tuesday in late October I took three trades before lunch and lost on all three: EURUSD crossed up and fell back within the hour, GBPUSD did the same, and gold ground sideways until a wick took out my stop. Three losses cost $1,500 against a $5,000 daily loss limit, and every cross had looked identical — yet the market had treated them as noise. I was trading the crossover and ignoring the strength behind it, and on a funded account that second question decides whether the day ends in profit or in a breach.
In this article
- What the Directional Movement Index Actually Measures
- The DMI Formula, Worked in Plain Numbers
- Best Settings for Prop Firm Trading
- How to Read DMI: the Bands That Decide Whether I Trade
- My Worked Trade: a 1.50R EURUSD Long on a +DI Cross
- Twelve Trades With the Filter On — and Sixteen Without It
- When DMI Fails, and My Daily Routine
- Frequently Asked Questions
That afternoon I stopped reading the Directional Movement Index as a single line and started reading it as the three-line system it is: +DI for upward pressure, −DI for downward pressure, and the ADX for trend strength. The crossover only matters when the ADX confirms a trend exists at all. I rebuilt my rule around that condition, traded it for twelve sessions, and the filtered run banked $4,250 while the unfiltered version banked $2,250. This article is the full method.
What the Directional Movement Index Actually Measures
The Directional Movement Index, or DMI, measures two things at once: which direction the market is pushing, and how hard it is pushing. Built by J. Welles Wilder Jr. and published in 1978 in New Concepts in Technical Trading Systems, it has three lines: +DI tracks upward movement, −DI tracks downward movement, and the ADX scores trend strength from 0 to 100 without telling you the direction.
A trend indicator that only says “strong” is useless — a strong downtrend is not a buying opportunity — and a direction indicator that only says “up” is useless in a range. DMI answers both questions: +DI above −DI says buyers are in control, and the ADX says whether that control is strong enough to trade. Both must agree before I risk money. The crossover tells me which way to trade; the ADX tells me whether to trade at all.
DMI is not the only trend tool on my chart: my ADX guide reads the same strength score on its own, my EMA guide sets the bigger-picture bias, and the Supertrend flip times my entry. They stack in one order — EMA bias, ADX confirmation, cross direction, Supertrend timing. One caveat: the DMI lags, because it reads the last fourteen bars, and I never let a cross override my stop or my daily loss limit.
The DMI Formula, Worked in Plain Numbers
The formula looks complicated until you work it by hand. Each day you measure three things: +DM, the upward movement; −DM, the downward movement; and TR, the true range. The rules are strict: +DM is today’s high minus yesterday’s high, but only if that move beats the downward move and is above zero — otherwise it is zero. −DM is yesterday’s low minus today’s low, on the same condition. When both moves happen on the same day, only the bigger one counts. TR is the biggest of three numbers: today’s high minus low, today’s high against yesterday’s close, or today’s low against yesterday’s close.
| Day | High / Low / Close | +DM | −DM | TR |
|---|---|---|---|---|
| Fri 16 Oct (base) | 1.0900 / 1.0860 / 1.0880 | — | — | — |
| Mon 19 Oct | 1.0920 / 1.0885 / 1.0910 | 20 | 0 | 40 |
| Tue 20 Oct | 1.0945 / 1.0910 / 1.0938 | 25 | 0 | 35 |
| Wed 21 Oct | 1.0960 / 1.0915 / 1.0940 | 15 | 0 | 45 |
| Thu 22 Oct | 1.0945 / 1.0895 / 1.0905 | 0 | 20 | 50 |
| Fri 23 Oct | 1.0965 / 1.0920 / 1.0955 | 20 | 0 | 60 |
All five days add up to +DM 80, −DM 20 and TR 230, all in pips. The two lines are simple divisions: +DI is 100 times 80 divided by 230, or 34.8, and −DI is 100 times 20 divided by 230, or 8.7. The gap gives the DX: 100 times 26.1 divided by 43.5, or 60.0. The ADX is the Wilder-smoothed average of the DX over fourteen periods, so on a live chart it runs lower than a single hot week — my live ADX on the morning of my worked trade below was 27, not 60. Only the smoothed ADX tells you whether the trend has lasted. For an independent statement of the same three lines, see Pivex’s guide to reading the ADX indicator, which covers +DI and −DI as the direction lines and the ADX as the strength filter, with a prop-firm section on how daily loss limits punish range trading.
Best Settings for Prop Firm Trading
DMI has only four settings that matter: the period is fourteen, Wilder’s default; the threshold is an ADX of 25, because below that the market is ranging and every cross is a trap; and the cross needs a close, not a touch.
| Setting | My value | Why this value | What breaks if you change it |
|---|---|---|---|
| Period | 14 | Wilder’s default | 7: whipsaws; 28: too late |
| ADX trend threshold | 25 or higher | Trend exists | 20: range crosses pass; 30: too few trades |
| ADX no-trade ceiling | Below 20: no trade | No trend — the market is ranging | Trading at 15: crosses fail in chop |
| Cross confirmation | Close of the bar, not a touch | A touch reverses; a close commits | Trading touches: stopped on wicks |
| Session filter | London 08:00–11:00, New York 13:30–16:00 | Trends form when volume is real | Asian session: false crosses |
| Timeframe | H1 for direction, H4 for bias | H1 crosses are tradeable; H4 keeps me honest | M15: too many, too weak |
Two of those rows are the mistakes I made first. The ADX threshold at 25 is a compromise from testing: at 20 the filter never says no, and at 30 it leaves roughly one trade a week on a $100,000 account. At 25 it removes the range crosses — the ADX 18 and 19 readings that failed me — while keeping the genuine ones. The 20 level is my hard floor. The close confirmation is the second mistake: my first week I traded crosses the moment +DI touched above −DI inside a live bar, and twice the bar closed back below the line. A touch is not a signal. I now wait for the hourly close.
How to Read DMI: the Bands That Decide Whether I Trade
Once the settings are fixed, reading DMI is a lookup, not a judgement call. A +DI cross with the ADX above 25 is the only green light for longs, and a −DI cross with the ADX above 25 is the only green light for shorts. A cross either way with the ADX between 20 and 25 means the trend is forming but not confirmed, so I wait. A cross with the ADX below 20 is a hard no, no exceptions: it is the single most common way I used to lose money, because the move looks clean and the flaw is invisible on the price chart. Two more bands complete the read: when +DI and −DI tangle and the ADX is falling, the trend is dying, so I exit runners; and when the ADX runs above 50 the trend is very strong and usually extended, so I bank the first target fast and halve the second. On gold the ADX runs hotter, so I add 5 to every threshold when I trade XAUUSD.
My Worked Trade: a 1.50R EURUSD Long on a +DI Cross
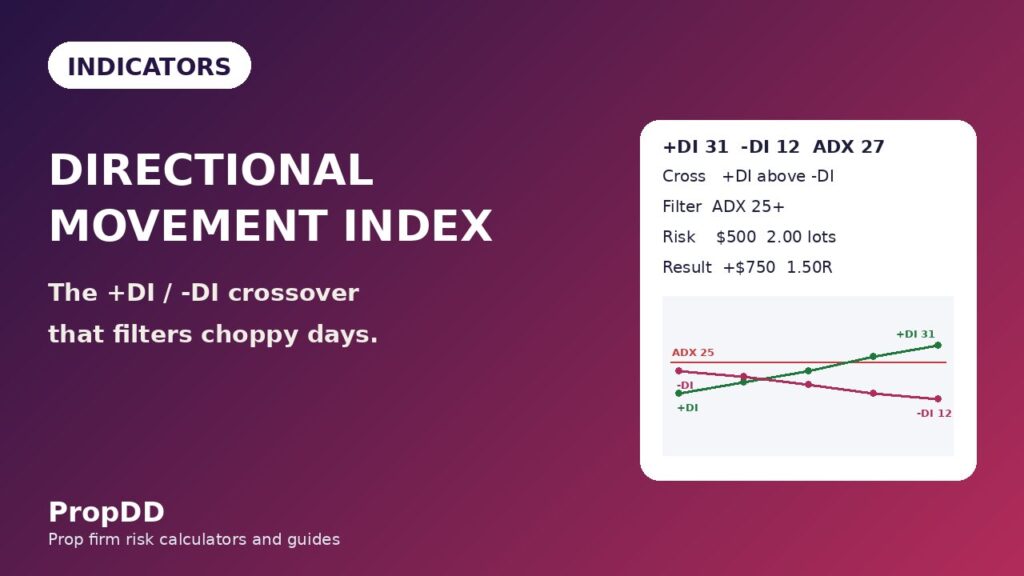
The trade that sold me on DMI happened on Friday 6 November, on EURUSD. At the London open the readings were +DI 31, −DI 12 and ADX 27 — the cross had printed on the 09:00 close and the H4 EMA structure was bullish. The Asian range that night was 1.0985 to 1.1010, twenty-five pips wide.
| Step | Rule applied | My numbers |
|---|---|---|
| 1. DMI read | +DI above −DI, ADX above 25 | +DI 31, −DI 12, ADX 27 — tradeable |
| 2. Bias check | H4 EMA 9 above EMA 21 | Bullish |
| 3. Entry | Buy on the 09:00 close | 1.1010 |
| 4. Stop loss | Below the range low, 25 pips | 1.0985 |
| 5. Risk | 0.5% of a $100,000 account | $500 |
| 6. Position size | Risk / (stop in pips x $10 per pip per lot) | $500 / (25 x $10) = 2.00 lots |
| 7. First target | +25 pips, half off | 1.1035 (+25 pips, 1.00 lot, +$250) |
| 8. Second target | +50 pips, rest off | 1.1060 (+50 pips, 1.00 lot, +$500) |
| 9. Result | Both targets hit by 12:30 | +$750 = 1.50R on $500 risk |
Run the sizing line again, because it is the line that protects the account. My risk budget for one trade is $500, 0.5% of the $100,000 account. The stop is 25 pips below the entry, and one lot of EURUSD is worth $10 per pip, so the size is $500 divided by 25 times $10, which is 2.00 lots. A 50-pip stop would take 1.00 lot for the same $500 of risk; the risk never changes, only the size does. That is the whole of position sizing for prop firm challenges in one division. The same division builds the grid I keep next to my screen: a 15-pip stop takes 3.33 lots, a 30-pip stop takes 1.66 lots ($498 — not 1.67, which would risk $501), a 40-pip stop takes 1.25 lots, and a 60-pip stop takes 0.83 lots. The grid never changes with the ADX.
What made this trade different from the three losers the week before was not the entry or the stop — those were the same rules — it was the 27. The cross had a trend behind it: price reached the first target in ninety minutes and the second before lunch. The entry did not change. The trend did. And on a funded account, the trend is the trade.
Twelve Trades With the Filter On — and Sixteen Without It
The twelve-trade test ran from 20 October to 4 November 2026, on EURUSD, GBPUSD and XAUUSD, in London and New York. The rules were fixed before the first trade: +DI cross confirmed on the hourly close, ADX 25 or higher, 0.5% risk per trade, and the same setup every time — cross with the H4 EMA bias, stop below the range low, targets at one and two times the stop distance. The first table is the twelve trades that passed DMI; the second is what the same sixteen setups would have produced if I had taken every cross regardless of the ADX.
| Date | Pair | +DI / −DI / ADX | Result | Dollars |
|---|---|---|---|---|
| Tue 20 Oct | EURUSD | 28 / 14 / 26 | +1.5R | +$750 |
| Wed 21 Oct | GBPUSD | 31 / 11 / 29 | +2.0R | +$1,000 |
| Thu 22 Oct | EURUSD | 26 / 16 / 27 | -1.0R | -$500 |
| Fri 23 Oct | XAUUSD | 33 / 10 / 31 | +1.5R | +$750 |
| Mon 26 Oct | EURUSD | 27 / 15 / 26 | +1.0R | +$500 |
| Tue 27 Oct | GBPUSD | 29 / 13 / 28 | -1.0R | -$500 |
| Wed 28 Oct | EURUSD | 30 / 12 / 27 | +1.5R | +$750 |
| Thu 29 Oct | XAUUSD | 35 / 9 / 34 | +2.0R | +$1,000 |
| Fri 30 Oct | EURUSD | 26 / 17 / 26 | -1.0R | -$500 |
| Mon 2 Nov | GBPUSD | 32 / 12 / 30 | +1.5R | +$750 |
| Tue 3 Nov | EURUSD | 28 / 14 / 26 | +1.5R | +$750 |
| Wed 4 Nov | GBPUSD | 27 / 15 / 25 | -1.0R | -$500 |
| Version | Trades | Wins / Losses | Net R | Net dollars | Best day vs net |
|---|---|---|---|---|---|
| DMI filter on (ADX 25+ only) | 12 | 8 / 4 | +8.5R | +$4,250 | $1,000 / $4,250 = 23.5% |
| No filter (all 16 setups) | 16 | 8 / 8 | +4.5R | +$2,250 | $1,000 / $2,250 = 44.4% |
| What the filter was worth | 4 fewer trades | 4 fewer losses | +4.0R | +$2,000 | Consistency gate passed vs failed |
Read the last row of the second table carefully, because it is the number that matters for a funded account. The filter did not find better winners — the eight filtered wins are the same eight wins in the unfiltered column. It removed four trades, and all four were losers: the crosses that printed with the ADX at 19, 17, 21 and 18, all in ranging markets. Removing four losers turned $2,250 into $4,250, and it fixed the consistency maths too: on the filtered run my best day was $1,000 out of $4,250 of net profit, or 23.5% — inside the 30% consistency ceiling most firms enforce — while on the unfiltered run the same $1,000 against $2,250 is 44.4%, which would have failed the consistency rule outright. The filter did not just make more money; it made the money withdrawable. My consistency rule guide explains that ceiling in full. I checked the numbers against the max daily drawdown calculator first.
One honest note: twelve trades is a small sample, and I am not claiming DMI wins eight out of twelve forever. What twelve trades can show is the mechanism — range crosses fail, trend crosses follow through — and it is visible in every row: the four trades the filter removed were the four lowest ADX readings, and the four lowest readings were all losers.
When DMI Fails, and My Daily Routine
DMI is a filter, not a guarantee, and it has four failure modes I have met in person. The range cross: +DI crosses with the ADX below 20 and price reverses — the countermeasure is the ADX 25 threshold. The intra-bar cross: +DI touches above −DI mid-bar and closes back below — wait for the hourly close. The strong trend in the wrong direction: a genuine +DI cross below the 50 EMA is a real up-move inside a bigger downtrend — trade only with the H4 EMA bias. My trend pullback guide is what I trade when the DMI and the EMA agree. The dying trend: the ADX falling from 40 while the lines tangle means the trend is over, so bank the runner and stop looking for entries.
DMI is a small part of my day, and it works because it sits inside a routine that protects the account first and looks for trades second. Every morning, in this order: account health — my personal stop is $2,500, half the firm’s $5,000 limit; the H4 EMA bias; the levels, drawn before 08:00; the DMI read — cross plus ADX 25 or higher, confirmed on the hourly close; sizing at $500 risk; a news check; and the journal. My personal daily stop guide sets the limit that ends the day: when it is hit, I close the platform.
Frequently Asked Questions
What is the directional movement index in trading?
Wilder’s three-line system for trend direction and strength: +DI tracks upward pressure, −DI tracks downward pressure, and the ADX scores trend strength from 0 to 100. A +DI cross above −DI says buyers are in control; the ADX says whether that control is strong enough to trade.
What is a good ADX reading for a prop firm trader?
An ADX of 25 or higher means a tradeable trend; below 20 the market is ranging. Between 20 and 25 the trend is forming, so I wait. Above 50 the trend is very strong and usually extended, so I bank the first target fast.
How is DMI different from ADX?
DMI is the whole system and ADX is one line inside it. The +DI and −DI lines give you direction, while the ADX gives you strength. The ADX alone tells you a trend exists but not which way it runs; the DI cross alone tells you the direction but not whether the move is real. You need both.
Does the +DI/−DI crossover work on forex?
Yes, with one condition: the cross only works when the ADX confirms a trend, which is why so many forex traders lose money on it. On EURUSD and GBPUSD hourly bars, a cross confirmed on the close with the ADX above 25 is tradeable; the same cross below 20 is a trap. On gold, raise the threshold by 5.
What DMI settings should a prop firm trader use?
A fourteen-period setting, Wilder’s default, with an ADX threshold of 25 to trade and a hard floor at 20, on the hourly chart for entries and the four-hour chart for bias, in the London and New York sessions. Seven periods fires false crosses; twenty-eight makes the cross arrive after the move is over. Never trade an intra-bar touch — wait for the hourly close.
Can DMI alone tell me when to buy or sell?
No. DMI measures pressure and strength, not a complete trade: a +DI cross still needs a level, a stop, a position size, and a bias from the higher timeframe. It is a filter that decides whether a setup is tradeable, never an entry signal on its own.
Risk disclaimer: This article is educational only and not financial advice. Prop firm accounts are simulated evaluations with strict loss limits; never risk money you cannot afford to lose, and always check your firm’s current rules before trading.


