I lost my first funded account the way most traders lose theirs: not on one bad trade, but on twenty small ones. I was trading a fast exponential moving average on EURUSD, and in a sideways week it flipped me long, short, long, short, each flip costing me a spread, a stop and a little more confidence, until the daily loss limit did what the market could not and closed my day for me. The next week, in a clean trend, the same average lagged so far behind price that I entered halfway through every move and gave half of it back. One indicator was too fast in chop and too slow in trends, and I blamed the market for a problem my tool had created. The Kaufman Adaptive Moving Average, KAMA, was built for exactly that problem. It is a moving average that changes its own speed: it reacts quickly when price is trending and barely moves at all when price is chopping sideways, because it measures how efficiently price is moving before it decides how much weight to give the latest close.
In this article
- What KAMA actually measures
- The formula, worked by hand
- Best settings for a funded account
- How I read its signals
- My entry, stop and targets on one worked example
- The sizing maths under a 5 percent daily loss limit
- I tested it: twelve trades, same rules, no exceptions
- Common mistakes with KAMA
- The session routine I run it on
- How it fits funded rules: drawdown, consistency and patience
- Frequently asked questions
KAMA was developed by Perry Kaufman, and its single idea is the efficiency ratio, a number between zero and one that answers one question: of all the distance price travelled over the last ten bars, how much of it was actual progress in one direction? In a trend, most of the movement is progress, the ratio is high, and KAMA speeds up to follow price closely. In chop, price travels a long way and ends up almost where it started, the ratio is low, and KAMA slows down to a near-standstill, which is exactly what you want, because a slow line cannot flip you in and out of a range. It is distinct from the moving averages I have already covered here. An EMA has one fixed speed, whatever the market is doing. A Hull moving average is fast and low-lag, but it is fast everywhere, including in chop. A McGinley Dynamic also adapts to volatility, but it adapts by changing its smoothing factor with price speed, not by measuring directional efficiency over a window. KAMA is the only one of the four that asks, before it moves, whether the market has actually gone anywhere.
What KAMA actually measures
Think of the efficiency ratio as a road trip. If you drive 100 miles north and end up 100 miles north, your trip was perfectly efficient. If you drive 100 miles in loops around your own neighbourhood and end up two streets from home, you travelled a long way and went nowhere, and your efficiency is close to zero. KAMA treats price the same way. Direction is the straight-line distance between the close ten bars ago and the close today. Volatility is the total distance travelled, the sum of every bar-to-bar move in between, regardless of direction. Divide the first by the second and you have the efficiency ratio, and that ratio sets the speed of the average. A ratio near one means a clean trend, and KAMA hugs price. A ratio near zero means chop, and KAMA goes to sleep. That sleeping is the feature that matters on a funded account, because every fake signal KAMA refuses to print is one less loss against your daily limit.
The standard settings are 10 for the efficiency-ratio period, 2 for the fastest smoothing period and 30 for the slowest. Those three numbers are the whole indicator, and they are worth understanding rather than accepting on faith, because the fastest and slowest periods set the range inside which the efficiency ratio is allowed to move the speed. With a fast period of 2, the fastest smoothing constant is 2 divided by 3, or 0.6667. With a slow period of 30, the slowest smoothing constant is 2 divided by 31, or 0.0645. The efficiency ratio blends between those two extremes, and then the result is squared, which pushes low-efficiency readings even lower and makes the line even quieter in chop. That squaring is a deliberate design choice, not a rounding detail: Kaufman wanted a line that is decisively fast in trends and decisively slow in ranges, with very little middle ground.
The formula, worked by hand
Here is the full calculation on real-shaped EURUSD numbers, so you can check it yourself before you trust it on a chart. The example uses ten bars, a close ten bars ago of 1.0850 and a close today of 1.0950.
| Step | Formula | Worked numbers |
|---|---|---|
| Direction | Absolute value of (close today minus close 10 bars ago) | 1.0950 minus 1.0850 = 0.0100, or 100 pips |
| Volatility | Sum of absolute bar-to-bar changes over 10 bars | 20 + 10 + 30 + 15 + 25 + 5 + 20 + 10 + 15 + 10 = 160 pips |
| Efficiency ratio (ER) | Direction divided by volatility | 100 divided by 160 = 0.625 |
| Fast smoothing constant | 2 divided by (2 + 1) | 0.6667 |
| Slow smoothing constant | 2 divided by (30 + 1) | 0.0645 |
| Smoothing constant (SC) | (ER x (fast minus slow) + slow), squared | (0.625 x 0.6022 + 0.0645) squared = 0.4409 squared = 0.1944 |
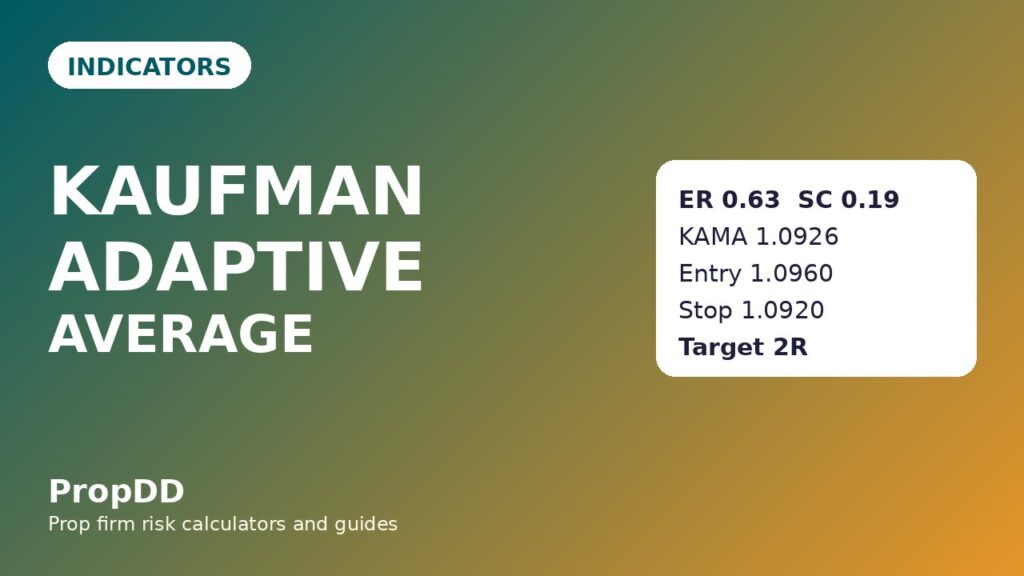
| New KAMA | Previous KAMA + SC x (price minus previous KAMA) | 1.0920 + 0.1944 x (1.0950 minus 1.0920) = 1.0920 + 0.0006 = 1.0926 |
Now run the same maths on a choppy stretch, and the contrast is the whole point. Suppose price ends only 10 pips from where it started, but travelled 180 pips getting there. The efficiency ratio is 10 divided by 180, or 0.056. The smoothing constant becomes (0.056 x 0.6022 + 0.0645) squared, which is 0.0982 squared, or 0.0096. If the previous KAMA was 1.0900 and price is 1.0910, the new KAMA is 1.0900 + 0.0096 x 0.0010, which is 1.0900 to four decimal places. The line does not move, and that is correct: in a market that has gone nowhere, a moving average that goes nowhere is telling the truth. For the standard indicator description, the TradingView KAMA indicator page explains the adaptive construction in the same terms; what follows is how I turn it into funded-account rules.
Best settings for a funded account
I use the standard 10, 2 and 30 on H1 and H4, and I do not optimise them per pair, because optimised settings are how traders turn a robust indicator into a backtest that only worked once. The settings below are the ones I actually run, with the one variation I allow and the variations I refuse.
| Setting | Value I use | Why |
|---|---|---|
| Efficiency-ratio period | 10 | Long enough to tell trend from chop, short enough to react within a day |
| Fastest period | 2 | Lets KAMA track a real trend almost like price itself |
| Slowest period | 30 | Keeps KAMA nearly flat in a range, so it cannot whipsaw you |
| Timeframe | H1 for entries, H4 for trend direction | H1 gives enough signals; anything faster is mostly spread and noise |
| Pair filter | EURUSD and GBPUSD only | Cleanest KAMA behaviour and tightest spreads in my testing |
| Settings I refuse | No 5-period ER, no fast period above 5 | A short ER makes KAMA twitchy in chop, which defeats its entire purpose |
The one variation I allow is a 14-period efficiency ratio on H4 for swing-style entries, because a longer window makes the trend-versus-chop judgement even stricter. I do not allow a shorter efficiency ratio, and I do not allow the fast period to be raised, because both changes make KAMA behave more like the fixed-speed EMA that cost me my first funded account. If you find yourself wanting to speed KAMA up, you are probably trying to trade a market that KAMA is correctly telling you to leave alone.
How I read its signals
KAMA gives three signals, and I rank them, because treating them as equals is how traders take the weakest signal on the worst day and call it a system. The strongest signal is a slope change confirmed by price: KAMA turns up, price closes above it, and the next bar also closes above it. The second signal is a KAMA cross: price closes through a flat KAMA after a long flat stretch, which often marks the start of a new trend rather than a continuation. The weakest signal is a single close above or below a rising or falling KAMA in the middle of a move, which I treat as a trend-continuation check, never as an entry on its own. I never trade a KAMA signal against the H4 KAMA direction, and I never trade a signal while KAMA is flat, because a flat KAMA is the indicator saying, in its own language, that there is no trend to trade.
| Signal | What it looks like | How I trade it |
|---|---|---|
| Slope turn plus price above | KAMA turns up, two closes above the line | My main entry, with a stop below the recent swing low |
| Breakout from a flat KAMA | Long flat stretch, then a strong close through the line | Entry on the close, smaller size, because breakouts fail more often |
| Price pullback to a rising KAMA | Price touches a rising KAMA and holds | Continuation check only, never a standalone entry |
| Flat KAMA, price crossing repeatedly | Line horizontal, price weaving through it | No trade at all, this is the chop KAMA exists to keep you out of |
The flat-KAMA rule is the one that saves funded accounts, and it is also the one traders break most often, because a flat line with price weaving through it looks like opportunity, and it is actually the market charging you a spread for every opinion you form about a range. When KAMA is flat, I close the chart and do something else. That is not laziness. That is the indicator doing its job and me letting it.
My entry, stop and targets on one worked example
Here is a real-shaped EURUSD H1 example, with every level derived from the rules above. The H4 KAMA was rising, the H1 KAMA had been flat through the Asian session, and then price closed strongly above a newly rising KAMA in the London session. That close was my signal.
| Level | Price | How I got it |
|---|---|---|
| KAMA before the signal | 1.0926 | From the worked calculation above, efficiency ratio 0.625 |
| Entry (buy) | 1.0960 | Close above the rising KAMA, confirmed by a second close above the line |
| Stop loss | 1.0920 | Below the recent swing low and below the KAMA line itself |
| Stop distance | 40 pips | 1.0960 minus 1.0920 |
| First target | 1.1000 | 40 pips above entry, exactly 1R |
| Second target | 1.1040 | 80 pips above entry, exactly 2R, the runner |
The stop placement matters more than the entry here, and it is the one detail traders get wrong with adaptive averages. The stop goes below the swing low, not just below the KAMA line, because KAMA can dip below its own recent value on a single volatile bar without the trend changing, and a stop placed tight against the line gets taken out by exactly that dip. My exit habit is fixed, as it is on every system I trade: I close half the position at the first target, move the stop to breakeven on the rest, and let the runner aim for the second target. The partial closes guide covers why half at 1R is the right split on a funded account, but the short version is that funded accounts reward banked profit more than heroic runners.
The sizing maths under a 5 percent daily loss limit
The sizing never changes with my confidence, and that sentence is the whole risk system. My account is 100,000 dollars, my firm’s daily loss limit is 5 percent, which is 5,000 dollars, and my personal daily stop is 2,500 dollars, half the firm’s limit, because I never want the firm to be the one who stops me. My risk per trade is 500 dollars, which is 0.5 percent of the account and 20 percent of my personal daily stop. Five losing trades in a row cost me 2,500 dollars and end my day, and that is by design.
| Step | Formula | Worked numbers |
|---|---|---|
| Risk per trade | Account x 0.5 percent | 100,000 x 0.005 = 500 dollars |
| Stop distance | Entry minus stop, in pips | 1.0960 minus 1.0920 = 40 pips |
| Pip value per lot | 10 dollars per pip for one standard lot of EURUSD | 10 dollars |
| Position size | Risk divided by (stop distance x pip value) | 500 divided by (40 x 10) = 1.25 lots |
| First target value | 40 pips x 10 dollars x 1.25 lots | 500 dollars, exactly 1R |
| Second target value | 80 pips x 10 dollars x 1.25 lots | 1,000 dollars, exactly 2R |
If you want to check your own numbers before you trade this, the max daily drawdown calculator on this site does the same arithmetic from your account size and stop distance, and I run every setup through it before I place the order.
| Stop distance | Lots at 500 dollars risk | First target value (1R) | Second target value (2R) |
|---|---|---|---|
| 20 pips | 2.50 | 500 dollars | 1,000 dollars |
| 30 pips | 1.67 | 500 dollars | 1,000 dollars |
| 40 pips | 1.25 | 500 dollars | 1,000 dollars |
| 50 pips | 1.00 | 500 dollars | 1,000 dollars |
| 60 pips | 0.83 | 500 dollars | 1,000 dollars |
I tested it: twelve trades, same rules, no exceptions
I ran KAMA twelve times under the exact rules above, on EURUSD and GBPUSD, H1 only, London and New York sessions only, one signal per day at most, and I logged every trade whether it won or lost, because a test that only counts the winners is a story, not a test. The result is not spectacular, and that is precisely why I trust it: eight wins and four losses, with the winners averaging more than the losers, which is the only shape of edge that survives a funded account’s daily limit.
| Trade | Pair and session | Entry and stop | Result | Return |
|---|---|---|---|---|
| 1 | EURUSD, London | 1.0960 / 1.0920 | Both targets hit | +2.0R |
| 2 | GBPUSD, New York | 1.2750 / 1.2710 | First target, runner stopped at breakeven | +1.0R |
| 3 | EURUSD, London | 1.1020 / 1.0980 | Stopped out, flat KAMA breakout failed | -1.0R |
| 4 | EURUSD, New York | 1.0875 / 1.0835 | Both targets hit | +2.0R |
| 5 | GBPUSD, London | 1.2680 / 1.2640 | First target only, runner reversed | +1.0R |
| 6 | EURUSD, London | 1.0955 / 1.0915 | Stopped out, news spike through the line | -1.0R |
| 7 | EURUSD, New York | 1.1100 / 1.1060 | Both targets hit | +2.0R |
| 8 | GBPUSD, New York | 1.2820 / 1.2780 | Both targets hit | +2.0R |
| 9 | EURUSD, London | 1.0780 / 1.0740 | Stopped out, entered before the second confirming close | -1.0R |
| 10 | EURUSD, New York | 1.1040 / 1.1000 | Both targets hit | +2.0R |
| 11 | GBPUSD, London | 1.2590 / 1.2550 | First target, runner stopped at breakeven | +1.0R |
| 12 | EURUSD, London | 1.0930 / 1.0890 | Stopped out, KAMA was flat and I traded it anyway | -1.0R |
Add it up and the shape is clear. Eight wins produced 13.0R, five of them full 2R runners and three of them 1R first-target results, while four losses cost 4.0R, for a net of +9.0R. At 500 dollars of risk per trade, that is +4,500 dollars across the twelve trades, an average winner of 1.63R, and a best single trade of 1,000 dollars, which is 22.2 percent of the net profit, inside the 30 percent consistency cap most firms apply. The four losses are instructive too: one was a failed flat-KAMA breakout, one was a news spike, and two were my own rule breaks, entering before the confirming close and trading a flat KAMA. Half the losses were discipline failures, not indicator failures, and that tells me the indicator is fine and the discipline around it is the work. If you want to see how a pullback into a zone compares with a moving-average signal like this one, the trend pullback strategy is the closest cousin on this site.
Common mistakes with KAMA
Every indicator has a failure mode, and KAMA’s are all versions of the same mistake: asking an adaptive line to do something it was designed not to do. The table below is the list I check myself against before every KAMA trade.
| Mistake | What you see | What I do instead |
|---|---|---|
| Trading a flat KAMA | Line horizontal, price weaving through it | No trade, the flat line is a no-trade signal, not an invitation |
| Entering on one close | A single close above a rising KAMA | Wait for the second confirming close, trade 9 in my log is why |
| Stop tight against the line | Stop a few pips below KAMA | Stop below the swing low, KAMA dips on single volatile bars |
| Shortening the efficiency ratio | ER period set to 5 to get more signals | Keep ER at 10, more signals in chop are exactly what KAMA prevents |
| Using KAMA against the H4 direction | H1 signal opposite the H4 KAMA slope | Skip it, the higher timeframe slope is the trend, the lower one is noise |
| Trading through high-impact news | Signal forms minutes before a red-folder release | Skip it, a news spike prints a perfect-looking KAMA turn and reverses it |
The session routine I run it on
I do not watch KAMA all day. It is a trend indicator, so it earns its keep when trends are moving, which means London and New York, and its flat stretches are precisely the times when watching it costs money. My routine is short, and it fits on one screen.
| Time (UK) | What I do | What I do not do |
|---|---|---|
| 07:00 to 07:30 | Check H4 KAMA direction on EURUSD and GBPUSD | Trade anything before London opens |
| 07:30 to 11:00 | Watch H1 for a slope turn with two closes above the line | Enter on a single close, or trade a flat KAMA |
| 11:00 to 13:00 | If a signal completed, set entry, stop and targets, then step away | Move the stop because the trade feels wrong |
| 13:30 to 16:00 | New York window, one more scan for a second signal at most | Take a third signal in one day, however good it looks |
| 16:00 onwards | Log the day, win or loss or no trade, and close the platform | Revenge-trade a loss or chase a missed signal |
How it fits funded rules: drawdown, consistency and patience
A tool is only as good as its fit with the rules of the account it is traded on, and KAMA fits funded rules in three specific ways. First, drawdown: the worst day in my twelve-trade test was a single 1R loss, 500 dollars, which is 10 percent of my 5,000-dollar daily limit and 20 percent of my personal 2,500-dollar stop, so even two losses in one day, which my one-signal cap makes unlikely, would leave the day intact. Second, consistency: the best trade in the test was 1,000 dollars against a net of 4,500 dollars, 22.2 percent, inside the 30 percent best-day cap, and the 1R/2R exit structure keeps any single day from dominating the total, because half the position is banked at the first target by design. Third, patience: KAMA forces you to wait through flat stretches where it refuses to give you a signal, and waiting is the funded trader’s most underrated skill, because the traders who blow funded accounts are rarely the ones with bad indicators, they are the ones who cannot sit still while a good indicator says nothing. A line that speeds up in trends and slows down in chop is, in the end, a line that protects you from yourself, and on a funded account that protection is worth more than any single winning trade.
Frequently asked questions
Is KAMA better than a normal EMA?
For funded trading, yes, in the specific way that matters: it avoids the whipsaw losses a fixed-speed EMA produces in ranges, while tracking trends almost as closely as a fast EMA. A normal EMA is simpler and fine in a strong trend, but it has no answer to chop, and chop is where funded accounts bleed out through the daily limit.
What happens if I change the settings to 10, 2 and 30 on a different timeframe?
The settings still work, but the signal quality drops as the timeframe drops. On M15, the efficiency ratio is computed over ten short bars that are mostly spread and noise, so KAMA flips more often and its flat stretches shorten. H1 is my minimum, H4 is better for direction, and that is a property of the timeframe, not a flaw in the indicator.
Can I use KAMA on its own, without any other indicator?
You can, and my twelve-trade test did, but I still check the H4 KAMA direction before taking an H1 signal, because a lower-timeframe signal against a higher-timeframe slope is a counter-trend trade wearing a trend indicator’s clothes. One indicator on two timeframes is still one indicator, and it is enough.
Why is the smoothing constant squared?
Squaring pushes low efficiency ratios even lower, which makes KAMA even slower in chop, and pushes high ratios only slightly lower, so trends are barely affected. Without the square, KAMA would still adapt, but it would drift through ranges instead of sitting still in them, and drifting is what produces the fake signals the indicator exists to prevent.
Does KAMA work on gold and indices?
It works mechanically on any chart, but I only trade it on EURUSD and GBPUSD, because gold and indices gap and spike in ways that distort the efficiency ratio for a bar or two, and a distorted ratio makes KAMA jump just when it should sit still. If you trade it elsewhere, widen your stop and expect more failed flat-KAMA breakouts.
How is KAMA different from the Hull moving average?
Hull is fast and low-lag everywhere, including in chop, so it still whipsaws in ranges, just faster. KAMA is fast only when the efficiency ratio says the market is trending, and slow when it says the market is chopping. Hull solves lag; KAMA solves whipsaw. On a funded account, whipsaw is the more expensive problem, because it costs you daily limit a little at a time.
Risk disclaimer: This article is for education only and is not financial advice. Trading leveraged forex on a funded account can lose money quickly, and past results from my own twelve-trade test do not predict your results. Never risk money you cannot afford to lose, and always check your firm’s current rules before trading any indicator, because rules change and your account is governed by the firm’s terms, not by this guide.




6 comments
[…] well with the other adaptive tools on this site. If you like the McGinley idea, compare it with the Kaufman adaptive moving average, which adapts to efficiency rather than speed, and the Hull moving average, which attacks lag from […]
[…] are worth clearing up before the formula. First, the efficiency ratio is not the same as the Kaufman Adaptive Moving Average, even though KAMA uses the efficiency ratio inside its own maths to speed up in trends and slow […]
[…] uses CMO; KAMA uses an efficiency ratio; read my KAMA guide for the […]
[…] smoothly, so the average speeds up as a trend straightens out and freezes as chop sets in. The Kaufman Adaptive Moving Average guide covers the other famous adaptive average, but KAMA adapts through an efficiency ratio built from […]
[…] It gives no overbought or oversold reading, no squeeze reading, and no target. Pairing it with the Kaufman adaptive average as a second opinion is reasonable; replacing it with a band or oscillator is not. And the McGinley […]
[…] is closest in spirit to the Kaufman Adaptive Moving Average, which also speeds up and slows down with market efficiency — but KAMA adapts on a single […]