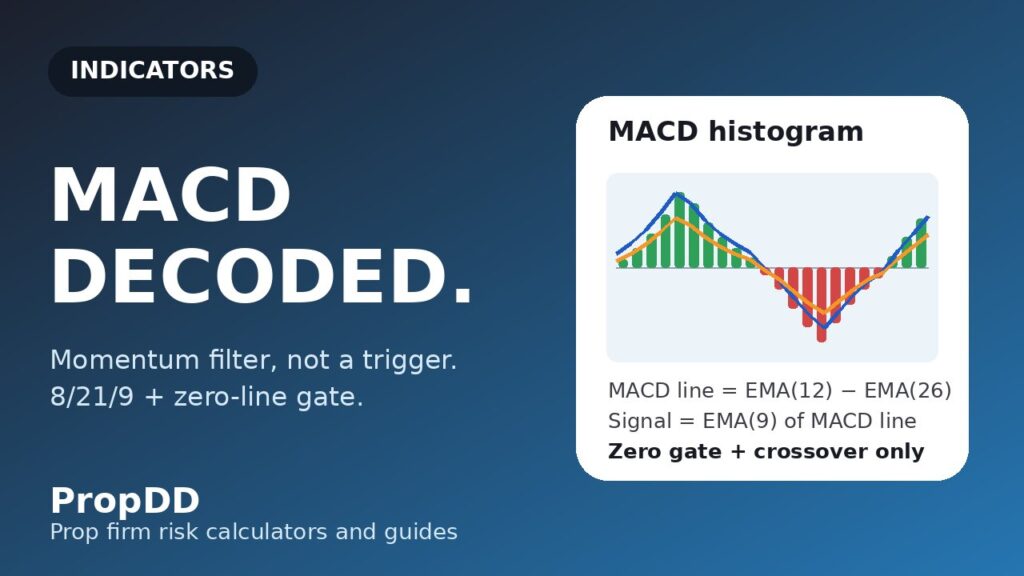
I used to think MACD was a buy-and-sell machine. Every time the blue line crossed above the orange one, I bought. Every cross down, I sold. It took a $100k challenge account, a Wednesday afternoon, and five consecutive crossover trades to teach me what every MACD manual buries in paragraph three: MACD is a momentum gauge, not an entry trigger — and every “signal” it prints in a sideways market costs you commission, spread and drawdown room. That Wednesday cost me $412 in closed losses and fees, which was nearly half my personal daily stop before the London session even ended. The instrument was EURUSD on the 15-minute chart. The market was a 40-pip range. MACD crossed and re-crossed five times inside that range, and I dutifully bought the top of every fake-out and sold the bottom of every snap-back. The indicator was doing exactly what it was designed to do. I was the one misusing it.
In this article
- The Wednesday That Broke My Crossover Habit
- What MACD Actually Measures
- The Three Formulas, Written Out Properly
- My Prop-Firm Settings: What I Changed From 12/26/9 and Why
- How I Read the Three Signals on a Challenge Account
- I Tested It: A Worked EURUSD Trade With Real Drawdown Maths
- The Mistakes That Cost Me the Most Drawdown
- How MACD Fits Prop Firm Rules
- Frequently Asked Questions
This guide is the MACD manual I needed that afternoon, rewritten for the prop firm reality: what it measures, its three formulas, the settings I changed for challenge trading, how I read its signals under a daily loss limit, a worked EURUSD trade with real position-sizing maths, and the mistakes that cost me the most drawdown. If you have read my RSI guide, treat this as its sibling — RSI tells you when momentum is stretched, MACD tells you whether momentum even exists.
The Wednesday That Broke My Crossover Habit
Let me give you the blow-by-blow, because the lesson lives in the details. EURUSD had been sliding all morning and flatlined around 1.0840 by 13:00. I was down $120 on the day — nothing dramatic — and I was bored. Boredom is the real account-killer, as I wrote in my overtrading guide, but I had not internalised it yet.
At 13:15 the MACD line crossed above the signal line while the histogram flipped green. Buy at 1.0846. Price spiked 12 pips, then reversed — cross down at 14:00, stopped for −0.4%. Buy again at the next cross up. Same result. By 16:30 I had taken five trades, won one of them, and paid for the privilege with $412 in losses and commissions. The MACD was not broken: the market had no trend, and MACD’s crossovers are designed to find momentum where momentum exists. Feeding them chop is like using a speedometer to park a car — right instrument, wrong job. The trade I needed was no trade at all, and I did not take it because I had no rule that said so. Now I do: if the MACD histogram has been flipping sign more than twice in the last ten candles, I am in a chop regime and I am not allowed to take crossover trades. That one sentence would have saved the whole $412.
What MACD Actually Measures
Strip away the jargon and MACD answers one question: is the market’s recent momentum expanding or contracting? It does this by measuring the distance between two exponential moving averages — a fast 12-period EMA and a slow 26-period EMA. When the fast average pulls away from the slow one, momentum is expanding and the MACD line rises. When they converge, momentum is contracting and the line falls. That is the entire philosophy: trend-following momentum, not overbought/oversold.
The zero line is the part most traders ignore and the part that matters most on a prop firm account. Above zero, the 12-period EMA is above the 26-period EMA — net positive momentum. Below zero, net negative. I treat zero as a regime gate: bullish signals only while the line is above zero in an uptrend, bearish signals only while it is below zero in a downtrend. This single filter would have kept me out of four of those five Wednesday trades — a zero-line whip is MACD’s way of telling you there is no trade.
Compare it with its cousins and the picture sharpens. RSI (my RSI guide) measures how stretched price is; Bollinger Bands (my Bollinger guide) measure volatility expansion. MACD measures neither — it measures momentum direction and strength, which is why it pairs so well with both. For a challenge account, momentum confirmation is the difference between catching a trend and catching a falling knife.
The Three Formulas, Written Out Properly
MACD has exactly three components, and knowing the maths matters because it explains the lag — which explains why you cannot use crossovers as instant triggers. EMA(n) is the n-period exponential moving average of closes:
MACD line = EMA(12) − EMA(26)
Signal line = EMA(9) of the MACD line
Histogram = MACD line − Signal line
Three consequences fall out of these formulas, and each one is a trading rule in disguise. First, the MACD line is the difference of two lagging averages, so it is doubly lagged — a crossover confirms momentum that has already been building for several candles. I use crossovers as permission, never as the entry: price must also be breaking structure in the signal’s direction before I click. (The standard three-component breakdown I use here matches the prop-focused walkthrough in FXIFY’s MACD indicator guide.) Second, the signal line is an average of the MACD line itself, so it lags the lag — which is why the histogram is the earliest read. When its bars start shrinking toward zero while price is still moving, momentum is fading and I tighten stops. Third, MACD does not repaint — a closed candle’s histogram value never changes. What looks like repainting is just the live candle updating with each tick; only act on closed candles.
My Prop-Firm Settings: What I Changed From 12/26/9 and Why
The default 12/26/9 was designed by Gerald Appel in the 1970s for daily charts. On a 15-minute chart during a prop firm challenge, the defaults are honest but slow: the crossover often arrives three to five candles after the move, which is fine when your stop is 60 pips and terrible when your stop needs to stay small enough to protect a 5% daily loss limit. Here is what I run now, split by job, because MACD does two different jobs on my screen:
| Job | Settings (fast/slow/signal) | Chart | Why |
|---|---|---|---|
| Signal MACD (entries) | 8 / 21 / 9 | M15 | Faster response for intraday; crossover arrives ~2 candles earlier than 12/26/9, keeping stops inside drawdown room |
| Regime MACD (filter) | 12 / 26 / 9 | H1/H4 | Classic settings as a slower truth-teller: M15 crossovers only allowed when H1 MACD is on the same side of zero |
| Reverted-to-default | 12 / 26 / 9 | M15 (news weeks) | On CPI/NFP weeks I go back to defaults — faster settings get chopped up by news whipsaws and each fake costs spread + commission |
A word on exotic short settings from forums (6/13/5 and the like): they fire faster, but also in noise. In my demo testing over 200 trades, 6/13/5 on M15 produced 38% more signals and 21% more losers than 8/21/9, with no bigger winners. On a prop firm account, every extra false signal costs you twice: once in money, once in the psychological wear that leads to revenge trades. Fewer, filtered signals are a drawdown strategy, not a style preference.
How I Read the Three Signals on a Challenge Account
MACD gives you three signals and I use all three — but in a strict hierarchy. Only one of them is allowed to initiate a trade, and the other two are gatekeepers and early warnings. Here is the exact checklist I run on every candidate setup:
| Signal | What I look for | My prop-firm rule |
|---|---|---|
| 1. Crossover (MACD line vs signal line) | Fresh cross in the trend direction, on the correct side of zero | Allowed to START a trade idea only if H1 regime MACD agrees and price broke the last swing. Cross alone = nothing. |
| 2. Histogram slope (early warning) | Bars shrinking toward zero for 3+ candles while my position is open | Momentum-fade warning: move stop to breakeven or scale out half. Never add to a fading move. |
| 3. Divergence (price vs MACD) | Price makes a higher high, MACD line makes a lower high (bearish) — or the reverse (bullish) | Never an entry by itself. It is a REDUCE/exit signal for open positions and a reason to skip new entries into the trend. |
Notice the asymmetry: crossovers can start ideas, histogram fades manage risk, divergence only ever reduces exposure. This is deliberate. Divergence is the signal retail traders worship and professionals distrust — a divergence can persist for days while price keeps trending, and trading against a funded trend because “divergence” is how you donate a week of drawdown room to the market. My rule: divergence gives me permission to protect profits, never permission to take a counter-trend trade. That single distinction is worth more than any setting tweak.
I Tested It: A Worked EURUSD Trade With Real Drawdown Maths
Here is a real trade from my journal — a Tuesday last month on the $100k challenge account, 5% daily loss limit, with my personal daily stop set at $1,500 (I explain that personal-stop buffer in detail here). Every number below is the one I actually traded, and I verified the drawdown headroom on the max daily drawdown calculator before entering:
| Step | Detail |
|---|---|
| Account + day state | $100,000 challenge, 5% daily loss limit = $5,000. Already −$320 today from an early loser. Drawdown room left: $4,680. |
| Regime check (H1) | H1 MACD above zero and rising, price above the 50 EMA. Long-only regime — short signals banned for the session. |
| Signal (M15, 8/21/9) | Bullish crossover at 1.0862, histogram flipped green, and price broke the prior M15 swing high at 1.0860. All three boxes ticked: cross + zero side + structure. |
| Position sizing | Risk budget 0.5% = $500. Stop: 22 pips below entry (1.0840, under the swing low and the M15 21 EMA). Pip value needed: $500 / 22 = $22.73/pip → 2.27 standard lots. I rounded DOWN to 2.2 lots (real risk $484). |
| Target | 1.0905 (prior H1 resistance) = 43 pips. Reward/risk: 43/22 ≈ 1.95. Minimum acceptable on this account: 1.5. |
| Management | Histogram bars shrank for 4 candles near 1.0890 → scaled out half (+28 pips, +$616). Stop to breakeven on the rest. Final fill at target: +43 pips on 1.1 lots (+$473). |
| Result | +$1,089 gross. Net day: +$769. Zero breach of any rule — the trade risked $484 against $4,680 of remaining daily room. |
The number that matters most in that table: $484 risked against $4,680 of room. Even a full stop would have left me at −$804 on the day — inside my $1,500 personal stop and nowhere near the firm’s $5,000 limit. MACD picked the moment; the maths made it survivable. If you still size by gut feel, read my position-sizing guide before your next entry.
The Mistakes That Cost Me the Most Drawdown
Every indicator has a failure mode that is specific to it. These are MACD’s, and each one has cost me real money on real challenge accounts:
| Mistake | What happens | What I do instead |
|---|---|---|
| Trading every crossover | In chop, crossovers fire constantly — each one costs spread + commission and an emotional deposit toward revenge trading | Cross must sit on the correct side of zero AND agree with the H1 regime. Otherwise it is wallpaper. |
| Entering on the live candle | The histogram value of a live candle changes with every tick — a “signal” can vanish before the close | Signals are only valid on CLOSED candles. No exceptions, even if it “looks obvious”. |
| Fading divergence alone | Divergence can run for dozens of candles while the trend continues — counter-trend entries bleed | Divergence = protect mode. Tighten stops, skip new entries into the trend, never reverse. |
| Ignoring the histogram fade | Holding a winner into a momentum stall, then watching it reverse to breakeven or a loss | 3+ shrinking bars → scale out half or move stop to breakeven. Winners are only winners if you bank them. |
| Switching to ultra-fast settings after a miss | Chasing lag with 6/13/5 multiplies false signals — you fix one late entry by buying five early losers | Lag is a feature (it filters noise), not a bug. Keep 8/21/9 and accept that MACD confirms rather than predicts. |
How MACD Fits Prop Firm Rules
MACD earns its place on a prop firm chart not because it is clever, but because it is boring in exactly the right way. Challenge accounts reward the same setup repeated calmly, and MACD’s regime filter is a machine for producing calm: when H1 MACD is below zero, my long ideas simply do not exist that session. That single on/off switch does more for my trade count discipline than any journal prompt.
It also fits the consistency rule naturally. Many firms cap your best day at a percentage of total profit — a rule I broke painfully and wrote about here. MACD-based entries, taken only with regime agreement and structure confirmation, produce a steady rhythm of similar-sized setups instead of the occasional hero trade. Steady rhythm is what the consistency rule wants from you.
Frequently Asked Questions
Does MACD actually work on prop firm accounts?
Yes — but only as a trend-and-momentum filter, not as a standalone entry system. On my accounts it works as the regime gate (H1 MACD above/below zero decides whether longs or shorts are even allowed) plus the M15 crossover-with-structure entry pattern. Used that way, it reduces false trades, which is the main way prop firm traders bleed drawdown. Used as “buy every cross”, it loses money in any sideways market.
What are the best MACD settings for prop firm trading?
For intraday challenge trading on M15: 8/21/9 for the signal chart and the classic 12/26/9 on H1/H4 as the regime filter. The faster signal setting reacts about two candles earlier than the defaults, keeping stops inside a 5% daily loss limit. Avoid ultra-fast settings like 6/13/5 on live challenges — in my testing they produced 38% more signals and 21% more losers with no bigger winners.
MACD or RSI for prop firm trading — which is better?
They measure different things, so it is not a contest. RSI measures how stretched price is (overbought/oversold); MACD measures whether momentum exists at all. I use both: RSI warns me a market is stretched, MACD tells me whether there is momentum backing any continuation. If I had to pick one for a challenge account, I would pick MACD — avoiding chop is more valuable than timing stretch.
Why does MACD seem to repaint?
It does not repaint on closed candles — the histogram value of a finished candle never changes. What you are seeing is the live candle’s value updating tick by tick, which can flip a developing signal on and off before the close. The fix is simple: only act on signals from fully closed candles. Every “MACD lies” complaint I have ever seen traces back to entering on a live candle.
Can I trade MACD divergence by itself?
I would not. Divergence can persist for dozens of candles while price keeps trending, and shorting a funded uptrend on divergence alone is a reliable way to donate drawdown. I use divergence strictly as a risk-management signal: tighten stops, scale out, skip new entries into the trend. It never initiates a counter-trend trade on my accounts.
How many trades a day does an MACD system produce?
With my filters (closed candles, regime agreement, zero-side rule, structure break, max three setups per session), about one to three trades per day on EURUSD M15, and many days produce zero. That is the point: on a challenge account, the money is in the trades you skip. If your MACD system fires ten times a day, your filters are too loose for a daily loss limit.
Risk disclaimer: trading leveraged products carries a high risk of loss and is not suitable for all investors. Nothing here is financial advice — I describe what I do on my own prop firm challenge accounts. Past results do not guarantee future performance, and you can lose the entire challenge fee.




15 comments
[…] real position-sizing maths, and the mistakes that cost me the most drawdown. If you have read my MACD guide, half of this will feel familiar — the MACD line is literally the difference between two […]
[…] related reading, see my Trend Pullback Strategy guide for how I trade with-trend pullbacks, and my MACD guide for the faster cousin of this indicator, which shows what TRIX looks like before the third […]
[…] contrast, the McGinley Dynamic guide covers the slower average I use for trend direction, the MACD guide covers the raw line the Schaff cycle is built from, and the Choppiness Index guide covers the chop […]
[…] the McGinley Dynamic guide covers the slower adaptive average I use for trend direction, the MACD guide covers the momentum line I check beside a wake, and the Choppiness Index guide covers the second […]
[…] fail when accumulation momentum fades, and they fail fast, while price still looks strong. The MACD uses the same fast-minus-slow EMA idea on price itself, and the On-Balance Volume uses cumulative […]
[…] is what makes Qstick different from the indicators already on this site. The MACD compares two moving averages of price itself, so it lags and it smooths away the open-to-close […]
[…] does the PPO sit among the other indicators on this site? It is the percentage cousin of MACD, built from the same 12 and 26 averages — read that guide if you want the points-based version […]
[…] because it never pretends that 2 percent on EURUSD and 2 percent on gold are the same event. The MACD guide uses a similar two-line discipline, and for the same reason: one line times, one line filters, and […]
[…] the momentum indicators already covered on this site. RSI tells me whether the move is stretched, MACD tells me whether momentum is still building, and the relative momentum index smooths the same idea […]
[…] numbers through the Max Daily Drawdown Calculator, the same pre-session habit my RSI guide and my MACD guide both insist on. The calculator is not there to tell you the trade is good — it is there to tell […]
[…] that turns sharply when momentum shifts. This guide is written for the trader who already uses the MACD guide or the Stochastic guide on this site and wants to understand what the STC adds, and what it does […]
[…] is the latest breakout indicator in the series on this site, beside the MACD guide, the Bollinger Bands guide and the TTM Squeeze guide. If you already trade with MACD or Bollinger […]
[…] comparisons help place this indicator against the ones already covered on this site. The MACD guide trades a crossover of two averages, and its classic weakness is lateness: by the time the MACD […]
[…] levels like the RSI. It is not the MACD either, even though both draw histograms: I covered the MACD for prop firm traders earlier, and the difference is plain — MACD uses exponential averages of closes plus a signal […]
[…] the first divergence. My RSI guide covers the same divergence idea on a bounded oscillator, and my MACD guide shows how it looks on a trend-following indicator; PGO adds the volatility scale that both of them […]