Rectangle Breakout Calculator
A rectangle is the market going quiet: price bounces between a ceiling and a floor, touches both edges more than once, and builds up…
Open tool →Simple, fast calculators built for prop firm traders. Every tool comes with a full guide that explains how to use it and how to read the results.
A rectangle is the market going quiet: price bounces between a ceiling and a floor, touches both edges more than once, and builds up…
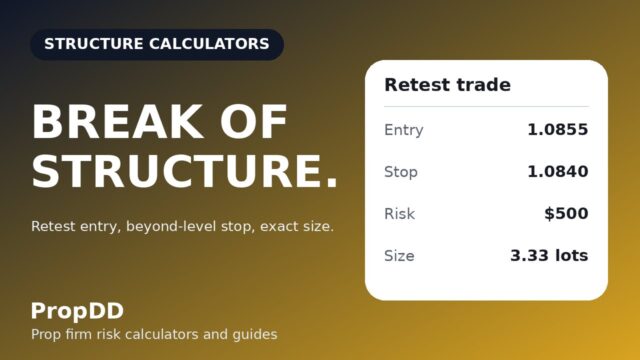
Open tool →A break of structure is the moment price closes beyond the most recent significant swing high or swing low and keeps going — the…
Open tool →What this calculator does An order block is the last opposite-coloured candle (or small cluster) before a strong displacement leg — the footprint of…
Open tool →A turtle soup is the market’s oldest trick: price pokes above a well-watched high, raids the stops sitting there, then slams back inside —…
Open tool →My worst three-crows habit used to be eyeballing the pattern and doing the maths in my head. Candle 1 high was “about 1.0890”, the…
Open tool →My worst Asian-session habit used to be drawing the box perfectly and then doing the maths in my head at 8:04 in the morning.…
Open tool →My range fades used to fail in the arithmetic, not the read. I would spot a clean box on EUR/USD, feel good about fading…
Open tool →I used to judge a strategy by its win rate. A 70% win rate felt unbeatable — until I realised the wins averaged 0.6R…
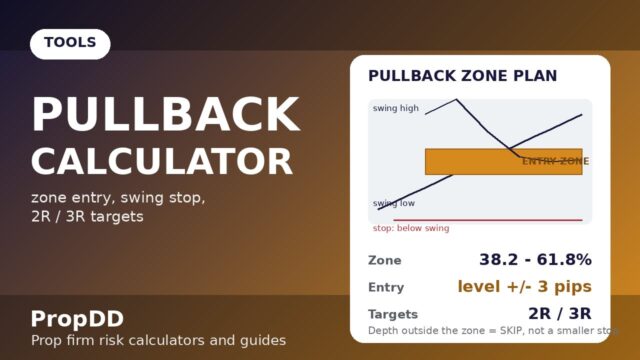
Open tool →My pullback trades used to fail in the planning, not the patience. I would spot a beautiful retracement into the 50% level, feel disciplined…
Open tool →My pin bar trades used to die in the same place: the sizing. I would spot a beautiful rejection wick, feel clever about it,…
Open tool →