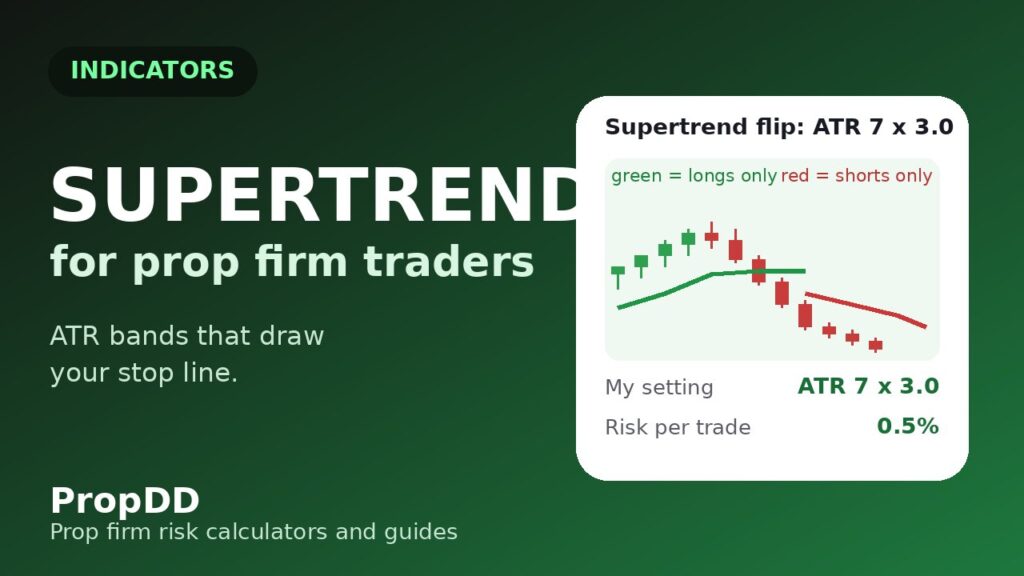
The Supertrend indicator nearly ended my $100K challenge in a single afternoon, and it was doing exactly what it was built to do. That was the part that stung. I had loaded the Supertrend onto my XAUUSD 15-minute chart because a funded trader in a group I follow called it “the only indicator that draws your stop loss for you” — a green line under price when things are fine, a red line above price when they are not, flipping the moment the trend turns. Then gold spiked $14 on a headline, crashed $22, and spiked again. The line flipped red, green, red, green — five flips in 40 minutes. I took four of them. By the close I was down $847, my personal daily stop had fired, and the account sat $160 from the firm’s 5% daily loss limit. Supertrend is a trend detector with an ATR-sized leash, and I was letting it make decisions in a market that was all leash and no trend.
In this article
- The Afternoon the Flip-Flop Ate My Buffer
- What Supertrend Actually Measures
- The Formula Behind the Flip
- My Prop-Firm Settings: 7/3 or 10/3
- How I Read the Signals (and the Filter That Cut My Fake Flips)
- I Tested It: A Worked XAUUSD Trade With Real Drawdown Maths
- The Four Supertrend Mistakes That Burn Drawdown
- My One-Page Supertrend Routine for Challenge Days
- How Supertrend Fits Prop Firm Rules
- Frequently Asked Questions
If you read my EMA guide, you will notice a family resemblance — the Supertrend’s bands are built from the same average true range volatility I use for position sizing. But where the ATR sizes my risk, the Supertrend draws the line that tells me whether I should be in the trade at all.
The Afternoon the Flip-Flop Ate My Buffer
It was a Wednesday, CPI day, and XAUUSD had been grinding higher all morning. The Supertrend line sat green under price the whole way, about $6 below. At 13:31 the number printed hot. Gold ripped to $2,441 in eleven minutes, then someone large decided that was enough and it fell to $2,419 just as fast. The green line flipped red above price at $2,437. I shorted at $2,434 with 0.35 lots. Price bounced back to $2,436 in six minutes — the line flipped green again. Stop hit: -$70.
What followed was the chop session from hell. The Supertrend line crossed price five times in 40 minutes, and I traded four of those flips like a metronome. Long at $2,431 (flipped red four minutes later, -$96). Short at $2,426 (flipped green, -$112). Long at $2,430 (flipped red, -$84). Short at $2,424 (finally held — but I was so rattled I closed it for +$60 at the first wobble). Net damage: $847 in closed losses plus commission, on an account where my personal daily stop sits $400 below the firm’s $5,000 limit. A flip is not a signal. It is the indicator telling you volatility just moved the line to the other side of price — and on a news spike, volatility moves lines constantly. My rule now, taped to the same monitor as my EMA note: no new Supertrend entries within 30 minutes of a red-folder release. The indicator is innocent; the session was the problem.
What Supertrend Actually Measures
Strip away the colours and the Supertrend answers two questions at once: which way is the trend pointing, and how far does price have to move against me before I admit the trend is over? It does this by wrapping the average true range — the market’s own measure of “a normal move” — around the midpoint of recent price, and then drawing a boundary that only ever tightens in your favour.
Here is the intuition that matters on a prop firm account. Most trailing stops are a fixed distance: you buy, you place your stop 20 pips back, and you move it up by hand. The Supertrend automates that logic, but instead of a fixed distance it uses ATR — a multiple of recent volatility. In a calm market the band sits close to price and flips quickly; in a wild market it sits far away and gives the trade room to breathe. The Supertrend is really a volatility-adjusted trailing stop wearing an indicator’s costume. That is why funded traders love it: the daily loss limit is the one rule that ends accounts, and an indicator that builds your stop distance from live volatility is speaking the firm’s language.
It has one honest limitation, and it is the whole reason this guide exists: it is a trend tool. In a ranging market the bands flip constantly, each flip looking like a fresh signal, each one costing you spread and commission while your drawdown quietly fills. I use Supertrend in exactly two roles now: a bias gate (price above the green line = longs only, below the red line = shorts only) and a trailing invalidation for trades I entered on another setup. I never take a flip as an entry signal on its own. The prop-firm Supertrend strategy breakdown at PropFirmPineScripts reaches the same conclusion from the automation side: fixed rules plus a daily kill switch, because the indicator alone will overtrade you.
The Formula Behind the Flip
You never have to compute the Supertrend by hand — TradingView, MT5 and cTrader all plot it from two inputs — but you need the formula, because it explains why the line only moves one way, and that explains every Supertrend mistake I made that Wednesday. There are two bands:
Upper band = (High + Low) ÷ 2 + (Multiplier × ATR)
Lower band = (High + Low) ÷ 2 − (Multiplier × ATR)
Supertrend = the band that is currently “active” — the lower band in an uptrend, the upper band in a downtrend. The active band may only move in your favour: the lower band can rise but never fall; the upper band can fall but never rise. The flip happens when price closes through the active band.
Two consequences matter for your account. First, the multiplier is your leash length: with the default 10-period ATR and a 3.0 multiplier, the band sits three average-ranges away from the midpoint, so normal noise never touches it — but the flip also comes late, after the move is well underway. Choosing the multiplier is choosing between late, reliable flips and early, expensive ones. Second, the one-way rule is what makes the line a valid trailing stop: once the lower band rises to lock in profit, it can never drop back and give that profit away.
My Prop-Firm Settings: 7/3 or 10/3
The two inputs are the ATR period and the multiplier. The platform default of 10 and 3.0 is the conservative choice, and on a challenge account conservative is usually correct — but it is not the only answer. I run two presets and I switch between them deliberately, never mid-trade:
| Preset | Settings | Best use | Prop-firm verdict |
|---|---|---|---|
| Patient | ATR 10, × 3.0 | H1/H4 bias gate, daily-loss protection on swings | My default. Fewer flips, bigger stops — size down to fit the daily limit. |
| Responsive | ATR 7, × 3.0 | M15 intraday bias on majors, faster exits | Useful in trend days; banned on news days and dead ranges. |
| Tight | ATR 10, × 2.0 | Scalping small ranges, tight trailing | Too twitchy for a challenge — flips cost more than they earn. Avoid. |
| Loose | ATR 14, × 3.5 | Gold/indices swings, very wide stops | Flip comes very late; only works if your size is tiny. |
The pattern in the table is the point: the multiplier controls the false-flip rate, the period controls the reaction speed. On a $100K account with a 5% daily limit, I would rather size down around the Patient preset’s wider stops than chase the Responsive preset’s earlier entries. A late flip that keeps you in a real trend beats an early flip that pays for three fake ones.
How I Read the Signals (and the Filter That Cut My Fake Flips)
Here is my exact reading routine, in the order I check it. Every line exists because one of the mistakes later in this guide taught it to me:
| What I see | What it means | What I do |
|---|---|---|
| Price above green line, line rising | Uptrend with room to breathe | Longs only. Entries on pullbacks to the line, never market-chasing. |
| Price below red line, line falling | Downtrend intact | Shorts only. Same rule: rallies to the line, not breakdowns. |
| Line flipped in the last 2 candles | Fresh signal — or fresh noise | Wait one confirming candle close. No same-candle entries, ever. |
| Line flat for 5+ candles | The band is pinned — range or stall | Stand down. Flat-line flips are the most expensive ones. |
| Flip within 30 min of red news | Volatility artefact, not a trend change | Ignored automatically — my news rule overrides the indicator. |
| Two flips in 10 candles | Chop confirmed | Chart goes off-limits until a session break resets the structure. |
The single filter that changed my results is the higher-timeframe gate: I only trade M15 flips that agree with the H1 Supertrend’s colour. In my journal, that one rule cut my fake-flip trades by about half, because the H1 line does not care about 15-minute noise. The best use of a fast indicator is checking it against a slow version of itself.
I Tested It: A Worked XAUUSD Trade With Real Drawdown Maths
Two weeks after the CPI disaster I got my clean test. A Thursday, no red news on the calendar, XAUUSD trending down from the Asian session. The M15 Supertrend had been red since 06:15 and the H1 line was red too — both timeframes agreed, which is my green light for paying attention. At 09:40 price rallied into the red line at $2,416.50 and printed a bearish engulfing candle that closed back below it.
Here is the part most indicator guides skip — the sizing maths, done before the entry, against the firm’s rules. The account is $100,000 with a 5% daily loss limit ($5,000), and my personal daily stop sits at $4,000 of closed losses. My rule is 0.5% risk per trade ($500). The Supertrend line sat at $2,419.20 when I entered at $2,416.50, so my invalidation was $2.70 above entry. Gold at 1.00 lot moves $100 per $1, so:
Distance to invalidation = $2,419.20 − $2,416.50 = $2.70
Dollar risk per lot = $2.70 × $100 = $270 per 1.00 lot
Position size = $500 ÷ $270 ≈ 1.85 lots (rounded down to 1.80)
| Trade input | My number | Why it matters |
|---|---|---|
| Entry | Short XAUUSD 1.80 lots @ $2,416.50 | Pullback to the red line + rejection candle, M15 and H1 both red |
| Invalidation | $2,419.20 (the Supertrend line) | The indicator draws the stop — a close above the line ends the idea |
| Risk | $486 (0.49% of account) | Under my 0.5% rule; one loss = under 10% of the $5,000 daily limit |
| Target | $2,404.00 (Asian low, 2.6R) | Structure-based target, not a round number |
| Result | +$1,890 closed (2.4R after spread) | Line trailed down behind price; I exited at the target, not at a flip |
| Drawdown check | $486 worst case = 9.7% of daily limit used | Verified against the max daily drawdown calculator — ten straight losses at this size still leaves the day intact |
Two details in that table are the real lesson. First, I exited at my structure target, not when the line flipped back — the flip is a trailing invalidation, not a profit target, and waiting for it gives back half the move on gold. Second, the risk was sized to the line’s actual distance ($2.70), not to a “comfortable” round number. When the indicator draws your stop, it also draws your position size.
The Four Supertrend Mistakes That Burn Drawdown
Every one of these cost me real money. They are listed in the order they hurt:
| Mistake | What it cost me | The rule that replaced it |
|---|---|---|
| Trading flips inside a flat range | $400+ in one session of back-and-forth | Line flat for 5+ candles = no new entries, whatever the colour |
| Entering on the flip candle itself | Two stop-outs that would have been avoided by one confirming close | One full confirming candle after the flip before any entry |
| Sizing to a “normal” stop instead of the line’s distance | A 0.9% loss that should have been 0.5% | Risk ÷ (line distance × value per unit) — the line sets the size |
| Holding for the reverse flip as the exit | Gave back 40–60% of three winning moves | Structure targets for exits; the flip is a stop, not a take-profit |
My One-Page Supertrend Routine for Challenge Days
This is the literal checklist I run through before the first entry. It takes four minutes:
| Time | Task |
|---|---|
| Pre-session | Mark red-folder news times; note which instruments are in a real trend vs a range on H1 |
| Open | Check H1 Supertrend colour = bias for the day; M15 colour must agree before any entry |
| Per setup | Pullback to the line + rejection candle → compute size from line distance → enter on next candle |
| Live | Line trails the stop automatically; partial at 1.5R, runner to structure target |
| End of day | Log every flip taken and skipped; count fake flips — two in 10 candles and the chart is shelved tomorrow |
How Supertrend Fits Prop Firm Rules
The reason the Supertrend belongs on a challenge account is not its win rate — it is its honesty about risk. The daily loss limit is a hard number, and every other indicator leaves the stop placement to your discretion, which on a tired afternoon means your stop ends up wherever your hope is. The Supertrend draws a volatility-based invalidation on the chart before you enter, which means your position size is computable before you click. That single property — risk known in dollars before entry — is what prop firms actually test for.
It also fits the consistency rule better than most trend tools. Because the bands only tighten, the indicator naturally produces fewer, longer trades instead of constant flip-trading — exactly the behaviour that keeps any single day from dominating your P&L. I run the Supertrend alongside my risk of ruin calculator once a week: the indicator protects each trade, the calculator tells me whether my whole system protects the account.
Frequently Asked Questions
What are the best Supertrend settings for a prop firm challenge?
The 10-period ATR with a 3.0 multiplier is the safest default — fewer flips, wider stops, and you size down to fit your daily limit. The 7-period version reacts faster on M15 charts but flips more in chop, which costs commission and drawdown. I would not go below a 2.5 multiplier on a challenge account; tighter than that and the flip rate makes the indicator unusable.
Does Supertrend repaint?
On a closed candle, no — the historical line is stable. On the live candle, the band can shift as the high and low develop, which is why I never enter on the flip candle itself. Wait for the candle to close through the band, then one confirming candle, then consider the entry.
Can I use Supertrend alone to pass a prop firm challenge?
I would not. It is a bias gate and a trailing invalidation, not a complete system. My stack is: Supertrend for bias and the trailing stop, a rejection candle for the entry trigger, and my own sizing maths for risk. The indicator answers “which direction and where am I wrong” — you still have to answer “how big” and “when”.
Why does Supertrend keep flipping in ranging markets?
Because the bands are ATR-based and the flip triggers on a close through the band. In a range, price oscillates across the midpoint, and each swing is large enough relative to ATR to cross the band. The indicator is correctly reporting that volatility keeps pushing price past its boundary — the problem is that there is no trend to bound. The fix is not new settings; it is the flat-line rule: if the line goes flat for five candles, the chart is off-limits.
Supertrend vs moving average — which is better for funded accounts?
They do different jobs. A moving average summarises trend direction; the Supertrend adds a volatility-based invalidation line you can actually place a stop at. I use both: the EMA for the clean trend read (see my EMA guide) and the Supertrend for the trailing stop and the bias gate. If I had to pick one for a challenge, it would be the Supertrend, because it turns risk into a number before entry.
How do I size positions with Supertrend on a 5% daily loss limit?
Measure the distance from your entry to the Supertrend line in price terms, convert it to dollars per lot for your instrument, then divide your per-trade risk budget by that number. On a $100K account risking 0.5% ($500), a $2.70 line distance on gold at $100 per $1 per lot means $500 ÷ $270 ≈ 1.85 lots. Never round up — round down, and if the line distance would force a size above 1% risk, skip the trade.
Risk disclaimer: this article describes my own experience with a technical indicator on simulated and evaluation accounts. It is educational content, not financial advice. Trading leveraged products on prop firm accounts can lose the fee you paid and any funded profits — never trade money you cannot afford to lose.




4 comments
[…] else. I kept Aroon as the gatekeeper and retired ADX. If you want a second confirmation, the Supertrend pairs better with Aroon than ADX does: Aroon answers “is there a trend worth trading”, […]
[…] once Donchian has already confirmed the trend is real. And for the exit half of the trade, the Supertrend line makes a cleaner trailing reference than the 10-bar Donchian exit on choppy days — I use […]
[…] and 1-hour charts where funded swing trades live, the sluggishness is the feature. If you use the Supertrend already — PSAR’s closest cousin — the same philosophy applies: both are trend trailing […]
[…] watched, not traded, because thin volume prints bricks that reverse the moment London opens. The Supertrend indicator is my optional second filter: I skip longs when it is red on the hourly candle chart, and skip […]