On a Wednesday in late October I bought EURUSD after two candles that looked like a reversal — a long red candle closing near its low, then a strong green one near its high. Two bars, a clean turn, I was in — and twenty minutes later I was five hundred dollars poorer, ten percent of my daily limit gone on a pattern that had never formed. I had traded two bars of a three-bar pattern. A three bar reversal needs all three bars, in order, each with a job — and the bar I skipped, the apex bar, proves the sellers are exhausted. This article is the strict version I trade now: measure, apex and trigger, the exact entry, stop and target, and the sizing maths that keep a funded account alive when the pattern fails — four times out of ten in my own log.
In this article
- What a three bar reversal actually is
- Three bar reversal vs the patterns it gets confused with
- The six rules: setup, entry, stop, target, session, size cap
- Position sizing under a five thousand dollar daily limit
- The worked trade, bar by bar
- I tested it: ten trades, six winners
- When the three bar reversal fails
- My routine: the daily three bar scan
- Frequently asked questions
I trade a one hundred thousand dollar funded account with a five thousand dollar daily loss limit, risking five hundred dollars per trade. Every number comes from that account and a ten-trade test on the strict version. If you trade reversals on a funded account, refuse every version missing a bar.
What a three bar reversal actually is
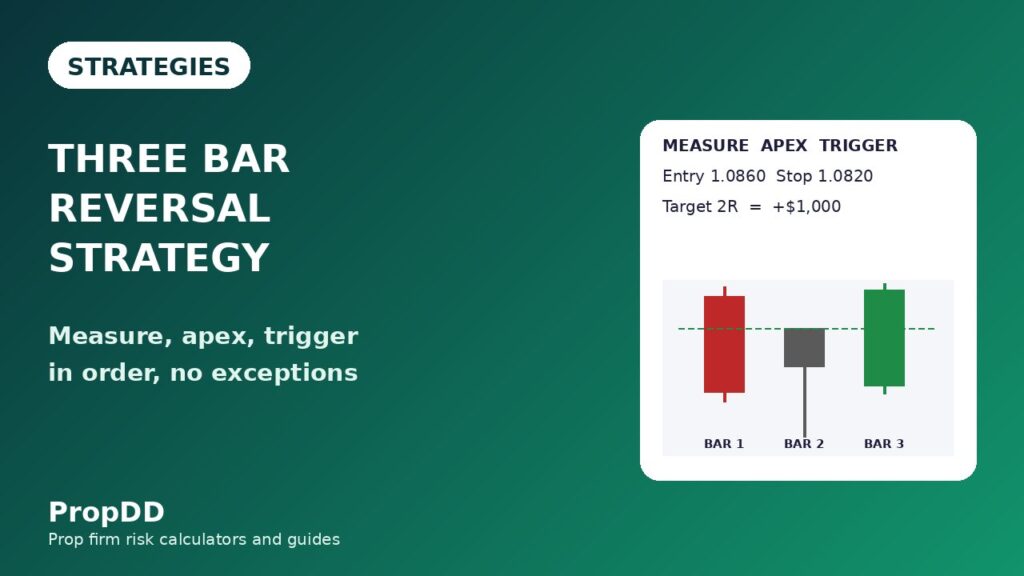
A three bar reversal is a three-candle sequence that marks where a trend runs out of sellers or buyers and turns. Each bar has a job. The measure bar is the last strong candle of the old trend, closing hard in its direction. The apex bar is the extreme: it pushes to a new low in a downtrend, or a new high in an uptrend, then closes weakly, with a long wick against the trend. The trigger bar confirms: a strong candle closing beyond the apex extreme in the new direction. Three bars, in order, no exceptions. Skip one and you do not have the pattern; you have a guess wearing its clothes.
For a bullish reversal after a downtrend: bar 1 closes down hard; bar 2 makes a lower low and closes back up off it, leaving a long lower wick; bar 3 closes above bar 2’s high — that close is the trigger. The bearish version is the mirror. I trade it hourly, where three bars span three hours and five-minute noise cannot fake an apex.
Two details decide whether the pattern is real. First, the apex bar must make a new extreme — a lower low than every bar before it in the move. A bar that merely pauses inside the range is not an apex; it is a rest, and trading it is how I lost the five hundred dollars in the opening story. Second, the trigger bar must close beyond the apex bar’s extreme, not merely wick through it. A wick that closes back inside is a failed trigger. The close is the confirmation; the wick is the rumour. The sequence is documented in an independent three bar reversal pattern guide, which also stresses trading it only at key levels.
Three bar reversal vs the patterns it gets confused with
Three reversal patterns live in the same neighbourhood, and confusing them is the fastest way to trade the wrong rules. Every rule below assumes three bars — not one or two, not a swing formation.
| Pattern | Bars involved | What confirms it | Entry trigger | How I trade it |
|---|---|---|---|---|
| Three bar reversal | Exactly 3 consecutive candles | Trigger bar closes beyond the apex extreme | Break of the apex bar’s extreme | At a key level, H1 |
| Ross Hook 1-2-3 | Swing points over many bars | Close past point 2 | Breakout, then hook | Wait for the hook |
| Engulfing | 2 candles | Second engulfs the first | Close of engulfing candle | Needs a key level |
| Pin bar | 1 candle | Long wick, small body | Break of pin extreme | Never alone in chop |
The confusion that costs the most money is the Ross Hook. That method starts with a 1-2-3 formation — swing point 1, a retracement to point 2, a failed retest at point 3 — and trades the hook after the breakout past point 2, spanning many bars. The three bar reversal is three consecutive candles, confirmed by a close past one bar’s extreme. Same idea — a failed extreme, then a turn — different construction, different stop, different size. The Ross Hook guide covers that method in full. Never mix the two in one trade plan.
The engulfing pattern is closer — two candles instead of three — and the pin bar is a single candle. Both have their own guides here: the engulfing pattern guide and the pin bar reversal guide. The three bar reversal is stricter: the apex bar forces the market to prove exhaustion before the trigger confirms anything. A pin bar can print in the middle of nowhere; a three bar reversal at a key level, after a sustained move, is much rarer.
The six rules: setup, entry, stop, target, session, size cap
Six rules; I do not trade when any one fails. Rule 1, location: the pattern only counts at a key level — daily support or resistance, a three-touch trendline, or the 61.8 percent retracement of the last leg. Mid-range it is noise; at a level it is a trade. Rule 2, sequence: measure, apex, trigger — all three, in order, hourly. Rule 3, entry: a buy stop at the apex high for a bullish reversal, a sell stop at the apex low for a bearish one — the order waits for the break, so I never enter on a forming close. Rule 4, stop: below the apex low for a long, above its high for a short — the apex extreme is the invalidation. Rule 5, target: two R minimum, optional partial at one R. Rule 6, session and cap: London 07:00–11:00 GMT and New York 13:30–16:00 GMT only, no trade within thirty minutes of red-folder news, two three-bar trades per day maximum, never two in the same direction on the same pair.
| Rule | The rule | Why it exists |
|---|---|---|
| 1 — Location | At a key level only | Mid-range patterns fail most |
| 2 — Sequence | Measure, apex, trigger — all three, in order, on H1 | A missing bar is a guess |
| 3 — Entry | Stop order at the apex bar’s extreme | Confirmation, not anticipation |
| 4 — Stop | Beyond the apex bar’s opposite extreme | The apex is the invalidation |
| 5 — Target | 2R minimum, partial at 1R | Pays for the 40 percent losers |
| 6 — Session | London + New York only, news blackout, max 2 per day | Chop and news kill reversals |
Rule 6 is the one I broke most often before writing it down. The Asian session prints three bar reversals constantly and almost none hold — the bars are small, the extremes shallow, the trigger usually an early London position, not a turn. The same applies around a red-folder release: it prints a perfect sequence and reverses it in seconds. Both look like the pattern. Neither is.
Position sizing under a five thousand dollar daily limit
Reversal trading on a funded account is a sizing problem before it is a pattern problem. My risk is five hundred dollars per trade — half a percent of the account, ten percent of the daily limit — so ten consecutive losers would still leave the account alive. I run the formula box before every entry; if the size comes out above two lots on EURUSD I skip the trade — a stop wider than sixty pips means the apex is too far away to trust.
| Figure | Formula | My worked trade |
|---|---|---|
| Lot size | Risk / (stop pips x pip value) | 500 / (40 x 10) = 1.25 lots |
| Risk per trade | Risk dollars / account size | 500 / 100,000 = 0.5 percent |
| Daily limit used | Risk dollars / daily loss limit | 500 / 5,000 = 10 percent |
| Target at 2R | 2 x risk dollars | 2 x 500 = 1,000 |
| Expectancy | (Win rate x avg win) – (loss rate x avg loss) | (0.60 x 2.0R) – (0.40 x 1.0R) = +0.80R |
The expectancy line is why the strategy survives a forty percent loss rate: at sixty percent wins averaging two R, each trade is worth plus 0.80R — four hundred dollars at my size. I recheck it on the strategy expectancy calculator whenever the log changes. I also set my own daily stop below the firm’s limit, using the personal daily stop guide — two losers in a day and I stop, whatever the pattern shows next.
The worked trade, bar by bar
The cleanest three bar reversal in my log — EURUSD, London session. The pair had fallen fifty pips into daily support marked the night before. Bar 1 closed down hard at 1.0850. Bar 2 pushed to a new low at 1.0820 and closed back up at 1.0835, leaving a long lower wick. Bar 3 closed at 1.0870, above bar 2’s high of 1.0860. Buy stop at the apex high, 1.0860, stop below the apex low at 1.0820: forty pips of risk, 1.25 lots, five hundred dollars. The two R target, 1.0940, was reached the same session: plus one thousand dollars.
| Step | What happened | Number |
|---|---|---|
| Context | EURUSD into daily support | 1.0900 to 1.0850, 50 pips |
| Bar 1 — measure | Long red candle, closes near low | Close 1.0850 |
| Bar 2 — apex | New low, long lower wick, weak close | Low 1.0820, high 1.0860, close 1.0835 |
| Bar 3 — trigger | Strong green close above apex high | Close 1.0870 |
| Entry | Buy stop at the apex high | 1.0860 |
| Stop | Below the apex low | 1.0820 — 40 pips of risk |
| Size | 500 / (40 pips x 10 dollars) | 1.25 lots |
| Targets | 1R partial, 2R full target | 1.0900 (+500), 1.0940 (+1,000) |
| Result | Hit the same session | Plus 1,000, +2R |
Notice what did not happen. I did not buy bar 2’s wick, the first green candle, or the move after bar 3 had run twenty pips. Each pays a worse price for the same stop — and on a funded account that turns a two R winner into a one R winner. Entry: the apex high. Stop: the apex low. The rest is patience.
I tested it: ten trades, six winners
After that loss, I ran the strict version for ten trading days, one trade a day, risking five hundred dollars per trade. The table is the full log, rule broken included — the losers are the honest part. I also skipped three patterns where bar 3 closed back inside bar 2’s range: failed triggers, no trade, no loss. Skipping those is part of the strategy.
| Day | Pair and direction | Location | Result | Rule broken |
|---|---|---|---|---|
| 1 | EURUSD long | Daily support | Plus 1,000 dollars (+2R) | None |
| 2 | GBPUSD short | Trendline, third touch | Plus 1,000 dollars (+2R) | None |
| 3 | XAUUSD long | Mid-range, no level | Minus 500 dollars (-1R) | Rule 1 — location |
| 4 | EURUSD short | 61.8% retracement | Plus 500 dollars (+1R) | None — early exit at 1R |
| 5 | USDJPY long | No key level | Minus 500 dollars (-1R) | Rule 1 — location |
| 6 | GBPUSD long | Daily support | Plus 1,000 dollars (+2R) | None |
| 7 | EURUSD long | Daily support, Asian session | Minus 500 dollars (-1R) | Rule 6 — session |
| 8 | XAUUSD short | Daily resistance | Plus 1,500 dollars (+3R) | None — runner 3R |
| 9 | GBPUSD short | Daily resistance | Minus 500 dollars (-1R) | Rule 2 — wick only, no close |
| 10 | EURUSD short | 61.8% retracement | Plus 1,000 dollars (+2R) | None |
Six winners, four losers: sixty percent win rate, average win two R against average loss one R — net plus eight R, four thousand dollars, expectancy plus 0.80R per trade. Best day: one thousand five hundred dollars — thirty percent of the daily limit, 37.5 percent of total profit, inside the forty percent cap. Worst day: one five hundred dollar loss, ten percent of the limit. The finding that changed how I trade the pattern: every loser in the log broke a rule I had written down. Two with no key level, one in the Asian session, one on a trigger wick that never closed beyond the apex. The pattern did not fail four times. I failed it four times.
When the three bar reversal fails
Four failure modes, three visible before you enter. First, location: a perfect sequence mid-range reverses nothing — there is nothing to reverse from; the market is rotating, not turning. Second, session: in Asia and the dead hours between sessions, trigger bars print constantly and hold rarely — the range is too small for an apex to mean anything. Third, news: a red-folder release prints a textbook sequence and takes it back in seconds — a spike, not a turn. Fourth, the failed trigger: bar 3 wicks beyond the apex extreme and closes back inside. That is not a trade with a wide stop. That is no trade at all, logged as a skip, not a loss.
A fifth failure is harder to see: the vertical move. After a straight fifty-pip fall with no pullback, the first sequence usually prints at an untested level — the apex just the market pausing before the next leg down. I want a sustained move into a tested level, not a cliff into fresh air. If the level has no history — no prior touches, no prior reaction — I treat the pattern as unconfirmed and wait. Funded accounts reward the trades you refuse almost as much as the ones you take.
My routine: the daily three bar scan
The routine is deliberately boring — boring keeps the rules intact. I mark the levels the night before, scan only in the two sessions that pay, and stop after two trades, win or lose. The journal entry takes two minutes and is the only part I never skip: bar prices, R result, and the rule broken, if any. Ten days of that journal produced the finding in the test log.
| Time (GMT) | What I do |
|---|---|
| Before the session | Mark daily S/R, trendlines and 61.8% levels; mark 30-minute news blackout windows |
| 07:00–11:00 and 13:30–16:00 | London + New York scans on H1 at marked levels only; one setup maximum per session |
| After each trade | Log bar prices, entry, stop, R result, rule broken |
| 16:00 | Close the book: two trades max, no Asian trades, no chasing |
Frequently asked questions
Is the three bar reversal the same as the 1-2-3 pattern?
No. The 1-2-3 is a swing formation spanning many bars — point 1 a swing extreme, point 2 a retracement, point 3 a failed retest — and the first half of the Ross Hook method. The three bar reversal is exactly three consecutive candles: measure, apex, trigger. Same idea, different construction, different stop, different size. Do not trade one with the other’s rules.
What timeframe works best for the three bar reversal?
The hourly chart. Three hourly bars span three hours — long enough for the apex to mean something, short enough for a setup most days. Use fifteen minutes to fine-tune an entry once the hourly pattern is complete. Five minutes prints it constantly; most of those prints are noise.
Can I trade the three bar reversal on gold?
Yes. My log has two XAUUSD trades: one winner at three R, one loser with no level. Re-run the sizing formula with gold’s dollar value per point — the risk stays five hundred dollars, the size gets smaller. Never copy a forex lot size onto gold.
What win rate should I expect?
My log won sixty percent, but ten trades is too small a sample to promise anything. Expectancy matters more than win rate: at two R wins and one R losses, it stays profitable down to a thirty-four percent win rate. Track your own log for thirty trades first.
Does the three bar reversal work in a ranging market?
No. It needs a sustained move into a tested level. In a range there is no move to reverse and no level to reverse from — the apex bar is just a pause, the trigger bar just noise. Two of my four losers were range trades. Trade it at levels, after a move, or not at all.
How is it different from an engulfing pattern?
An engulfing pattern is two candles: the second candle’s body covers the first. The three bar reversal adds the apex bar, forcing the market to make a new extreme and fail to hold it before the trigger confirms. That extra bar is the whole edge: it filters out half the engulfing signals that print in the middle of nowhere.
Risk disclaimer: Trading leveraged products on a funded account carries a high level of risk and can result in the loss of your evaluation fee and account. This article describes my own test on a simulated funded account, for education only, not financial advice. Read your firm’s current rulebook before trading a new pattern.



