I lost a $50,000 challenge account to a screenshot: EUR/USD pressed hard against the lower Bollinger Band. Every instinct screamed oversold — buy the bounce. So I bought, 0.75 lots, on an account with a 5% daily loss limit. The band kept walking lower. I bought again at the next tag, convinced the bounce was overdue. Forty minutes later I closed everything manually, down $2,900 — past my own daily stop and one bad decision away from the firm’s limit.
In this article
- What Bollinger Bands Actually Measure (And What They Do Not)
- The Formula, in Plain English
- My Prop-Firm Settings Preset: 20, 2.0, and When to Change Them
- How to Read the Signals: Squeezes, Walks, Tags and Reversals
- I Tested It: One Full Week on a ,000 Challenge Account
- The Mistakes That Nearly Cost Me the Account
- How Bollinger Bands Fit Inside Prop Firm Rules
- Frequently Asked Questions
The embarrassing part is that the indicator was right and I was wrong. Price touching the lower band is not a buy signal — the real setup was the squeeze that had printed three hours earlier, which I never even saw because I only looked at the bands when price was already at their edge.
This is the guide I wish someone had handed me before that afternoon: what bollinger bands for prop firm traders actually measure, the settings I use on challenge accounts, how to read squeezes, walks and tags, a full week of real trades with drawdown maths, and the mistakes that breach accounts faster than any news event.
What Bollinger Bands Actually Measure (And What They Do Not)
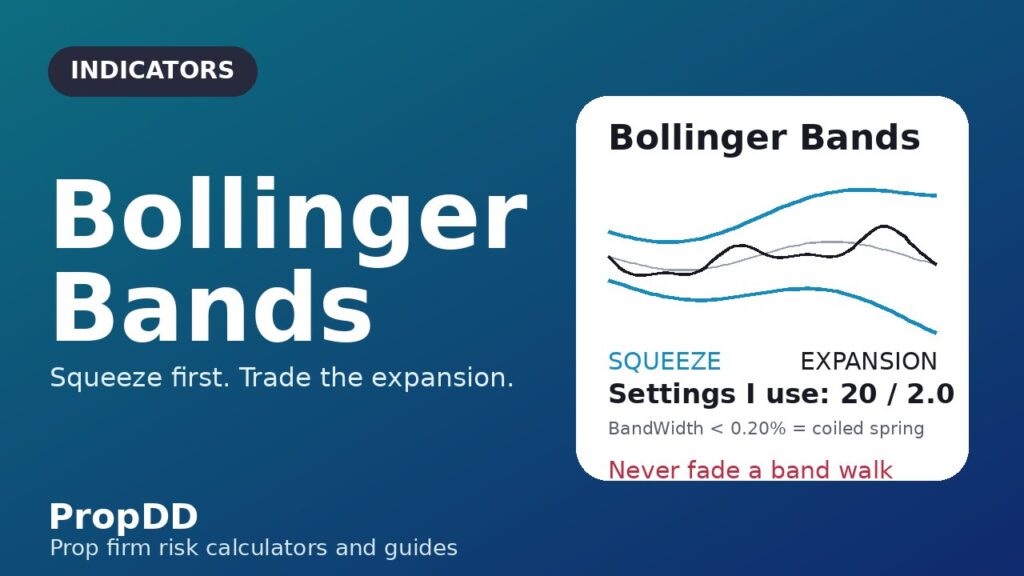
Strip away the colours and Bollinger Bands are three lines: a 20-period simple moving average in the middle, and two outer bands that sit two standard deviations of price above and below it. That is the whole instrument. They are a live picture of volatility around the average — when the market goes quiet, the bands pinch together; when it wakes up, they stretch apart.
What they do not measure is just as important for a funded trader. The bands say nothing about direction. In a strong trend, price can ride the upper band for an entire session — traders call this band walking — and every counter-trend sale against it gets run over. That was my $2,900 lesson.
They also do not give you timing. A squeeze says volatility is compressed and an expansion is likely — never which way. Your entries still need a trigger: a candle close outside the band, a retest of the midline, a failure swing. That trigger is where your stop loss gets its distance from.
The Formula, in Plain English
You do not need to calculate the bands by hand — your platform does it — but knowing the maths is what separates using an indicator from worshipping it. Each component does one job:
Middle Band = SMA(20) — the simple moving average of the last 20 closing prices. This is the market’s short-term “fair value” line.
Upper Band = SMA(20) + (2 × Standard Deviation of the last 20 closes)
Lower Band = SMA(20) − (2 × Standard Deviation of the last 20 closes)
%b = (Price − Lower Band) ÷ (Upper Band − Lower Band) — shows exactly where price sits inside the channel. 1.0 = touching the upper band, 0 = touching the lower, 0.5 = riding the middle. Values above 1 or below 0 mean price has closed outside the bands.
The two numbers you control are the period (20) and the multiplier (2.0). Statistics says that with two standard deviations, roughly 89–90% of closes should fall inside the bands — which is why a close outside them is genuinely notable. But prices are not normally distributed: during trends and news spikes, closes can live outside the bands for hours. The formula is honest about that; most traders using it are not.
Two companion readings come free with the bands. %b shows where price sits inside the channel: a reading of 1 means the upper band, 0 the lower, 0.5 the middle. BandWidth turns “the bands look narrow” into a number you can compare against the last six months. I will not take a squeeze trade unless BandWidth is at one of its lowest readings of the last 120 days — eyeballing it is how you talk yourself into mediocre setups.
For a deeper dive into the indicator’s origin and John Bollinger’s own 22 rules for using it, the Tradingsim Bollinger Bands guide is one of the better free explanations online.
My Prop-Firm Settings Preset: 20, 2.0, and When to Change Them
After two years of challenge accounts I run almost everything at the standard 20-period, 2.0 standard deviations. The reason is unglamorous: those are the settings everyone else is watching, so the bands become a self-fulfilling map of where the crowd expects reactions. On a prop account, where the goal is boring consistency and not cleverness, I want the version of the indicator that the most participants are trading off.
There are exactly three situations where I change the preset, and each change has a rule attached so I cannot fiddle with settings mid-session when I am emotional:
| Situation | My settings | Why |
|---|---|---|
| Default intraday on H1 / M15 (95% of my challenge trading) | 20, 2.0 | Standard crowd levels; tight enough to time entries, calm enough to avoid chop on M15 |
| Fast scalping on M5 during London open | 10, 1.9 | Shorter period reacts to quick volatility shifts; slightly lower multiplier keeps bands tradable on small swings |
| Daily / H4 swing entries on funded accounts | 20, 2.5 | Wider multiplier filters the fake tags that H4 noise produces; fewer signals, higher quality |
| Gold (XAUUSD) — always | 20, 2.0, on H1 only | Gold’s ATR is so large that anything below H1 is unreadable; I size with the Tools page calculator |
The non-negotiable rule: settings get chosen before the session, never during it. Tweaking the multiplier after two losers to “make the bands fit better” is curve-fitting in real time, and it is one of the fastest ways to turn a normal losing day into a drawdown breach. If you find yourself reaching for the settings panel, close the platform for twenty minutes instead.
How to Read the Signals: Squeezes, Walks, Tags and Reversals
Everything the bands can tell you reduces to four reads. I keep this table open on a second screen until each pattern is muscle memory:
| Signal | What you see | What it means for a prop account | My rule |
|---|---|---|---|
| The Squeeze | Bands pinch to their narrowest in weeks; BandWidth at a 120-day low | Volatility is compressed — a sharp expansion is building, direction unknown | Do not predict; wait for the first candle to close outside the band, then enter on the retest of the broken edge with a stop inside the band |
| The Band Walk | Price rides the upper (or lower) band for many candles; %b stays near 1.0 (or 0) | Strong trend with momentum — fading it is the single most expensive habit on challenge accounts | Only take pullback entries toward the middle band in the walk’s direction; never counter-trade a walk |
| The Tag | A single candle touches or closes just outside a band | Price is statistically stretched — but stretches continue, especially after news | A tag alone is never an entry; it is an alert to look for a failure swing or rejection candle |
| The M / W Reversal | Price tags the upper band, pulls back, tags it again without closing beyond it (an “M”); mirror image at the lower band (a “W”) | Momentum is failing — the highest-probability reversal setup the bands produce | Enter on the second shoulder breaking its low (for an M), stop above the band tag, target the middle band first |
Let me give you the squeeze in concrete numbers. On EUR/USD H1, a normal BandWidth reading is around 0.35%–0.50% of price. When it prints below 0.20% — a handful of times a month, usually ahead of the New York open after a flat Asia session — I treat the next 2–3 hours as coiled. The trigger: the first H1 candle closing fully outside either band, then a retest where the broken edge holds. Stop goes back inside the bands; on EUR/USD that is typically 25–40 pips, which keeps the risk arithmetic clean.
The band walk deserves one more warning because it is where most band-based accounts die. When price is walking the upper band, your brain will keep offering you “overbought” reasons to sell. All of those can be true while price walks the band for another 80 pips. In a challenge account, fading a band walk is not a trading decision — it is a drawdown decision, because every counter-trend position you add is stacking risk against a market that has told you exactly what it is doing.
I Tested It: One Full Week on a $50,000 Challenge Account
Theory is cheap, so here is a real week — five trading days, one account, $50,000 starting balance, 5% daily loss limit ($2,500), 10% max overall loss, 8% profit target. My personal daily stop was set at 1.5% ($750), well inside the firm’s limit, because a funded account is a survival game first. Every trade below was taken on EUR/USD H1 using the 20/2.0 bands with the squeeze-and-retest trigger only. No other strategy, no discretion beyond the rules.
Position size = Personal Daily Risk ÷ (Trades Planned × Stop Distance in $ per lot)
Example: $750 ÷ (3 trades × $250 stop per standard lot) = 1.00 lot per trade. I never risked more than one-third of my daily stop on any single trade, so three consecutive full stops still left me at −1.5%, not −4.5%.
| Day | Setup | Entry / Stop | Risk | Result | Account |
|---|---|---|---|---|---|
| Mon | Squeeze before NY open, BandWidth 0.18% | Buy retest of broken upper band / 32-pip stop | $320 (0.64% of acct) | +1.8R → +$576 | $50,576 |
| Tue | Band walk up after CPI — no entry (fading rule) | No trade taken | $0 | Skipped; price walked +90 pips | $50,576 |
| Wed | Lower-band W reversal at H1 support | Buy second shoulder break / 28-pip stop | $280 (0.55%) | −1R → −$280 | $50,296 |
| Thu | Squeeze into London open, BandWidth 0.21% | Sell retest of broken lower band / 30-pip stop | $300 (0.60%) | +2.2R → +$660 | $50,956 |
| Fri | Midline rejection in downtrend (%b 0.5 touch) | Sell at middle band / 26-pip stop | $260 (0.52%) | +1.5R → +$390 | $51,346 |
The week: 4 trades, 3 wins, +$1,346 (+2.7%), and the biggest single-day drawdown was $280 — barely a tenth of the firm’s daily limit. But notice Tuesday. Skipping a trade is invisible in a results table, yet that skip is worth more than the $1,346: had I faded the post-CPI band walk, two or three counter-trend stops — roughly $700–$900 — would have turned a winning week into a flat one with dented psychology. The indicator did not make me money that day; the rule attached to it did.
I did not invent these numbers on the fly each morning. My pre-session routine is to plug the day’s balance and stop distances into the Max Daily Drawdown calculator on our Tools page and write the lot sizes on a sticky note before the first candle. My walkthrough of the daily drawdown calculator covers exactly how I do it. When the bands signal and the maths is already done, all that is left is execution — and execution is the part a calm trader gets right.
The Mistakes That Nearly Cost Me the Account
Every row below is a mistake I have personally made on a real evaluation.
| Mistake | Why it feels smart | What it actually does to a prop account |
|---|---|---|
| Buying every lower-band tag as “oversold” | The band is a statistical extreme, so a bounce feels due | In trends, tags repeat while price keeps falling — this was my −$2,900 afternoon. Tags are continuation clues, not entries. |
| Trading the squeeze before it resolves | “Volatility is coming, so I should be positioned early” | The squeeze has no direction; guessing burns one of your three daily bullets before the real move starts. |
| Widening the multiplier after two losers | Fewer, “cleaner” signals feel like the fix | Curve-fitting live: you are redesigning the map because you dislike the territory. Keep 20/2.0 and fix your entries. |
| Holding through high-impact news with a band-based stop | The stop was “technically placed” at the band edge | News spreads and slippage turn a 30-pip technical stop into an 80-pip fill — one event can take 2–3% of the account. My news trading and daily drawdown guide has the exact blackout windows I use. |
| Stacking three positions into one squeeze breakout | Conviction is high, so size should be too | One false breakout now costs 3× your planned risk. Floating losses on correlated positions count toward the daily limit long before you admit the trade failed. |
How Bollinger Bands Fit Inside Prop Firm Rules
An indicator is only as good as its compatibility with your rulebook, and this is where the bands earn their place on a challenge account. First, they are a volatility filter: when BandWidth is bloated after news, my rule is to halve position size, because the same setup now carries a stop twice as wide in pip terms. The indicator literally shows you when your normal size has become abnormal risk.
Second, the bands play well with the consistency rule. Squeeze breakouts produce one or two clean winning days followed by quiet ones — the opposite of the one-giant-day profile that consistency rules punish. My best pass ever had a biggest single day of 1.9% and still cleared 8% in three weeks. If you have not modelled how your best-day percentage accumulates, read my breakdown of the prop firm consistency rule before your next evaluation.
Third, the bands give you a built-in session filter. The squeeze forms most reliably in the dead hours between the Asia close and the London open, and the resolution usually arrives with the volume. That means most of your band trading happens in one focused window instead of scattered across the day — which directly attacks the overtrading that kills more evaluations than bad strategy ever will.
None of this makes the bands a system on their own. They are a lens for volatility and a timing aid for entries. The system is still the boring part: fixed fractional risk, a personal daily stop below the firm’s limit, no news gambling, and a journal that records BandWidth next to every trade.
Frequently Asked Questions
Are Bollinger Bands enough to pass a prop firm challenge on their own?
No. The bands describe volatility and flag stretched prices — they do not manage risk, set your daily stop, or keep you out of news. I treat them as one component: bands for timing, a fixed-fraction risk rule for sizing, and a personal daily stop for survival.
What are the best Bollinger Band settings for a prop firm challenge?
Start with 20-period, 2.0 standard deviations on H1 and M15 — the standard everyone watches, so the levels carry the most weight. I only deviate to 10/1.9 for fast M5 scalping at the London open, or 20/2.5 for H4 swing entries on funded accounts. Pick the preset before the session, never after a loss.
Why do I keep losing when I buy the lower band and sell the upper band?
Because a band tag is not a reversal signal. In trends, price can tag the same band repeatedly while continuing — the band walk — and every counter-trade gets run over. The reliable reversal setup is the M/W pattern: price tags the band twice without closing beyond it, showing momentum is failing.
How do I size positions with Bollinger Bands under a 5% daily drawdown limit?
Take your personal daily stop (mine is 1.5%, well under the firm’s 5%), divide by planned trades, then divide by the stop distance in dollars per lot. A $750 daily stop, 3 planned trades and a $250 stop per lot means $250 risk per trade — three full stops still cost only 1.5%, not the account.
Should I trade Bollinger Band signals through high-impact news?
No. Spreads widen and slippage turns a 30-pip band-edge stop into an 80-pip fill — one event can take 2–3% of the account on a “technically correct” setup. Stay flat through red-folder events.
What is the difference between %b and BandWidth?
%b shows where price sits inside the channel right now: 1.0 = upper band, 0 = lower, 0.5 = the middle. BandWidth shows how wide the channel is relative to history — I use it to qualify squeezes and %b to read how stretched an individual entry is.
Risk disclaimer: trading involves substantial risk of loss and is not suitable for every investor. Prop firm evaluations add specific rule-based risks — including daily loss limits and maximum drawdown breaches that can terminate an account — on top of normal market risk. This article describes my personal approach for educational purposes and is not financial advice. Never trade with money you cannot afford to lose, and always read your firm’s current rulebook before buying a challenge.




18 comments
[…] is the discipline that kept divergence from becoming a prediction. If you run RSI signals, keep my Bollinger Bands guide open beside it: the squeeze tells you when volatility is about to expand, and the RSI tells you […]
[…] its job: four mid-range crosses, all whipsaws, all ignored. If you run the Stochastic, keep my Bollinger Bands guide open beside it — bands mark the range edges, the Stochastic times the turn at those edges, and […]
[…] and the picture sharpens. RSI (my RSI guide) measures how stretched price is; Bollinger Bands (my Bollinger guide) measure volatility expansion. MACD measures neither — it measures momentum direction and […]
[…] too — that distinction is what turns the indicator from decoration into a risk tool. My Bollinger Bands guide covers the statistical cousin; this one is about the volatility-adjusted […]
[…] has in 20 bars. Fading that is fading momentum itself. If you want a channel for reversals, read my Bollinger Bands guide instead — this one is for riding the break, with the exit rules to […]
[…] indicator compares two volatility bands I already trade with: Bollinger Bands and Keltner Channels. Bollinger Bands expand and contract with the market’s own standard […]
[…] contrast with the channel family, KVO also pairs differently from envelope indicators. Bollinger Bands measure price volatility around a moving average, while KVO measures participation behind the price […]
[…] from where it has typically traded. It is distinct from the indicators I have already covered here. Bollinger Bands use standard deviation to draw bands around price, which is about volatility, not about stretch as […]
[…] from one that passes only one, and on a funded account I only take the trades that pass both. The Bollinger Bands guide is the other neighbour worth knowing: a Bollinger squeeze is the same quiet-market condition seen […]
[…] the max daily drawdown calculator wherever the daily limit is in play. If you already read the Bollinger Bands guide on this site, this is the companion piece: that guide is about where price sits inside the bands, […]
[…] the max daily drawdown calculator wherever the daily limit is in play. If you already read the Bollinger Bands guide on this site, this is the companion piece that turns those three lines into a single readable […]
[…] deviations — but they draw lines on the price chart, while the Z-score prints a single number. My Bollinger Bands guide covers the lines; this article covers the number. And my BandWidth guide measures how wide those […]
[…] is also worth saying plainly what KST is not. It is not a volatility indicator like Bollinger Bands, it is not a volume indicator like Chaikin Money Flow, and it is not a trend-following average like […]
[…] is the latest breakout indicator in the series on this site, beside the MACD guide, the Bollinger Bands guide and the TTM Squeeze guide. If you already trade with MACD or Bollinger Bands, this article will […]
[…] tools, and the SSL Channel needs to earn its place against them rather than repeat them. Against Bollinger Bands, the difference is the width calculation: Bollinger bands are set by standard deviation around a […]
[…] it by comparing two channel indicators that I have already covered separately on this site. The Bollinger Bands expand and contract with standard deviation, which is how far price has actually moved. The Keltner […]
[…] the morning’s normal costs put me close enough to it that stopping is the correct trade. The Bollinger Bands guide taught me the same lesson from the other side: bands stretch in trends too, and the indicator is […]
[…] key word is fixed. Unlike Bollinger Bands, whose bands widen and narrow as volatility changes, envelope bands stay parallel to the moving […]