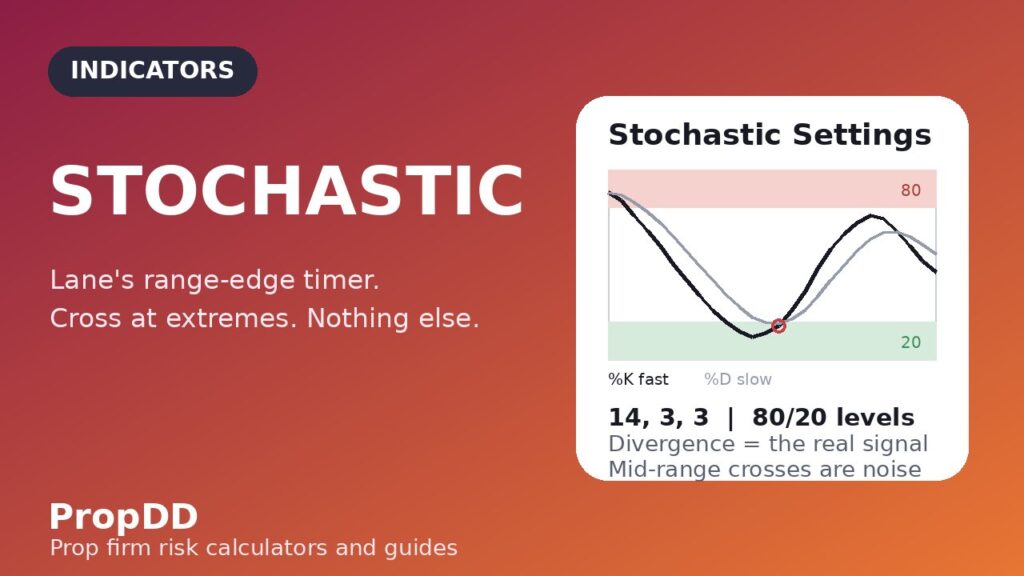
I lost $1,860 in one afternoon trading fourteen Stochastic signals that never existed. It was a Tuesday in October, GBP/USD was grinding higher on a genuine trend day, and my Stochastic kept doing what it is built to do: %K crossing below %D, dipping under 80, “overbought, sell it,” crossing back up, “bullish, buy it.” I sold the first cross. The market climbed 40 pips. I bought the recross. It fell 30 pips — the cross that “confirmed” my first idea. By the third round trip I had stopped counting crosses and started counting damage: six trades, every one faded, account down $1,860, personal daily stop shattered before lunch.
In this article
- What the Stochastic Actually Measures (And What It Pretends To)
- The Formula, in Plain English: %K, %D and the 14,3,3
- My Prop-Firm Settings Preset: 14,3,3, and the Three Times I Change It
- Reading the Signals: Crosses, Divergences and Lane's Bull/Bear Setups
- I Tested It: One Full Week on a ,000 Challenge Account
- The Mistakes That Nearly Cost Me the Account
- How the Stochastic Fits Inside Prop Firm Rules
- Frequently Asked Questions
That evening I finally read George Lane’s own notes on the indicator he invented in the 1950s. One line reframed everything: the Stochastic is a range instrument. Lane designed it to find the edges of sideways markets, not to time trend days — and he considered divergence, not the crossover, the real signal. I had been using a ruler as a hammer all afternoon. This guide is the Stochastic for prop firm traders I wish I had read before that Tuesday: what it actually measures, the formula without the fog, the 14,3,3 preset I run on every challenge account, the signals worth trading and the ones worth deleting from your brain, a full week of real trades with the drawdown maths attached, and how this indicator fits inside the rules that end accounts.
What the Stochastic Actually Measures (And What It Pretends To)
George Lane built the Stochastic on one observation about how prices move: in an uptrend, candles tend to close near the top of their range; in a downtrend, near the bottom. The indicator simply asks, on a 0–100 scale, where is the current close sitting inside the recent high-low range? A reading of 88 means the close is near the top of the last 14 candles’ range. A reading of 12 means it is hugging the bottom. That is the whole measurement — position within the range, nothing else.
This is why the Stochastic behaves so differently from the RSI on my charts. The RSI measures how hard price is moving; the Stochastic measures where the close lands inside the recent range. On choppy, sideways days the Stochastic is the better tool — it was purpose-built for exactly that environment. On trend days it pins at the extreme and stays there, which is information, not a trade: a pinned Stochastic is a regime label telling you the market is trending, not a counter-trade signal. My $1,860 Tuesday was six failed attempts to trade against that label.
Lane’s famous line — momentum changes direction before price — is the real reason this indicator earns a place on a challenge account. %K is jumpy by design; when it starts curling while price is still making higher highs, momentum is quietly leaving the building. That early curl, especially at the extremes, is the warning that matters. Everything else the Stochastic prints is decoration.
Because the Stochastic is a range instrument, it belongs next to a range strategy, not a trend one. My range fade strategy guide describes the exact ranging setup I pair it with.
The Formula, in Plain English: %K, %D and the 14,3,3
You will never hand-calculate the Stochastic, but its three inputs explain every behaviour you will ever see from it. Lane’s recipe: find where the close sits in the recent range (%K), then smooth it twice.
%K = 100 × (Close − Lowest Low of 14) ÷ (Highest High of 14 − Lowest Low of 14) — the raw position of the close inside the 14-candle range. Close at the top of the range gives 100; at the bottom, 0.
Slow %K = 3-period moving average of %K — the first smoothing, which tames the raw line’s jumpiness.
%D = 3-period moving average of Slow %K — the second smoothing, your signal line. The classic “14,3,3” is just these three numbers: 14-candle range, 3-period %K smoothing, 3-period %D smoothing.
Fast vs slow — “fast stochastic” skips the first smoothing (14,1,3). It is twitchier and nearly unusable on intraday charts; always run the slow version on a prop account.
Three consequences fall out of the maths, and each one protects a challenge account. First, the indicator is range-bound by construction: it can never exceed 100 or drop below 0, so unlike price it always has a ceiling and a floor. Second, the high-low lookback means one violent spike candle contaminates the reading for the full 14 periods — after a news spike, the range stretches and the Stochastic goes numb for hours. Third, the 50 line is the real centre: a close pinned in the top half of its range is bullish behaviour even without an extreme reading, and I use 50 as a bias filter — long setups only when %D holds above 50, shorts only below it.
For the indicator’s formal documentation, the AAII Stochastic Oscillator reference walks through the %K/%D construction with worked examples.
My Prop-Firm Settings Preset: 14,3,3, and the Three Times I Change It
On every challenge account I run the slow Stochastic at 14,3,3 with 80/20 levels, and I change that only by rule, never by mood. The Stochastic uses 80/20 rather than the RSI’s 70/30 because its formula pushes readings to extremes more aggressively — Lane’s standard bands are wider on purpose. A custom-tuned 9,2,2 might feel sharper, but sharper is what generated fourteen fake signals on my worst afternoon.
| Situation | My settings | Why |
|---|---|---|
| Default intraday on H1 / M15 (95% of my challenge trading) | 14,3,3 — 80/20 levels | Lane’s design; double smoothing filters the chop that kills evaluations |
| M5 scalping on the London open | 5,3,3 — 80/20 levels | Shorter lookback reacts to fast range rotations; keep the wide levels to filter noise |
| H4 / Daily swing entries on funded accounts | 21,7,7 — 80/20 levels | Longer smoothing shows only the major range-edge turns; far fewer, far cleaner signals |
| Pairs stuck in tight ranges (Asian session majors) | 14,3,3 — 80/20, plus the 50-line bias filter | Narrow ranges produce constant crosses; the 50 line keeps you on the right side of the box |
The rule I apply to every indicator holds here too: settings are chosen before the session and locked during it. If you are reaching for the inputs panel after two losers, the problem is your trigger discipline, not your parameters. One more prop-specific habit: I never shorten the lookback below 14 on a challenge account. The shorter the lookback, the more crosses print, and crosses are the currency that buys drawdown.
Reading the Signals: Crosses, Divergences and Lane’s Bull/Bear Setups
The Stochastic prints five reads worth your attention. Lane ranked them himself — and the crossover, the signal most traders trade first, was not his favourite.
| Signal | What you see | What it means | My prop-account rule |
|---|---|---|---|
| Crossover at the extremes | %K crosses above %D below 20 (bullish) or below %D above 80 (bearish) | Momentum is turning at a stretched range edge | Only trade crosses that happen inside the 80/20 extremes. Crossovers in the middle of the range are noise — this single filter deletes most losing signals. |
| Bullish divergence | Price makes a lower low; %D makes a higher low | Closes are landing higher inside the range even as price dips — selling pressure is fading | Lane’s strongest signal. Enter on the right-hand crossover back above 20; never on the divergence alone. |
| Bearish divergence | Price makes a higher high; %D makes a lower high | Closes are landing lower inside the range while price pushes up — buying pressure is fading | Take profit on half of longs; short only after %K crosses below %D under 80 with a price rejection candle. |
| Lane’s bull setup | %D bottoms below 10–15, curls up, %K crosses above %D — price makes a lower low at the same time | Deep oversold washout with momentum turning first | My highest-conviction Stochastic entry. Stop goes below the washout low — a real invalidation line, so sizing maths is clean. |
| Lane’s bear setup | %D tops above 85–90, curls down, %K crosses below %D — price makes a higher high at the same time | Deep overbought blowoff with momentum turning first | Same invalidation logic mirrored. Skip it entirely on strong trend days when %D pins above 85 for hours. |
The “right-hand crossover” deserves a sentence because it is the timing detail everyone skips. Lane wanted the %D line to have already bottomed and started curling — the right-hand side of its valley — before %K crosses it. A cross while %D is still falling is a guess; a cross after %D turns is a confirmation. On my charts I simply require the cross to happen with %D’s slope already pointing my way. That one condition cut my false crosses roughly in half.
Compare the Stochastic honestly with its cousin before you commit to it: my RSI guide covers where the RSI beats it (trend days, momentum regimes) and where the Stochastic wins (ranges, early turns). I run both on challenge accounts — the RSI for the trend regime, the Stochastic for the range regime — and the 50-line on each keeps me from mixing them up.
I Tested It: One Full Week on a $50,000 Challenge Account
Theory is cheap, so here is the week I ran the Stochastic exactly as described above — slow 14,3,3 on H1, extremes-only crosses, Lane setups, right-hand crossovers required, and absolutely no trading of crosses on trend days. Account: $50,000, 5% daily loss limit ($2,500), 10% max overall loss. My personal daily stop sat at 1.5% ($750), and my rule was one-third of that per trade maximum.
Position size = (Personal Daily Stop ÷ 3) ÷ (Stop Distance in pips × Pip Value per lot)
Example: ($750 ÷ 3) ÷ (24 pips × $10 per pip on EUR/USD) = $250 ÷ $240 ≈ 1.00 lot. The stop sits behind the signal’s invalidation point — for Lane’s bull setup, below the washout low — so the maths is done before the entry, never after.
| Day | Signal | Entry / Stop | Risk | Result | Account |
|---|---|---|---|---|---|
| Mon | Bearish divergence on EUR/USD; %K crossed below %D at 82 with a rejection candle | Short on the cross / 22-pip stop | $220 (0.44%) | +1.6R → +$352 | $50,352 |
| Tue | %D pinned above 85 on GBP/USD all session — trend day, regime label | No entry (no fading a pinned Stochastic) | $0 | Skipped; the trend ran +140 pips without me | $50,352 |
| Wed | Lane’s bull setup on GBP/USD: %D bottomed at 12, curled, right-hand cross | Long on the cross / 26-pip stop below the washout low | $260 (0.52%) | +2.1R → +$546 | $50,898 |
| Thu | %K/%D crosses printed 4 times mid-range on USD/JPY — noise | Skipped (crosses in the middle of the range) | $0 | Skipped; every cross whipsawed | $50,898 |
| Fri | Bear setup on USD/JPY: %D topped at 88, curled down, right-hand cross | Short on the cross / 24-pip stop | $240 (0.48%) | −1R → −$240 | $50,658 |
The week: 3 trades, 2 wins, +$658 (+1.3%), biggest single-day drawdown $260. The money is in the two skipped days. Tuesday’s skip is the one my old self would have turned into a −$1,860 afternoon — the pinned-Stochastic fade. Thursday’s skip is the extremes-only filter doing its job: four mid-range crosses, all whipsaws, all ignored. If you run the Stochastic, keep my Bollinger Bands guide open beside it — bands mark the range edges, the Stochastic times the turn at those edges, and together they are the cleanest range-trading pair I have on a challenge account.
I pre-size every session before the first candle using the Max Daily Drawdown calculator on the Tools page — balance in, personal stop out, lot sizes written on a sticky note. When the Stochastic prints a Lane setup and the maths is already done, execution becomes boring — and boring is what passes challenges.
The Mistakes That Nearly Cost Me the Account
Every row below cost me real evaluation fees before I fixed it. The Stochastic punishes misuse faster than most indicators because it is so sensitive.
| Mistake | Why it feels smart | What it actually does to a prop account |
|---|---|---|
| Trading every %K/%D crossover | Fourteen signals a day feels like fourteen chances | Mid-range crosses are noise — this was my −$1,860 afternoon. Extremes-only crosses or nothing. |
| Fading a pinned Stochastic on trend days | “88 is extreme, the turn must come” | A pinned reading is a regime label, not a sell signal. Trends pin the Stochastic for entire sessions while price runs without you. |
| Using 70/30 levels borrowed from the RSI | Familiar numbers feel safe | The Stochastic pushes to extremes harder than the RSI — 70/30 prints twice the false “extreme” signals. Lane’s 80/20 exists for a reason. |
| Running the fast Stochastic (14,1,3) intraday | Faster = earlier entries | The unsmoothed %K whipsaws through %D constantly; false signals cluster and chew through the daily limit. Slow version only. |
| Trading divergence without the crossover trigger | “The divergence is confirmed, price will follow” | Divergence is a warning, not an entry — wait for %D to curl and %K to cross on the right-hand side. Early entries burn bullets on smoke. |
How the Stochastic Fits Inside Prop Firm Rules
The Stochastic earns its place on a challenge account for three reasons, and all three are about the rules, not the chart. First, the extremes-only filter produces few trades — two or three genuine setups a week per pair. That scarcity is a feature under consistency rules: my best challenge passes never had a day above 2.5%, because the Stochastic simply does not generate the one-giant-day profile that consistency rules punish. If you have not modelled your best-day percentage, my breakdown of the prop firm consistency rule shows the maths.
Second, the Stochastic is honest about its own habitat. It tells you, via a pinned reading, that the market is trending — your cue to stand down rather than fight. Most blown challenge accounts died from trading the wrong tool in the wrong regime, and an indicator that waves a flag saying “not my weather, sit out” is worth more than any entry signal.
Third, Lane’s setups come with built-in invalidation — the washout low, the blowoff high — which means every trade has a real stop line before you size it. Convert the signal’s stop distance into lot sizes that fit under a personal daily stop, using the same routine I run before every session. The Stochastic does not need to be a system; it needs to be a range-edge timer with an invalidation point and honest maths.
Frequently Asked Questions
Is the Stochastic better than the RSI for prop firm trading?
Neither is better — they measure different things. The RSI measures how hard price is moving (trend and momentum regimes); the Stochastic measures where the close sits inside the recent range (range edges and early turns). I run the RSI on trend days and the Stochastic on range days, and I never mix their signals.
Why does my Stochastic stay above 80 for hours?
Because the market is trending, and the formula is doing its job: closes keep landing near the top of the rolling range. Treat a pinned Stochastic as a regime label — stand down or trade with the trend — never as a counter-trade signal.
What is the best Stochastic setting for a prop firm challenge?
Slow Stochastic 14,3,3 with 80/20 levels on H1 or M15. Keep defaults so you are reading the same levels the rest of the market watches, and never shorten the lookback below 14 on a challenge account — shorter settings multiply the false crosses that eat daily drawdown.
Should I trade every %K and %D crossover?
No — that is the fastest way to donate your evaluation fee. Only trade crosses that happen inside the 80/20 extremes, ideally with %D already curling on the right-hand side of its turn. Mid-range crosses are noise and should be ignored completely.
Can the Stochastic alone pass a prop firm challenge?
No. It is a range-edge timer with built-in invalidation — it tells you when momentum is turning at a stretched edge and where your stop belongs. It does not manage your daily stop, your consistency profile, or your news exposure. Pair it with fixed fractional risk and a personal daily stop below the firm’s limit.
Does the Stochastic work on gold (XAUUSD)?
It works, but gold’s violent spikes stretch the 14-candle range and numb the indicator for hours. Use the 21,7,7 swing preset on H1, demand a Lane setup rather than a plain cross, and size gold smaller than forex pairs.
Risk note: indicators describe the past; they do not predict the future. Nothing here is financial advice. Never risk money you cannot afford to lose, and always trade inside your prop firm’s published rules.




15 comments
[…] gives you two lines and a crossover ritual, %R gives you one line and a positional read. My Stochastic guide covers the two-line version; the pair works best with distinct jobs: %R for the fast hook, […]
[…] back below 80 (the “hook”) before doing anything, exactly like the hook rule in my Stochastic guide. Same discipline at the 20 line for […]
[…] that with Stochastic, which flattens in a range and fires crosses every few candles. DeMarker’s 0.3/0.7 structure […]
[…] indicator yet, my RSI for prop firm traders guide covers the RSI mechanics this one assumes, and my Stochastic oscillator guide covers the %K/%D cross logic you will reuse […]
[…] single-timeframe trap is how most traders get hurt by this indicator’s cousins: RSI and Stochastic both watch one window, so both can sit overbought or oversold for days in a trend. The Ultimate […]
[…] up closes with average down closes over fourteen periods, which is a measure of exhaustion. My Stochastic guide compares the close with the recent high-low range, which is a measure of position inside the range. […]
[…] and even then the action is to tighten a stop, not reverse a position. Compare this with my Stochastic guide: Stochastic divergence works the same way, but its 0 to 100 scale hides whether the balance itself […]
[…] family as a whole, the True Strength Index guide shows a different smoothing philosophy, and the Stochastic guide shows what happens when an oscillator is allowed to stay fast. Laguerre RSI is the patient […]
[…] is a pattern I have now seen across nearly every oscillator covered in this series, from RSI to Stochastic to MACD: the oscillator finds candidates, the rules decide which ones get money. Fisher’s […]
[…] I trade. Two related indicators already covered on this site are worth distinguishing here. The Stochastic oscillator measures the close from the low, so it can park below 20 for days in a downtrend and keep flashing […]
[…] gains with average losses in closes only, so it reacts to every close and whipsaws in a range. Stochastic measures where the close sits inside the recent high-low range, so it saturates quickly in a trend. […]
[…] when momentum shifts. This guide is written for the trader who already uses the MACD guide or the Stochastic guide on this site and wants to understand what the STC adds, and what it does not. It covers what the […]
[…] jumpier and better for spotting extremes, QQE is steadier and better for entries. Against the plain Stochastic, the QQE has no 0-100 bounded cross of two lines; its signal is a cross against a moving trailing […]
[…] %K and %D crossovers in a range; see my Stochastic guide […]
[…] the COG is simpler: no cycle-length estimation, just a weighted average of closes. Against Stochastic, which measures where the close sits inside the recent high-low range, the COG measures the balance […]