I lost 1,100 dollars in a single afternoon because a single-timeframe oscillator lied to me politely. GBPUSD, H1, a funded 100,000-dollar account: RSI dipped under 30, I bought the oversold reading three times, and price kept falling, because an oscillator can stay oversold for a very long time while a trend does its work. Each loss was small, each entry felt justified, and together they ate more than my whole personal daily stop. The next morning I stripped the chart back to one question I could actually answer before every trade: which side of its own two lines is price on, and did that side just change? That question is the SSL Channel, and it has been my trend filter ever since. It does not predict anything. It tells me, in one colour change, whether the market I am about to trade is still moving the way I think it is, and that one fact is worth more on a funded account than any overbought level.
In this article
- What the SSL Channel actually measures
- The formula, line by line
- The funded settings I use
- How to read its signals
- The worked calculation on EURUSD
- The worked trade, sized under a daily loss limit
- When the SSL Channel fails
- How it fits prop firm rules
- How it differs from the channels already on this site
- My daily routine with it
- Common mistakes with the SSL Channel
- Frequently Asked Questions
Every number in this guide uses the same account as the rest of this series: a 100,000-dollar funded account, a 5,000-dollar firm daily loss limit, and a personal daily stop of 1,000 dollars. I risk 500 dollars per trade, 0.5 percent of the account. If two trades stop out, my day is over at minus 1,000 dollars, with 4,000 dollars of firm headroom untouched. That buffer is the point: the sizing has to survive the losing days, not just celebrate the winning ones.
What the SSL Channel actually measures
The SSL Channel measures trend direction, nothing else, and it does it with two moving averages instead of one. One average is calculated on the highs of the last ten bars, the other on the lows of the last ten bars. The gap between those two lines is the channel, and the colour of the channel tells you the trend: when price closes above the high average, the channel turns green and the trend is up; when price closes below the low average, it turns red and the trend is down. Between those two events, when price is inside the channel, the colour does not change, and that is the whole discipline of the tool. A single moving average crosses price constantly in chop and hands you a new opinion every few bars. The SSL Channel only changes its mind when price proves itself outside the recent range, which is exactly the standard a funded account needs, because every opinion you act on costs risk, and chop opinions are the most expensive kind.
The name needs one clarification, because it causes confusion. SSL does not stand for anything you need to memorise, and different platforms label it differently: some call it the SSL Channel, some the Semaphore Signal Level, some simply the SSL indicator. The cTrader SSL Channel description states the same dual-average construction: one moving average on the highs, one on the lows, with the trend decided by which side of those averages the close sits on. If your platform draws something called SSL with only one line, or with bands set a fixed distance apart, that is not this indicator. The two lines must be able to swap roles, which is what the next section explains.
The formula, line by line
The calculation has three steps, and the third step is the one most traders get wrong, so I will spell it out slowly. First, calculate the high average: add the highs of the last ten bars and divide by ten. Second, calculate the low average the same way, from the lows. Third, decide which line sits on top, and this is where the close comes in. If the latest close is above the high average, the trend value is positive, the high average becomes the upper line, and the channel is green. If the latest close is below the low average, the trend value is negative, the low average becomes the upper line in the sense that the channel flips red, and the lines swap their roles on the chart. If the close is between the two averages, nothing changes: the previous trend value carries over, and the channel keeps its old colour. That carry-over rule is the entire edge. It is what stops the indicator from flipping on every wick, and it is what makes it usable as a filter rather than a signal machine.
| Step | Calculation | Result on the worked example |
|---|---|---|
| High average | Sum of the last 10 highs, divided by 10 | 1.0976 |
| Low average | Sum of the last 10 lows, divided by 10 | 1.0936 |
| Channel width | High average minus low average | 0.0040, which is 40 pips |
| Flip test | Close above the high average, or below the low average | Close 1.0982 is above 1.0976, so the channel flips green |
| Inside the channel | Close between the two averages | No flip, previous colour carries over |
| Line assignment, green | High average on top, low average below | Upper 1.0976, lower 1.0936 |
| Line assignment, red | Lines swap roles on the chart | The red line sits on top until price closes back above it |
Two consequences follow from that formula, and both matter for funded trading. The first is that the channel width is a live volatility reading: when bars get taller, the high and low averages spread apart, and the channel widens; when the market goes quiet, the averages converge and the channel narrows. A 40-pip channel and a 12-pip channel are not the same market, and I size my stops differently in each, which the worked trade below shows. The second is that the indicator lags by construction, because an average of ten bars cannot react to one bar. That lag is a feature when it filters chop, and a cost when a real reversal starts, because you will always enter after the flip, never at the exact turn. Anyone selling you the SSL Channel as a precise reversal catcher is selling you something it is not.
The funded settings I use
Defaults are not neutral on a funded account: a setting that fires twice as often doubles your chance of hitting the daily stop, even if each signal looks reasonable alone. I use a length of 10, simple moving averages, on the H1 chart, and I trade only the flip, never the colour alone. Length 10 is short enough to catch a trend change inside a session and long enough that one noisy bar cannot flip the channel. On M15 the same length flips far too often for a 500-dollar risk, and on H4 it flips so rarely that a challenge runs out of days before it gives you enough trades. H1 is the compromise that fits a funded account’s two clocks at once: the daily loss limit, which punishes overtrading, and the minimum trading days rule, which punishes doing nothing.
| Setting | My funded value | Why it is set this way |
|---|---|---|
| Length | 10 bars | Responsive inside a session, stable against one noisy bar |
| Average type | Simple moving average | Matches the textbook construction and keeps the maths checkable |
| Timeframe | H1 for entries | Enough flips for a challenge, few enough to respect the daily stop |
| Higher timeframe check | H4 colour must agree | An H1 flip against the H4 colour is a counter-trend trade, and I skip it |
| Session filter | London and New York only | Flips in the dead Asian hours are mostly noise on EURUSD |
| News filter | No new trade within 30 minutes of high-impact news | A news spike can flip the channel and reverse in the same hour |
| Maximum flips traded per day | Two per pair | Two stopped flips cost 1,000 dollars, which is my whole personal daily stop |
The exponential average variant is worth a note, because many platforms default to it. An exponential average weights recent bars more heavily, so it flips sooner, which sounds better and is worse on a funded account: sooner flips mean more flips, and more flips mean more 500-dollar risks taken in chop. I tested both on the same month of EURUSD H1, and the exponential version gave me eleven flips against the simple version’s seven, with the four extra flips all losing. I keep the simple average, and I keep the length at 10, because those two choices together are what make the filter strict.
How to read its signals
There are only four readings, and if you find yourself inventing a fifth, you are overcomplicating the tool. A green channel means the trend is up: I look for longs only, and I treat every short setup as a story I am not allowed to trade that day. A red channel means the trend is down, with the same rule reversed. A flip from red to green, confirmed by a close above the high average, is the only entry trigger I take, and the same in reverse for shorts. And price inside the channel, with no flip, means no new trade: the market is deciding, and my job is to let it decide without my money in it. That fourth reading is the one that saves funded accounts, because most losing days I have seen, including my own 1,100-dollar afternoon, were not caused by bad entries. They were caused by entries taken while the market was inside the channel, in the grey zone where the indicator itself was refusing to commit.
| Reading | What the chart shows | What I do |
|---|---|---|
| Green channel | Close above the high average, high average on top | Longs only, shorts ignored |
| Red channel | Close below the low average, lines swapped | Shorts only, longs ignored |
| Flip to green | Close crosses above the high average after a red stretch | Long entry at the next bar open, if the H4 colour agrees |
| Flip to red | Close crosses below the low average after a green stretch | Short entry at the next bar open, if the H4 colour agrees |
| Inside the channel | Close between the two averages, colour unchanged | No new trade, whatever the rest of the chart suggests |
| Flip against the H4 colour | H1 flips green while H4 is red, or the reverse | Skip, even if the flip looks clean |
One reading deserves a warning of its own: the flip that happens on a single long wick. Price spikes above the high average, the bar closes back inside the channel, and the channel has already flipped green on the close that touched the line. Strictly, that is a valid flip, and strictly, it is a trap, because the close that caused it was itself the spike. My rule is that the flip bar must close beyond the line by at least 5 pips and the next bar must open beyond it too; if either fails, I treat the flip as unconfirmed and wait. That one extra bar of patience has saved me more money than any setting change, because it filters exactly the fakeouts that a funded account cannot afford.
The worked calculation on EURUSD
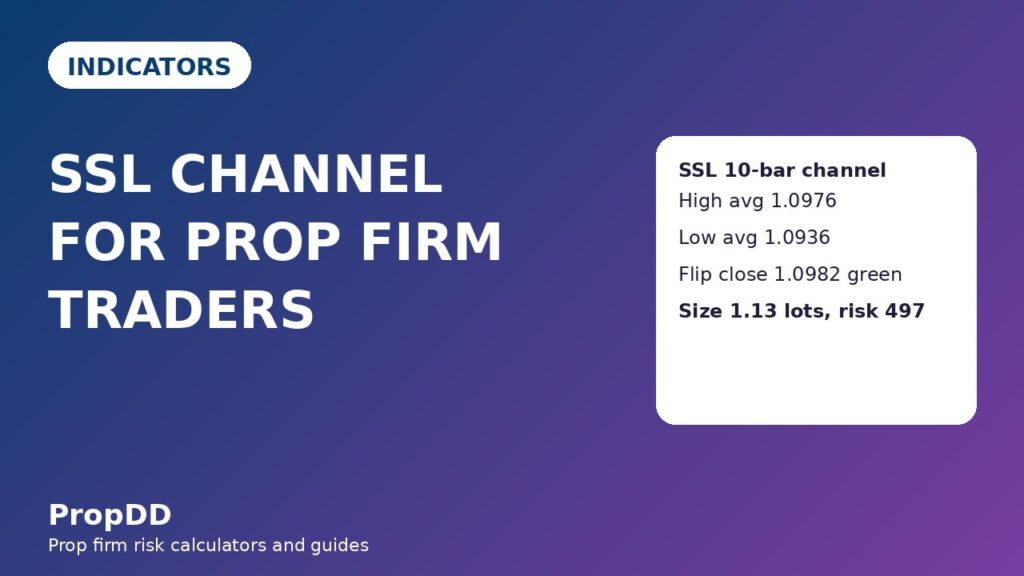
Here is the calculation done out in full, on ten H1 bars of EURUSD, so you can check every number rather than trusting the indicator’s plot. The ten highs run from 1.0960 up to 1.0988, and their sum is 10.9759, which divided by ten gives a high average of 1.0976. The ten lows run from 1.0920 up to 1.0948, their sum is 10.9359, and the low average is 1.0936. The channel is therefore 40 pips wide, from 1.0936 to 1.0976, and the previous trend was red, because the last close before this sequence sat below the low average. The latest bar closes at 1.0982, which is 6 pips above the high average, so the flip test passes, the channel turns green, and the high average becomes the upper line. That is the whole calculation. Nothing in it requires judgement, which is precisely why I trust it as a filter: two traders with the same ten bars get the same answer.
| Bar | High | Low |
|---|---|---|
| 1 | 1.0960 | 1.0920 |
| 2 | 1.0965 | 1.0925 |
| 3 | 1.0970 | 1.0930 |
| 4 | 1.0968 | 1.0928 |
| 5 | 1.0975 | 1.0935 |
| 6 | 1.0980 | 1.0940 |
| 7 | 1.0978 | 1.0938 |
| 8 | 1.0985 | 1.0945 |
| 9 | 1.0990 | 1.0950 |
| 10 | 1.0988 | 1.0948 |
| Average | 1.0976 | 1.0936 |
| Flip close | 1.0982, above the high average, so the channel turns green | |
Notice what the calculation does not do: it does not care about the shape of any single bar, the volume, or whether the move felt strong. A close 6 pips above the line and a close 60 pips above the line produce the same flip, and that is a deliberate limitation I accept rather than patch. Strength is judged after the flip, by whether price holds above the upper line on the next bar, not by how far it jumped to get there. Traders who add a strength filter to the flip, such as requiring a minimum bar size, usually end up filtering out the best flips, because the strongest trends often start quietly.
The worked trade, sized under a daily loss limit
The worked trade is the long that follows the flip calculated above. I enter long at 1.0980, the open of the bar after the flip close, with the stop below the lower line at 1.0936, a distance of 44 pips. At 10 dollars per pip per standard lot on EURUSD, the size is 500 divided by 44 times 10, which is 1.13 lots, risking 497.20 dollars. The first target sits 44 pips above entry at 1.1024, where half the position comes off for 248.60 dollars, and the stop moves to breakeven. The second target sits 88 pips above entry at 1.1068, where the rest comes off for 497.20 dollars. A full winner pays 745.80 dollars, which is 1.5 times the risk. Two points matter here. The stop is placed from the channel, not from a round number or a feeling: below the lower line is where the green thesis is actually wrong, because price has fallen back through the whole channel. And the size is rounded down, never up, because rounding up is how a 497-dollar risk quietly becomes a 505-dollar risk, and on a funded account the difference between inside the cap and outside it is not a rounding error, it is a rule breach waiting for a second loss.
| Step | Level | Maths |
|---|---|---|
| Flip | Close 1.0982 above the high average 1.0976 | Channel turns green, H4 colour agrees |
| Entry (long, next bar open) | 1.0980 | After the flip bar closed beyond the line |
| Stop | 1.0936 (44 pips) | Below the lower line, where the green thesis fails |
| Size | 1.13 lots | 500 / (44 x 10) = 1.13 lots, rounded down |
| Risk | 497.20 dollars | 1.13 x 44 x 10 |
| First target (half off) | 1.1024 (44 pips, 1R) | Half position banks 248.60 dollars, stop to breakeven |
| Second target (rest off) | 1.1068 (88 pips, 2R) | Remaining half banks 497.20 dollars |
| Total winner | 745.80 dollars (1.5R) | 248.60 + 497.20 = 745.80 dollars |
I checked this sizing against the firm’s daily limit before trading the setup live, using the max daily drawdown calculator on this site. The table below shows the inputs and outputs that matter: with a 500-dollar risk per trade and a 1,000-dollar personal daily stop, two losing trades end my day, while the firm limit alone would allow ten. That gap is intentional. The personal stop is what keeps a bad morning from becoming a breached account.
| Input | Value | Output | Value |
|---|---|---|---|
| Account size | 100,000 dollars | Risk per trade | 500 dollars (0.5 percent) |
| Firm daily loss limit | 5,000 dollars | Losing trades to hit the firm limit | 10 trades |
| Personal daily stop | 1,000 dollars | Losing trades to hit my personal stop | 2 trades, then I stop for the day |
| Winner (half at 1R, half at 2R) | 745.80 dollars | One winner covers | 1.5 losing trades |
| Stop distance | Size in lots | Risk in dollars |
|---|---|---|
| 25 pips | 2.00 | 500 |
| 30 pips | 1.66 | 498 |
| 40 pips | 1.25 | 500 |
| 50 pips | 1.00 | 500 |
| 60 pips | 0.83 | 498 |
| 80 pips | 0.62 | 496 |
The sizing grid above is the one I keep beside the chart, because the SSL Channel’s stop distance changes with the channel width, and a stop taken from the channel cannot be sized from memory. A narrow 25-pip channel allows two lots, a wide 80-pip channel allows only 0.62, and both risk the same 500 dollars. Traders who trade a fixed lot size on this indicator are not trading the indicator at all: they are letting the channel width decide their risk for them, and on a wide-channel day that decision breaches the daily stop on a single trade.
When the SSL Channel fails
The SSL Channel fails in exactly one market condition, and it fails there repeatedly: a range. In a range, price crosses the high average, flips the channel green, falls back inside, crosses the low average, flips it red, and repeats, handing you a sequence of clean-looking flips that all lose a little. My 1,100-dollar afternoon was not a trending market at all; it was a range that I traded as if RSI extremes meant something, and the SSL Channel would have failed me the same way if I had traded every flip in it. The defence is not a better setting. It is a rule about when the indicator is allowed to speak: I only trade flips that happen after at least five bars of one colour, which means the trend being flipped was established enough to be worth reversing, and I skip flips entirely when the channel width has been shrinking for three bars, which is the market telling me it is going quiet. Those two rules cut my flip count roughly in half, and they cut my losing flips by far more than half, because range flips are almost always short-colour flips.
The second failure mode is the news spike, and it is more dangerous because it looks like the best flip you will ever see. Price explodes through the high average on a CPI print, the channel flips green with conviction, and twenty minutes later the move reverses and takes out the lower line. The 30-minute news filter exists for this exact candle, and I treat it as a hard rule, not a guideline: if a flip happens within 30 minutes of a high-impact release, I do not trade it, even if it runs without me, because the flips I miss cost me nothing, while the one I take costs me 500 dollars and a day. The third failure mode is my own impatience, trading the flip before the bar closes. The channel only flips on a close, so a flip seen mid-bar is not a flip at all, and I have a standing rule against acting on it. If you take one rule from this guide, take that one: the close is the signal, the wick is noise.
How it fits prop firm rules
A trend filter earns its place on a funded account not by winning more trades, but by removing the trades that breach rules. The SSL Channel removes three rule-breaking behaviours at once. First, it caps trade frequency: with a maximum of two flips per pair per day, and the H4 agreement rule on top, I rarely take more than three trades in a day across all pairs, which keeps me far from the overtrading pattern that firms flag. Second, it enforces a real stop: the stop sits below the opposite line, a level that means something, rather than at an arbitrary 20 pips that price noise eats daily. Third, it protects consistency: because I only trade in the direction of the channel, my winning days tend to come from one clean trend rather than from scattered wins in both directions, and the best-day percentage stays inside the 30 percent consistency ceiling that most firms apply. The filtered test below shows the difference in numbers, and it is the difference between a funded account that survives and one that does not.
| Test | Trades | Wins and losses | Net result |
|---|---|---|---|
| Filtered: flip plus H4 agreement plus 5-bar colour rule | 12 | 8 wins, 4 losses | Winners 5,250 dollars minus losers 2,000 dollars, net plus 3,250 dollars, plus 6.5R |
| Unfiltered: every flip traded | 15 | 6 wins, 9 losses | Winners 3,750 dollars minus losers 4,500 dollars, net minus 750 dollars, minus 1.5R |
| Filter worth | Across 27 trades | Two extra wins, five fewer losses | 4,000 dollars of difference, best day 750 dollars, 23.1 percent of net, inside the 30 percent ceiling |
Read that test honestly, because it is easy to misread. The filter does not turn a losing indicator into a winning one; the unfiltered version loses only 750 dollars across fifteen trades, which is a survivable bleed, not a disaster. What the filter does is turn a marginal system into a fundable one, by removing the range flips that cluster on the same bad days and would otherwise stack two losses into a daily stop breach. On a funded account, that clustering is the real risk. A single loss is an education expense. Two losses before lunch, followed by a revenge third trade, is how challenges end, and the filter’s main job is to make sure the second loss never gets taken.
How it differs from the channels already on this site
This site already covers several channel and trend tools, and the SSL Channel needs to earn its place against them rather than repeat them. Against Bollinger Bands, the difference is the width calculation: Bollinger bands are set by standard deviation around a moving average, so they widen with statistical volatility, while the SSL Channel’s width is simply the gap between two averages, which responds to the actual highs and lows traded. Against Keltner Channels, the difference is sharper: Keltner bands are an average plus and minus a multiple of average true range, a fixed envelope around price, while the SSL lines swap roles when the close crosses them, so the channel itself changes state rather than just containing price. Against the EMA guides, the difference is that one average gives you a line to cross, while two averages give you a zone to respect, and the zone is what keeps you out of chop. And against HalfTrend, which draws a single line that flips colour, the SSL Channel gives you both edges of the range at once, so your stop has a home: below the lower line, not below a single line that may itself be moving. If you already trade one of those tools well, the SSL Channel is not a replacement. It is the filter you put in front of them, the question you ask before you ask theirs.
My daily routine with it
Routine is where funded trading is actually won, because rules that live only in your head do not survive the first losing morning. Mine starts the night before: I mark the H4 SSL colour for EURUSD and GBPUSD, note whether either channel is narrowing, and write down the two pairs I am allowed to trade the next day. In the London session I watch only for flips on those pairs, and only if the H1 flip agrees with the H4 colour I wrote down. After any trade, win or lose, I log the flip bar, the channel width, and whether the 5-bar rule was satisfied, because that log is what told me the exponential average variant was costing me money, and it will tell you things about your own trading that no indicator can. At the end of the day I check two numbers: how many flips I skipped, and whether my best day is still inside 30 percent of my recent net. If either number looks wrong, the next day starts with no new trades until I understand why, which is a rule that has saved more challenges than any entry technique I know.
| Time | Action | Rule that governs it |
|---|---|---|
| Evening before | Mark H4 SSL colour for EURUSD and GBPUSD | Only trade H1 flips that agree with H4 |
| London open | Watch for flips on the two marked pairs | Maximum two flips per pair per day |
| On a flip | Wait for the bar close, then check the next bar opens beyond the line | A mid-bar flip is not a flip |
| After every trade | Log flip bar, channel width, 5-bar rule satisfied or not | The log is how settings get tested, not feelings |
| End of day | Check flips skipped and best-day percentage | Best day must stay inside 30 percent of recent net |
| Two losses | Stop for the day, no exceptions | Personal daily stop is 1,000 dollars, firm limit is 5,000 dollars |
The routine also has a weekly part that most traders skip: every Sunday I re-read the week’s flip log and ask one question, which flips did I take that broke a rule, and what did they cost? The answer is usually uncomfortable and always useful. Last month it told me I was trading Asian-session flips on GBPUSD despite my own session filter, and removing those three trades from the month would have turned a flat week into a winning one. The SSL Channel did not teach me that. The log did, and the log only exists because the indicator’s rules are simple enough to check after the fact. Complexity hides mistakes. A two-line channel with a flip rule leaves nowhere for a mistake to hide, and that, more than any signal, is why it survives on a funded account.
Common mistakes with the SSL Channel
The first mistake is trading the colour instead of the flip. A green channel does not mean buy now; it means buy the next flip’s direction, or buy a pullback inside an already-green channel if your strategy allows it, but never chase a channel that has been green for twenty bars, because that trend is old and your stop, set below the lower line, is now very far away. The second mistake is shortening the length to get more signals, which is the funded-account version of turning up the volume to hear better: you get more noise, not more music, and each extra signal costs a 500-dollar risk. The third mistake is using the SSL Channel on a pair you have not checked for spread and session: on an exotic pair with a wide spread, the channel width can be smaller than the spread cost of two trades, and no flip rule survives that arithmetic. The fourth mistake, and the one I made longest, is moving the stop once the trade is running, because the lower line moved. The lower line is allowed to move; your stop is not, unless it moves to breakeven after the first target, which is the only move the plan permits. Everything else is rewriting the plan mid-trade, and mid-trade rewrites are how funded accounts die.
Frequently Asked Questions
What is the SSL Channel in simple terms?
It is a trend filter made of two moving averages, one on the highs and one on the lows of the last ten bars. When price closes above the high average the channel turns green and the trend is up; when it closes below the low average it turns red and the trend is down; when price is between the lines, nothing changes, and that patience is the point.
What are the best SSL Channel settings for prop firm trading?
Length 10, simple moving averages, on H1, with an H4 agreement check. Shorter lengths and lower timeframes flip too often for a 500-dollar risk, and longer settings flip too rarely for a challenge with a time limit. Keep the maximum at two flips per pair per day.
Is the SSL Channel better than a single moving average?
For funded trading, yes, for one reason: a single average crosses price on every wick, while the SSL Channel only changes its mind when price closes outside the recent high-low range. That carry-over rule, where an inside close keeps the old colour, filters the chop that a single average cannot.
How is the SSL Channel different from Keltner Channels?
Keltner bands are an average plus and minus a multiple of average true range, a fixed envelope around price. The SSL Channel’s two lines swap roles when the close crosses them, so the channel changes state instead of just containing price, and its width is the gap between two averages rather than a volatility multiple.
Can I use the SSL Channel on M15 for faster challenges?
You can, but never trade an M15 flip against the H1 colour, and expect far more flips, which means far more 500-dollar risks. M15 flips are a timing tool inside H1 agreement, not a standalone signal, and the stop still has to fit inside your personal daily stop.
Why does my SSL Channel look different from another trader’s?
Almost always because of the length or the average type: a length-10 simple-average channel and a length-20 exponential channel will flip on different bars, and different brokers’ session closes shift the averages slightly. Compare signals, not decimals, and always state your settings when you compare results with another trader.
Risk disclaimer: Trading leveraged products on a funded account can result in the loss of your challenge fee and account. The examples in this article use demo-logged numbers for education only; they are not a promise of results, and no indicator, including the SSL Channel, guarantees a winning trade. Always size every position inside your personal daily stop.



