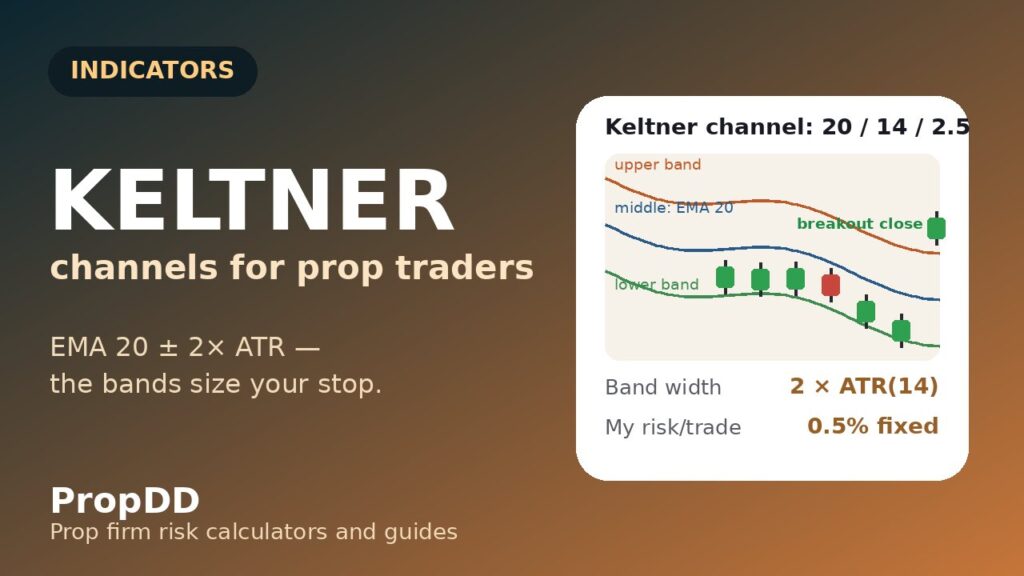
It was a Tuesday in late September, and GBPUSD was doing that thing it does when London wakes up: three decisive candles up, one sharp rejection, then a slow grind sideways that looked like a nap and felt like a trap. I had Keltner Channels on my H1 chart — three smooth lines hugging price — and the upper band had just been tagged for the third time in two days. I went short. The band, I told myself, was resistance.
In this article
- What Keltner Channels Actually Measure (and What They Don't)
- The Formula: Three Lines, No Moving Parts
- The Only Settings That Matter on a Funded Account
- How to Read the Signals: Breakouts, Pullbacks and the Squeeze
- A Real Week on GBPUSD: My "I Tested It" Numbers
- The Mistakes That Made Me Quit Keltner Twice
- How It Fits Prop Firm Rules (Daily Loss, Consistency, Journal)
- Frequently Asked Questions
Price closed above it. Then it closed above it again. Then it ran 90 pips while my short bled, and I learned the most expensive lesson an indicator can teach: I had never actually learned what the bands were measuring. I was trading lines I could not explain. The loss was $412 — inside my personal daily stop, but the embarrassment was not. I deleted the indicator, sulked for a week, then did what I should have done first: I learned the formula, backtested my journal against it, and put it back on the chart with rules. Six weeks later it is one of my three always-on overlays. Here is the full breakdown — what Keltner Channels measure, the maths, the settings that survive a funded account, and the real numbers from my journal.
What Keltner Channels Actually Measure (and What They Don’t)
A Keltner Channel is a volatility envelope: three lines drawn around price, where the distance of the outer bands from the middle is set by recent volatility. When volatility expands, the bands widen; when the market goes quiet, they contract. That contraction-expansion breathing is the entire point of the indicator — it gives you a volatility-adjusted frame of reference instead of fixed pip distances that mean different things on a calm Monday and a CPI Friday.
It helps to know where it sits in the envelope family, because traders constantly confuse the three:
| Feature | Keltner Channels | Donchian Channel | Bollinger Bands |
|---|---|---|---|
| Primary driver | EMA of price ± ATR multiple | N-period highest high / lowest low | SMA ± standard deviations |
| Reacts to a price spike | Smoothly — the EMA absorbs it | Instantly — the band jumps and stays flat | Fast and non-linear — bands balloon |
| Best job on a chart | Trend pullbacks and mechanical stop distances | Pure breakout entries | Mean reversion and volatility squeezes |
| Prop-firm angle | Stop distances in pips that adapt to volatility — objective, journal-friendly | No smoothing lag on entries | Spots statistical overextension before it costs you |
The crucial insight for funded trading: because the band width is a multiple of ATR, a Keltner band touch on a 20-pip-ATR day and a band touch on a 60-pip-ATR day are different events with different risk attached. I trade them differently too — that distinction is what turns the indicator from decoration into a risk tool. My Bollinger Bands guide covers the statistical cousin; this one is about the volatility-adjusted workhorse.
The Formula: Three Lines, No Moving Parts
Chester Keltner published the original formulation in 1960 using a 10-period average of typical price plus the 10-period average daily range. Linda Bradford Raschke later modernised it — EMA instead of a simple average, ATR instead of raw range — and that modern version is what every platform ships today. Here it is, with nothing hidden:
| Line | Formula (modern version) | Worked numbers (GBPUSD H1 example) |
|---|---|---|
| Middle line | EMA(20) of the close | 1.2915 |
| Upper band | Middle line + (multiplier × ATR(14)) | 1.2915 + (2.0 × 0.0042) = 1.2999 |
| Lower band | Middle line − (multiplier × ATR(14)) | 1.2915 − (2.0 × 0.0042) = 1.2831 |
| Position size | (Account × Risk%) ÷ (Stop in pips × Pip value) | ($100,000 × 0.5%) ÷ (63 pips × $10) = 0.79 lots |
Two things fall out of that table that matter enormously on a funded account. First, the band position is fully determined by two inputs — the EMA length and the ATR multiple — so there is almost nothing to over-optimise. Second, the ATR component hands you a stop-loss distance in pips that scales with volatility automatically. On my $100,000 account with a 0.5% risk per trade, a 63-pip stop sizes to 0.79 lots; when ATR doubles, the same 0.5% risk sizes to half the lots. The indicator enforces volatility-adjusted sizing without me doing mental gymnastics mid-session — which is exactly when I make mistakes. I run these exact calculations through the Max Daily Drawdown calculator before every session so the numbers are decided before the candles start moving.
The Only Settings That Matter on a Funded Account
Keltner Channels have three inputs, and only two of them change the chart in any meaningful way. Here is the shortlist I actually tested, with my verdict for prop-firm use:
| Setup | EMA | ATR period | Multiplier | My verdict |
|---|---|---|---|---|
| Modern default | 20 | 10 | 2.0 | Fine starting point on H1–H4; a touch twitchy for my taste |
| Prop-firm conservative (my default) | 20 | 14 | 2.5 | Wider bands = fewer, cleaner signals; my live setting |
| Squeeze hunter | 20 | 10 | 1.5 | More touches — only with an EMA-200 trend filter, never alone |
| Chop generator (avoid) | any | any | 1.0 | Bands hug price; every candle becomes a “signal” — spread donation |
Why ATR 14 instead of 10 on a funded account? The 10-period ATR reacts faster, which sounds good until a single news spike inflates your bands for the next ten candles and your stops sit in no-man’s-land. The 14-period version smooths one-off spikes — it costs a little responsiveness and buys a lot of stability, which is the trade a funded trader should always take. And the 2.5 multiplier is deliberate: on a challenge, I would rather miss two mediocre signals a week than take one extra stop-out. Fewer trades, wider bands, cleaner journal.
How to Read the Signals: Breakouts, Pullbacks and the Squeeze
Keltner Channels give you three reads, and mixing them up is where most traders go wrong — including September me. Each read has its own trigger, its own stop logic, and its own failure mode:
1. The breakout read — a candle closes beyond the upper band: bullish momentum is expanding faster than recent volatility. This is a continuation signal, not a reversal — the classic beginner error is fading the first band touch. My rule: I only take the breakout if the close is beyond the band AND the previous candle was inside it (a genuine crossing, not a drift). Stop goes 1.5 × ATR beyond the entry against the trade; target is 2R minimum. Breakouts fail most often in the first hour of a ranging day, which is why I never take one before the London open has shown its hand.
2. The pullback read — in an established trend (price above the EMA-200 on H4 for longs), a dip to the Keltner middle line — the EMA(20) — is the pullback entry. The middle line is the highest-probability level on the whole indicator because it is both a moving average and the channel’s centre of gravity. Stop goes 1 × ATR beyond the middle line; target 2R. This is my bread-and-butter setup: roughly half my Keltner trades are middle-line pullbacks, and they have the best win rate in my journal.
3. The squeeze read — when the bands contract to their narrowest in 20+ candles, volatility is coiling. The squeeze itself is not a trade — it is a calendar alert: something is about to move, so I reduce size on any new position and prepare for the breakout read. Trading inside the squeeze, guessing the direction, is how accounts die quietly. Wait for the expansion, then trade the first genuine band crossing.
One filter rules all three: I never take a Keltner signal against the H4 EMA-200 trend. The indicator is trend-following by construction — fighting the higher-timeframe trend with it is like using a thermometer as a hammer.
A Real Week on GBPUSD: My “I Tested It” Numbers
Theory is cheap; here is the week of 6–10 October on GBPUSD H1, $100,000 account, 5% daily loss limit ($5,000), my personal daily stop at $2,500, risk fixed at 0.5% ($500) per trade, Keltner(20, 14, 2.5), EMA-200 trend filter on. Every number below is from my journal — including the two losers.
| Day | Signal | Entry / Stop / Target | Size | Result |
|---|---|---|---|---|
| Mon | Breakout long — close above upper band 1.2957 | 1.2962 / 1.2899 (63 pips) / 1.3088 | 0.79 lots | +$980 (+1.96R) |
| Tue | Pullback long — touch of middle line 1.2915 | 1.2918 / 1.2876 (42 pips) / 1.3002 | 1.19 lots | +$640 (+1.28R) |
| Wed | Breakout short — close below lower band | 1.2844 / 1.2907 (63 pips) / 1.2718 | 0.79 lots | −$500 (−1R, fakeout) |
| Thu | Breakout long — post-CPI expansion | 1.2790 / 1.2714 (76 pips) / 1.2942 | 0.66 lots | +$1,120 (+2.24R) |
| Fri | Pullback long — middle line, late session | 1.2890 / 1.2848 (42 pips) / 1.2974 | 1.19 lots | −$500 (−1R, stopped) |
Net for the week: +$1,740 on $2,500 of total risk — 3 wins, 2 losses, and here is the part that matters for a funded account: even if all five had lost, the damage would have been exactly $2,500, my personal daily stop for a single day, spread across a week. The sizing maths makes the worst case boring, which is precisely the point. Notice Thursday: CPI day widened ATR to 51 pips, the stop stretched to 76 pips, and the same $500 risk automatically shrank the position to 0.66 lots. No discretion, no “this one feels strong so I’ll go bigger” — the indicator did the risk adjustment for me.
And the longer journal sample, because one good week proves nothing: over the four weeks to mid-October I logged 30 raw Keltner band touches. Traded blindly, they went 13–17 with an expectancy of −0.05R — a slow bleed, which matches the published backtest critiques of the indicator. With my three filters (EMA-200 trend, ATR-regime check, London/NY session only), 14 qualified, went 8–6, expectancy +0.48R. The indicator is not the edge. The filters around it are — and that is true of every indicator I have ever journaled, from EMA to MACD.
The Mistakes That Made Me Quit Keltner Twice
I have added and removed this indicator from my charts twice. Both removals taught me something, so here are the mistakes, in the order I made them:
Mistake 1 — fading the first band touch: the $412 Tuesday. A band touch is momentum confirmation, not exhaustion — fading it is shorting strength. The reversal trade only exists after a failed breakout re-enters the channel, and even then I want a second confirmation.
Mistake 2 — trading it on M5 around news: ATR spikes during red-folder news inflate the bands after the move has already happened; your stop lands where the volatility was, not where it is. I now flat-out skip the 30 minutes around major news — the same ATR sizing discipline I wrote about earlier.
Mistake 3 — ignoring the squeeze: narrow bands mean the market is deciding. Taking breakout trades into a squeeze is paying spread to watch paint dry, and the eventual expansion usually starts with a fakeout that stops you before the real move. Squeeze = hands off until expansion.
Mistake 4 — changing settings mid-week: after two losers I once dropped the multiplier to 1.5 “to catch more moves.” All I caught was more losers, because I had changed the system without changing the journal. Settings are a monthly decision, reviewed on Sundays — never a Tuesday reaction.
Mistake 5 — confusing it with Bollinger Bands: Bollinger bands are statistical (standard deviations); Keltner bands are volatility-absolute (ATR). A Bollinger squeeze and a Keltner squeeze are different events. Running both on one chart is fine — I do — but reading one with the other’s rules is how you fade momentum you should be riding.
How It Fits Prop Firm Rules (Daily Loss, Consistency, Journal)
An indicator earns its place on a funded chart by making rule compliance easier, not just by finding entries. Keltner Channels earn it three ways. First, daily loss limit compliance: every signal comes with an ATR-derived stop distance, so position size is a formula output, never a feeling — and the formula caps each trade at 0.5% on my account. Five consecutive full losses cannot touch my personal daily stop, let alone the firm’s 5%. Second, consistency rule compliance: because the bands filter out marginal setups, my Keltner days cluster around 1–2R instead of swinging between −3R and +8R — the smooth equity curve firms want to see. Third, journal quality: “breakout long, upper band 1.2957, stop 1.5× ATR” is an objective, reviewable record; “felt bullish” is not. My personal daily stop and the Keltner sizing rule are the two lines of defence between me and a breach — the firm’s limit is the wall, mine is the fence, and the indicator keeps me inside the fence.
Frequently Asked Questions
What are the best Keltner Channel settings for prop firm trading?
Start with EMA 20, ATR 14, multiplier 2.0. My live funded setting is EMA 20, ATR 14, multiplier 2.5 — the wider bands cut signal frequency roughly in half and the 14-period ATR smooths single news spikes. Avoid multipliers below 1.5 on a funded account: the bands hug price and every candle becomes a tradable “signal,” which is just overtrading with extra steps.
Keltner Channels vs Bollinger Bands — which is better for a funded account?
They answer different questions. Keltner (EMA ± ATR) measures volatility-absolute extremes and gives you mechanical stop distances; Bollinger (SMA ± standard deviations) measures statistical extremes and is better for mean-reversion spots. I run both: Keltner for trend pullbacks and sizing, Bollinger for overextension warnings. If you must pick one on a challenge, pick Keltner — objective stops protect the daily loss limit better than statistical bands do.
Does the Keltner Channel repaint?
The middle line (EMA) and bands update as new candles form, like any moving-average-based indicator — the current candle’s band values will shift until it closes. Closed candles do not repaint: a band touch on a closed candle stays a band touch. Only ever take signals on closed candles; intra-candle band “touches” are provisional and will embarrass you.
What timeframe works best for Keltner Channels on a prop firm account?
H1 and H4. On H1 you get 2–4 quality signals a week per pair with the 2.5 multiplier; on H4 it drops to 1–2 but the win rate climbs. Below H1, ATR noise dominates and the bands whipsaw — my M15 experiment lasted eleven days and cost me $900 in spread-heavy chop. Daily works too, but the stops get wide enough to force uncomfortably small positions on a 5% daily limit.
Can I use Keltner Channels for the consistency rule?
Indirectly, yes — and this is an underrated use. Because the indicator standardises your stop distances via ATR, your risk per trade stays mechanically constant, which keeps daily P&L swings narrow. Narrow, consistent daily results are exactly what the consistency rule rewards. It will not fix a strategy that bets the farm on Fridays, but it removes the “random position size” problem that creates consistency violations in the first place.
Why do some backtests say Keltner Channels don’t work?
Because raw, unfiltered band touches genuinely underperform — my own journal showed −0.05R expectancy on 30 unfiltered touches, and published backtests agree. The studies test the indicator naked; nobody trades it naked profitably. Add a trend filter, a volatility-regime check, and a session filter, and the same indicator printed +0.48R in my sample. Judge the system, not the line.
Risk disclaimer: trading forex and CFDs on prop firm challenges involves substantial risk of loss, including the challenge fee. Keltner Channels are a technical tool, not a guarantee — my October journal sample is small and past performance does not predict future results. Never risk money you cannot afford to lose, and always size positions so a single loss cannot threaten your daily loss limit.



4 comments
[…] a flat Donchian channel is my strongest stay-out confirmation of all. Keltner I use the way my Keltner guide describes: pullback entries once Donchian has already confirmed the trend is real. And for the exit […]
[…] indicator compares two volatility bands I already trade with: Bollinger Bands and Keltner Channels. Bollinger Bands expand and contract with the market’s own standard deviation; Keltner […]
[…] Bands expand and contract with standard deviation, which is how far price has actually moved. The Keltner Channels expand and contract with average true range, which is how far price typically moves. When the […]
[…] Keltner Channels guide […]