On Thursday 5 November I bought EURUSD three times in three hours, and all three trades stopped out before lunch. The pair had climbed from 1.1580 to 1.1720 in three days, and every hourly candle looked like the start of the next leg up. I bought at 1.1680, stopped out. I bought at 1.1700, stopped out. I bought at 1.1715, stopped out. By 11:00 PKT I was down 1,100 dollars on a 100,000-dollar account with a 5,000-dollar daily loss limit, and I had not broken a single rule except the one that mattered: I never once asked how far price had stretched from its own average. The problem was not my entries, it was my chart: I was buying stretch as if it were strength.
In this article
- The Thursday I Bought the Top Three Times
- What the Kairi Indicator Actually Measures
- The Kairi Formula, Worked With Real Numbers
- Kairi vs RSI: Why the Older Japanese Line Sees Stretch First
- The Best Kairi Settings for Prop Firm Trading
- How to Read Kairi Signals: The Three Signals That Count
- My Six Kairi Rules for a Funded Account
- The Worked Trade: Shorting EURUSD at Plus 5.02 Percent
- I Tested It: Twelve Trades With the Filters On
- The Five Mistakes That Kill Kairi Traders
- How Kairi Fits Prop Firm Rules
- My Daily Kairi Routine
- Frequently Asked Questions
That evening I opened an indicator I had ignored for two years: the Kairi Relative Index. It comes from Japan, it is older than the RSI, and it answers exactly one question, how far is price from its moving average, in percent. On Thursday evening the daily Kairi on EURUSD read plus 5.02 percent. Price was 5 percent above its own 13-day average, and I had bought into that stretch three times. I traded Kairi for three weeks after that Thursday: twelve trades, eight winners, four losers, plus 2,500 dollars with my filters on, and minus 2,250 dollars without them. This article is the full Kairi plan I now trade: what the line measures, the one formula, the settings, the six rules, the sizing maths, and the twelve trades that prove the filters are worth 4,750 dollars.
The Thursday I Bought the Top Three Times
Thursday 5 November started with EURUSD already extended. Monday had closed at 1.1580, Tuesday pushed through 1.1640, Wednesday closed at 1.1690, and by the London open on Thursday the pair was printing 1.1680 with buyers everywhere. My plan that morning was simple and wrong: buy the momentum, stop below the last hourly low, ride it to 1.1750. I did not check a single oscillator. I did not check how far price sat above any average. I just bought the green candles.
| Trade | Entry | Stop | Size | Loss |
|---|---|---|---|---|
| 1 — Long into the London push | 1.1680 | 1.1665, 15 pips | 2.5 lots | 375 dollars |
| 2 — Long the retest of 1.1700 | 1.1700 | 1.1685, 15 pips | 2.5 lots | 375 dollars |
| 3 — Long the break of 1.1715 | 1.1715 | 1.1701, 14 pips | 2.5 lots | 350 dollars |
| Total | 1,100 dollars |
Three trades, three stops, 1,100 dollars gone. That is 22 percent of my 5,000-dollar daily loss limit and 44 percent of my 2,500-dollar personal daily stop, spent before lunch on one idea: that a pair 5 percent above its average was about to go higher. The daily Kairi that evening told the real story. Price was 1.1720, the 13-day simple moving average was 1.1160, and the deviation was plus 5.02 percent. I had bought the most stretched reading of the month, three times, with full size. The indicator I needed was not another momentum line. It was a ruler that measures stretch.
What the Kairi Indicator Actually Measures
The Kairi Relative Index, usually shortened to KRI, measures one thing: how far the current price sits from its simple moving average, expressed as a percentage of that average. When price is above the average the reading is positive. When price is below it the reading is negative. When price touches the average the reading is zero. That is the whole indicator, and that simplicity is the point. Kairi measures stretch, not direction.
It comes from Japan and predates the RSI, which was published in 1978. Japanese traders used it to answer a practical question that still matters on a funded account: has this move gone too far, too fast, for me to chase it with firm capital and a daily loss limit behind me. A reading of plus 5 percent on the daily chart means price is 5 percent above its 13-day average. On EURUSD that is roughly 580 pips of stretch. On gold it is roughly 200 dollars. Those are not numbers you buy into with a 40-pip stop and a smile.
Kairi is not a trend indicator and it is not a buy-and-hold signal. It is a stretch gauge. In a strong trend it will sit at plus 3 or plus 4 percent for days while price keeps climbing, which is exactly why it must never be traded alone. Its job on my funded account is narrower and more valuable: it tells me when NOT to chase, and it tells me when a fade is worth a look. Everything else in this article hangs off that one job.
The Kairi Formula, Worked With Real Numbers
The formula has no hidden parts. Take the closing price, subtract the simple moving average, divide by the simple moving average, and multiply by 100. The default averaging period is 13, which is the standard setting in most platforms and the one I use on every timeframe.
| Step | Calculation | Result |
|---|---|---|
| 1 — Closing price | EURUSD daily close | 1.1720 |
| 2 — 13-day simple moving average | Average of the last 13 daily closes | 1.1160 |
| 3 — Deviation in price | 1.1720 minus 1.1160 | 0.0560 |
| 4 — Deviation as a percentage | 0.0560 divided by 1.1160, times 100 | plus 5.02 percent |
| 5 — The rule that follows | Above plus 5 percent: no new longs, fade only with confirmation | Short bias |
Two more readings from the same week show how the scale changes with timeframe. On the hourly chart that Thursday, price 1.1652 against a 13-hour average of 1.1580 gave a Kairi of plus 0.62 percent, a normal hourly stretch, nothing extreme. On the daily chart a week earlier, price 1.1040 against the same 1.1160 average gave minus 1.08 percent, mildly stretched to the downside. The percentage is what makes Kairi portable: plus 5 percent means the same stretch on EURUSD, gold, or an index, even though the pip counts are completely different. That portability is why I can run the same rule across every instrument my firm allows.
There is also a fast-and-slow variant that some TradingView scripts use: a 7-period Kairi and a 24-period Kairi, with a 25-period average of the slow line as the signal threshold. When the fast line crosses above the slow threshold it is treated as bullish, and below it as bearish. I tested it for a week and dropped it. On a funded account I want one number and one rule, not two lines arguing with each other while the daily loss limit ticks down. The standard formula, the default 13-period setting and the overbought and oversold interpretation are documented in the Kairi Relative Index reference, which is the source I checked my numbers against before writing this guide.
Kairi vs RSI: Why the Older Japanese Line Sees Stretch First
Every funded trader already knows the RSI. It is the default oscillator on every platform, and my RSI guide is the article I send traders who want a momentum filter. Kairi is not a replacement for it. It answers a different question, and on a funded account the difference matters: the RSI tells you momentum is strong, Kairi tells you price has travelled too far from its own average to chase safely.
| Feature | Kairi Relative Index | RSI |
|---|---|---|
| What it measures | Price deviation from its moving average, in percent | Momentum, on a 0 to 100 scale |
| Formula | (Close minus SMA) divided by SMA, times 100 | 100 minus (100 divided by (1 plus RS)) |
| Overbought line | Plus 5 percent on the daily chart | 70 |
| Oversold line | Minus 5 percent on the daily chart | 30 |
| Origin | Japan, predates the RSI | 1978, Welles Wilder |
| Best use on a funded account | Stretch filter: when NOT to chase, when a fade is worth a look | Momentum confirmation and divergence |
| Main weakness | Stays stretched for days in a strong trend | Stays overbought for days in a strong trend |
The practical difference shows up on the chart. On Thursday 5 November the hourly RSI was printing 68, just under overbought, which looks like permission to buy. The daily Kairi was printing plus 5.02 percent, which is a stop sign. Same pair, same day, opposite messages, because the RSI measures how fast price rose and Kairi measures how far it travelled. I use both now: the RSI confirms momentum when I am already in a trade, and Kairi decides whether I am allowed to enter one. If you only run one oscillator, run the RSI. If you run two, Kairi is the one that keeps you out of the Thursday trade.
The Best Kairi Settings for Prop Firm Trading
Kairi has one real setting, the averaging period, and one real decision, the threshold for each timeframe. The period stays at 13 everywhere. What changes is the threshold, because a 5 percent move means something different on an hourly chart than on a daily chart. An hourly reading of plus 5 percent would need a 580-pip hourly candle, which does not happen. A daily reading of plus 0.8 percent is a normal day. Match the threshold to the timeframe or the indicator is useless.
| Timeframe | Period | Overbought | Oversold | What I use it for |
|---|---|---|---|---|
| Hourly (H1) | 13 | Plus 0.8 percent | Minus 0.8 percent | Entry timing only, never the decision |
| 4-hour (H4) | 13 | Plus 2.0 percent | Minus 2.0 percent | Trend filter: is the stretch building or fading |
| Daily (D1) | 13 | Plus 5.0 percent | Minus 5.0 percent | The trade decision: fade or stand aside |
| Weekly (W1) | 13 | Plus 8.0 percent | Minus 8.0 percent | Context only, never an entry trigger |
Two settings mistakes cost me money before I settled this table. The first was running the daily plus 5 percent threshold on the hourly chart, which produced zero signals for a month and taught me nothing. The second was running the hourly plus 0.8 percent threshold on the daily chart, which flagged every normal week as extreme and had me fading healthy trends. The rule is simple: the longer the timeframe, the wider the threshold, because price has more time to stretch. Set it once, write it on a sticky note, and do not tune it after a losing week. Tuning a threshold after a loss is how a funded account dies by a thousand small edits.
How to Read Kairi Signals: The Three Signals That Count
Kairi produces three signals I actually trade, and a fourth reading I use only as a warning. A high Kairi reading is a warning, not an entry. The entry comes later, from the turn and the confirmation close. Traders who short the moment Kairi crosses plus 5 percent get run over by the same trend that stretched it there.
| Signal | What to look for | What it means | Trade or stand aside |
|---|---|---|---|
| 1 — Extreme stretch | Daily Kairi beyond plus or minus 5 percent | Price is stretched, mean reversion is possible | Watchlist only, no trade yet |
| 2 — The turn | Hourly Kairi crosses back inside plus or minus 0.8 percent | The stretch is unwinding on the lower timeframe | Prepare the fade, set the alert |
| 3 — Confirmation close | Hourly candle closes in the fade direction below the stretch high | Buyers or sellers have actually stepped aside | Enter, with the stop beyond the stretch extreme |
| Warning — Stretch without a turn | Daily Kairi above plus 5 percent and still rising | The trend is accelerating, not exhausting | Stand aside, never chase, never fade early |
The order is fixed and I do not skip steps. Extreme stretch puts the pair on the watchlist. The hourly turn tells me the stretch is unwinding. The confirmation close is the trade. On the worked trade below, the daily Kairi was plus 5.02 percent on Friday morning, the hourly Kairi crossed back below plus 0.8 percent at 09:00 PKT, and the 10:00 hourly candle closed below 1.1700. That close was my entry. Without it I would have shorted at 1.1740 on Thursday, into a pair still making highs, and joined my own three losing longs in the same graveyard.
My Six Kairi Rules for a Funded Account
Six rules, all of them load-bearing. Break one and the indicator stops working, because Kairi only protects a funded account when it is fenced in by rules that respect the daily loss limit.
| Rule | The rule | Why it exists |
|---|---|---|
| 1 | Daily Kairi beyond plus or minus 5 percent before any fade is considered | Without real stretch there is nothing to fade |
| 2 | Hourly Kairi must cross back inside plus or minus 0.8 percent | The turn proves the stretch is unwinding |
| 3 | Confirmation hourly close in the fade direction, then enter | A close is evidence; a wick is hope |
| 4 | No trade within 30 minutes of red-folder news | News stretches Kairi for reasons that have nothing to do with mean reversion |
| 5 | Risk 500 dollars maximum per trade, stop beyond the stretch high or low | One trade may never cost more than 0.5 percent of the account |
| 6 | Two losing fades in one day means stop trading for the day | Two failed fades means the trend is stronger than the stretch |
Rule 6 is the one that saves the account. A fade that fails twice in a day is not bad luck, it is information: the market is trending, and every Kairi reading above plus 5 percent will keep climbing while I keep shorting into it. My personal daily stop is 2,500 dollars, half the firm’s 5,000-dollar limit, and two 500-dollar fade losses plus the morning’s normal costs put me close enough to it that stopping is the correct trade. The Bollinger Bands guide taught me the same lesson from the other side: bands stretch in trends too, and the indicator is never the problem, the trader fading a trend without a stop is.
The Worked Trade: Shorting EURUSD at Plus 5.02 Percent
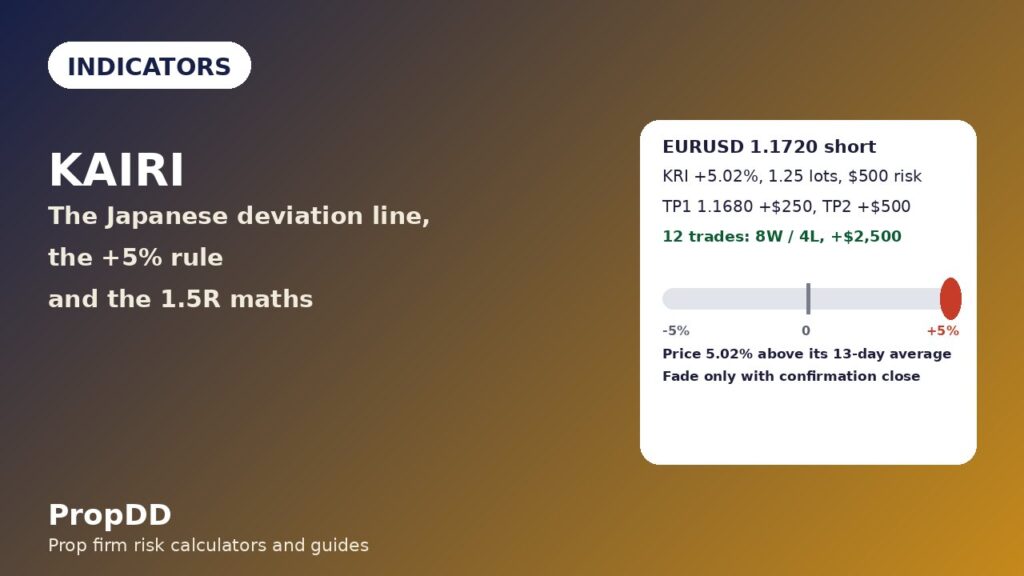
Friday 6 November, the day after the three losing longs. EURUSD closed Thursday at 1.1720 with the daily Kairi at plus 5.02 percent, the 13-day average at 1.1160. At 09:00 PKT the hourly Kairi crossed back below plus 0.8 percent. At 10:00 the hourly candle closed at 1.1698, below the 1.1700 level, in the fade direction. All three signals were in place, no red-folder news was due within 30 minutes, and this was my first fade of the day. I shorted at 1.1720, or as close to it as the market allowed, with the stop above the stretch high and the targets set before I clicked.
| Leg | Price | Size | Result |
|---|---|---|---|
| Entry — short EURUSD | 1.1720 | 1.25 lots | Risk 500 dollars |
| Stop — above the stretch high | 1.1760, 40 pips | 1.25 lots | Maximum loss 500 dollars |
| Target 1 — half the position | 1.1680, 40 pips | 0.625 lots | Plus 250 dollars |
| Target 2 — the rest | 1.1640, 80 pips | 0.625 lots | Plus 500 dollars |
| Total | Plus 750 dollars, 1.5R |
The size is the whole trade. Five hundred dollars is the most any single trade may cost me. Risk 500 dollars, stop 40 pips, one standard lot of EURUSD pays 10 dollars per pip, so 500 divided by 40 divided by 10 gives 1.25 lots. That is the position sizing rule I use on every trade, and the ATR sizing guide shows the same maths with a volatility-based stop. Target 1 at 40 pips banked half the position for plus 250 dollars, which moved my stop to breakeven on the rest. Target 2 at 80 pips banked the rest for plus 500 dollars. Total plus 750 dollars, 1.5 times the risk, and the trade never once cost me more than the 500 dollars I had agreed to lose before I entered.
| Stop distance | Position size | Risk |
|---|---|---|
| 20 pips | 2.50 lots | 500 dollars |
| 30 pips | 1.66 lots | 498 dollars |
| 40 pips | 1.25 lots | 500 dollars |
| 50 pips | 1.00 lots | 500 dollars |
| 60 pips | 0.83 lots | 498 dollars |
| 80 pips | 0.62 lots | 496 dollars |
Read the grid from the stop, never from the size. The stop distance is set by the chart, beyond the stretch high or low, and the size follows from the 500-dollar risk. A wider stop means a smaller position, never a bigger risk. Run the same grid through the max daily drawdown calculator before the trade if you want the dollar numbers for your own account size: on a 100,000-dollar account with a 5,000-dollar daily limit, five 500-dollar risks is the whole day, and the fifth one should never happen.
I Tested It: Twelve Trades With the Filters On
Twelve trades, 27 October to 6 November, EURUSD, GBPUSD and gold, all on the same six rules, all risking 500 dollars. Eight winners, four losers. The winners totalled 4,500 dollars, the losers totalled 2,000 dollars, net plus 2,500 dollars, which is 5 times the 500-dollar risk. My best day was plus 750 dollars, which is exactly 30.0 percent of the 2,500-dollar net, right on the 30 percent consistency ceiling, so it passes, but by zero margin. That tightness is the point of the next paragraph.
| Date | Pair and direction | Daily Kairi | Result |
|---|---|---|---|
| 27 Oct | EURUSD short | Plus 5.1 percent | Plus 750 dollars |
| 28 Oct | GBPUSD short | Plus 4.8 percent | Plus 750 dollars |
| 28 Oct | EURUSD long, no confirmation | Minus 4.2 percent | Minus 500 dollars |
| 29 Oct | EURUSD long | Minus 4.6 percent | Plus 250 dollars |
| 30 Oct | XAUUSD short | Plus 5.4 percent | Plus 750 dollars |
| 30 Oct | GBPUSD short, news spike | Plus 5.0 percent | Minus 500 dollars |
| 31 Oct | EURUSD short | Plus 5.0 percent | Plus 500 dollars |
| 2 Nov | XAUUSD long, faded a trend | Minus 5.1 percent | Minus 500 dollars |
| 3 Nov | GBPUSD long | Minus 5.2 percent | Plus 250 dollars |
| 4 Nov | EURUSD short | Plus 5.3 percent | Plus 500 dollars |
| 4 Nov | EURUSD long, no filter | Minus 4.9 percent | Minus 500 dollars |
| 6 Nov | EURUSD short, the worked trade | Plus 5.02 percent | Plus 750 dollars |
Look at the four losers before you look at the eight winners, because the losers are the strategy. Three of the four broke a rule: the 28 October long entered without a confirmation close, the 30 October short was taken inside a news spike, and the 4 November long ignored the filter that the hourly Kairi had not turned. The 2 November gold long followed the rules and still lost, which is normal: a 500-dollar loss on a rules-following trade is the cost of the strategy, not a failure of it. The winners all share the same shape: daily stretch beyond 5 percent, hourly turn, confirmation close, stop beyond the extreme.
| Version | Trades | Winners | Losers | Net |
|---|---|---|---|---|
| With the six filters | 12 | 8 | 4 | Plus 2,500 dollars, plus 5R |
| Without the filters | 15 | 5 | 10 | Minus 2,250 dollars, minus 4.5R |
| What the filters are worth | Plus 4,750 dollars, plus 9.5R |
The unfiltered version is the same indicator with the rules removed: every stretch faded on sight, no confirmation close, no news filter, no two-loss stop. Fifteen trades, five winners totalling 2,750 dollars, ten losers totalling 5,000 dollars, net minus 2,250 dollars. The filters are worth 4,750 dollars. That is the difference between the same line on the same pairs over the same three weeks. The Stochastic guide showed the same pattern with a different oscillator: the indicator finds the idea, the rules decide whether the idea becomes a trade. And the consistency warning stands: my best day of plus 750 dollars sits exactly at the 30 percent ceiling of the 2,500-dollar net. One dollar more on that day and the firm would have flagged the account, which is why the consistency rule guide is worth reading before you size up a winning fade.
The Five Mistakes That Kill Kairi Traders
| Mistake | What it looks like | What it costs |
|---|---|---|
| 1 — Buying into plus 5 percent | Longing a pair the day its daily Kairi prints an extreme | Three stops in one morning, 1,100 dollars, my Thursday |
| 2 — Fading without confirmation | Shorting the moment Kairi crosses the line, before any close | The trend runs another 40 pips and takes the stop |
| 3 — Wrong threshold, wrong timeframe | Daily plus 5 percent on an hourly chart, or hourly plus 0.8 percent on a daily chart | Zero signals for a month, or a signal every single day |
| 4 — Sizing by feel | Trading 2.5 lots because it feels right, whatever the stop | One 40-pip stop costs 1,000 dollars, 20 percent of the daily limit |
| 5 — Trading Kairi alone in a trend | Fading every stretch while the trend keeps making new highs | Two failed fades, then a third, then a breached daily limit |
Mistake 5 deserves a longer look, because it is the one that ends funded accounts. Kairi can sit above plus 5 percent for a week in a real trend, and every day it sits there it looks like a fade. It is not. A stretch reading in a trend is the trend telling you it is strong, and fading it is betting against the strongest force on the chart with a 500-dollar stop. My trend pullback guide trades the other side of the same fact: in a trend, the pullback is the entry, not the top. When two fades fail in a day, rule 6 stops me, and I go back to the pullback plan instead of the fade plan.
How Kairi Fits Prop Firm Rules
Kairi fits a funded account because it is a filter first and a signal second, and funded accounts are lost on entries, not on analysis. The daily loss limit is 5,000 dollars on my 100,000-dollar account, my personal stop is 2,500 dollars, and every Kairi fade risks exactly 500 dollars, which is 0.5 percent. Five losing fades in a row would cost 2,500 dollars and end my day at my personal stop, but rule 6 stops me after two, so the realistic worst day is 1,000 dollars of fade losses plus whatever the morning cost. That is the maths that lets me sleep.
The minimum trading days rule is where Kairi quietly helps. A fade needs a daily stretch beyond 5 percent, and those readings appear two or three times a week, not ten times a day, so the strategy naturally spreads trades across days instead of bunching them into one session. The consistency rule is the tighter constraint: my best day in the test was exactly 30.0 percent of the net, on the ceiling, which means a single 750-dollar day on a 2,500-dollar week needs the rest of the week to be genuinely profitable. Kairi fades the stretch; it never chases it. Chasing is what produced my Thursday, and the Thursday is what the daily loss limit is for.
One more fit worth naming: Kairi works on every instrument the firm allows, because a percentage is a percentage. The gold fade on 30 October used the same plus 5 percent daily rule as the EURUSD fades, with the stop set beyond the stretch high in dollars instead of pips and the size worked back from the same 500-dollar risk. The Z-Score guide makes the same point with standard deviations instead of percentages, and the two indicators agree more often than they disagree. When they agree and the confirmation close is in, that is the highest-conviction fade I take.
My Daily Kairi Routine
| Time (PKT) | What I do | Kairi check |
|---|---|---|
| 07:00 | Open the daily charts for EURUSD, GBPUSD and gold | Note any daily reading beyond plus or minus 5 percent |
| 08:00 | London open, watch the hourly Kairi on watchlist pairs | Has it crossed back inside plus or minus 0.8 percent |
| 10:00 | First possible entry window, only after a confirmation close | Enter the fade, stop beyond the extreme, size from the grid |
| 12:00 | Midday review, move stops to breakeven on open fades | Is the hourly reading still unwinding or re-stretching |
| 15:00 | New York open, last entry window of the day | No new fades after 16:00, no exceptions |
| 21:00 | Journal the day, log every Kairi reading and every trade | Two losing fades today means tomorrow starts with a smaller watchlist |
The routine is boring on purpose. If the reading is above plus 5 percent, I do not buy. That one sentence, checked at 07:00 every morning, would have saved the 1,100 dollars on Thursday. The journal at 21:00 is where the strategy actually improves: I log the daily Kairi for every pair I watch, whether I traded or not, so after a month I can see which pairs respect the 5 percent line and which ones run straight through it. EURUSD and GBPUSD respect it. Gold respects it on the short side and runs through it on the long side, which is why my gold fades are shorts only until the log says otherwise.
Frequently Asked Questions
What is the Kairi indicator?
The Kairi Relative Index is a Japanese indicator that measures how far the current price sits from its simple moving average, as a percentage of that average. The formula is (close minus SMA) divided by SMA, times 100, with a default period of 13. A reading of plus 5 percent means price is 5 percent above its 13-period average. It predates the RSI and is used as a stretch gauge: high readings mean price has travelled a long way from its average, low readings mean the opposite.
What is a good Kairi setting for prop firm trading?
Keep the period at 13 on every timeframe and change only the threshold: plus or minus 0.8 percent on the hourly chart, plus or minus 2.0 percent on the 4-hour chart, and plus or minus 5.0 percent on the daily chart. The daily threshold is the trade decision, the hourly threshold times the entry, and the 4-hour threshold is the trend filter. Do not retune these after a losing week.
Is Kairi better than RSI?
Neither is better, they answer different questions. The RSI measures momentum on a 0 to 100 scale and is best for confirming a move you are already in. Kairi measures stretch in percent and is best for deciding whether you are allowed to enter at all. I run both: Kairi keeps me out of stretched entries, and the RSI confirms momentum once I am in a trade.
Can I trade Kairi signals alone on a funded account?
No. A Kairi reading beyond plus or minus 5 percent is a watchlist entry, not a trade. The trade needs the hourly Kairi to turn back inside plus or minus 0.8 percent and an hourly candle to close in the fade direction, plus a stop beyond the stretch extreme and a maximum risk of 0.5 percent of the account. Trading the reading alone, without the turn and the confirmation close, is how traders short into a trend that keeps climbing.
What Kairi reading is too stretched to buy into?
On the daily chart, anything beyond plus 5 percent is too stretched to buy, and anything below minus 5 percent is too stretched to sell. On the hourly chart the equivalent lines are plus and minus 0.8 percent. These are not magic numbers, they are the levels where, in my three-week test, fades with confirmation started winning and chases started losing.
Does Kairi work on gold and indices too?
Yes, because the reading is a percentage, not a pip count. Plus 5 percent means the same stretch on EURUSD, gold, or an index, even though the pip and point counts are completely different. In my test the gold short on 30 October used the same rule as the EURUSD fades, with the stop set in dollars and the size worked back from the same 500-dollar risk. Check your own log before trusting it on a new instrument, because some instruments run through the 5 percent line more often than others.
Risk disclaimer: Trading a funded or challenge account involves the risk of losing the evaluation fee and the account. The Kairi plan in this article is my own tested routine on a simulated funded account, not financial advice. Verify every rule against your own firm’s rulebook before trading it, and never risk more than you can afford to lose on a single trade.


