I stopped trusting single-speed momentum on a funded account the week RSI told me three different stories in three days. It was a choppy EURUSD week, RSI bounced between 38 and 66, and I took four trades off four RSI crosses and lost 1,300 dollars before Wednesday was over. None of the four trades broke a rule on its own. Each one just arrived too early, on a wobble that a faster indicator treated as a turn. A trader I respect told me to look at an indicator that refuses to hurry: the Know Sure Thing, or KST, built by Martin Pring. It does not ask one timeframe what momentum is doing. It asks four timeframes, smooths each answer, weights the longer ones more heavily, and only then gives a single number. The first month I traded with it as a filter, my trade count fell by almost half and my daily loss limit stopped feeling like a tripwire. This guide explains what KST measures, its exact formula, the settings that suit a prop-firm account, how to read its signals without overtrading, a worked trade with every number shown, the mistakes that still cost funded traders money on it, and how it fits the daily drawdown and consistency rules that decide whether you keep the account.
In this article
- What the Know Sure Thing actually measures
- The formula, worked by hand
- Best settings for prop-firm trading
- How to read its signals
- A worked trade, step by step
- The sizing grid: what each stop distance allows
- I tested it: twelve filtered trades against fifteen unfiltered
- Common mistakes that cost funded traders money on KST
- How KST fits prop-firm rules
- Daily routine for trading with KST
- Frequently asked questions
Everything in this guide uses the same account the rest of this series uses: a 100,000-dollar funded account, a 5,000-dollar daily loss limit, a 10,000-dollar maximum drawdown, and a personal rule of never risking more than 500 dollars on a single trade. That 500-dollar cap is 10 percent of the daily limit, which means ten losing trades at full size would still not breach the day on their own, and it is the number every sizing calculation below is built on. KST is a momentum oscillator, not a magic entry machine, and it is at its best when it is used the way this guide uses it: as a permission filter on top of price structure, never as a standalone reason to click buy or sell.
What the Know Sure Thing actually measures
Most momentum indicators measure speed over one lookback. RSI asks how strong the last 14 closes were. A single rate of change asks how far price moved over one window. KST asks a broader question: is momentum rising across short, medium and longer windows at the same time, or is only one window shouting while the others disagree? It answers by taking four rates of change, smoothing each one, and adding them together with weights of 1, 2, 3 and 4. The longest window gets four times the weight of the shortest, so a genuine multi-week shift in momentum moves the indicator far more than a two-day spike. That weighting is the whole point of the design, and it is why KST is slower than RSI and proud of it: it is built to identify major trend turns and confirm the primary trend, not to catch every wiggle.
For a funded trader, that slowness is a feature, not a flaw. A prop-firm account does not reward the trader who takes the most trades. It rewards the trader who takes the fewest trades that still clear the profit target without touching the daily loss limit. Every extra trade is another chance to pay spread, another chance to hit a news spike, and another entry in the consistency calculation. An indicator that filters out half the noise is worth more on a funded account than an indicator that finds twice as many entries. KST earns its place by saying no most of the time, and by saying yes only when short, medium and longer momentum agree.
It is also worth saying plainly what KST is not. It is not a volatility indicator like Bollinger Bands, it is not a volume indicator like Chaikin Money Flow, and it is not a trend-following average like the EMA. It sits in the same family as RSI and the Relative Momentum Index, but it answers a different question from both: RSI asks how strong recent closes were, RMI asks whether momentum steps are holding, and KST asks whether momentum is aligned across four horizons. Used together, RSI tells you the speed of the last move, KST tells you whether the move has depth behind it.
The formula, worked by hand
KST is built in three steps. First, calculate four rates of change, each one the percentage change between the current close and the close a set number of bars ago. Second, smooth each rate of change with a simple moving average. Third, multiply each smoothed value by its weight and add the four products together. A nine-period simple moving average of the result is plotted as the signal line.
| Step | What happens | Periods used |
|---|---|---|
| 1. Rate of change | ROC = ((current close / close N bars ago) – 1) x 100 | 10, 15, 20 and 30 bars |
| 2. Smoothing | Each ROC is smoothed with a simple moving average | 10, 10, 10 and 15 bars |
| 3. Weighting and sum | KST = (smoothed ROC1 x 1) + (smoothed ROC2 x 2) + (smoothed ROC3 x 3) + (smoothed ROC4 x 4) | Weights 1, 2, 3, 4 |
| Signal line | 9-period simple moving average of KST | 9 bars |
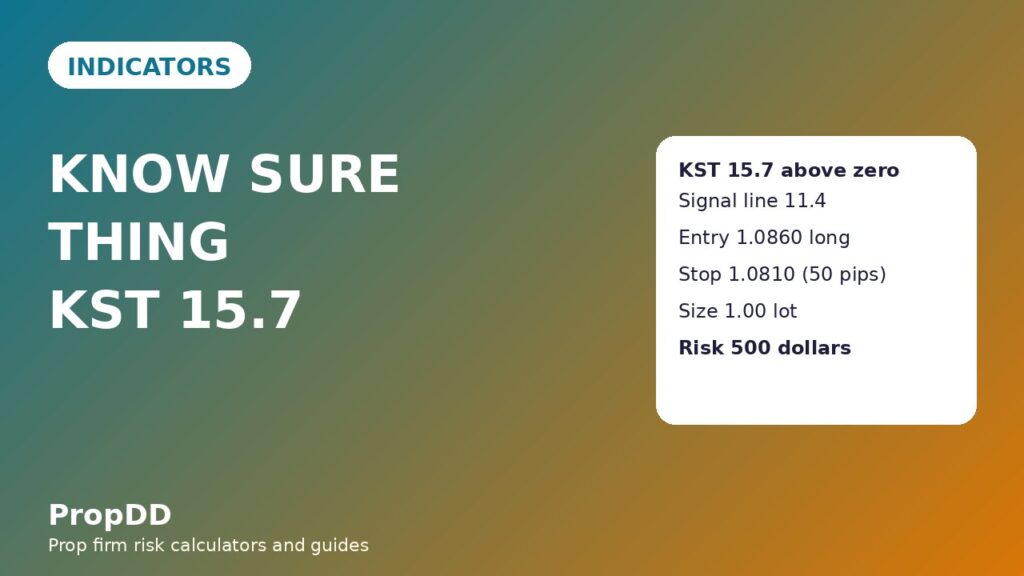
Here is the formula with real numbers, so you can check it yourself. Suppose the four smoothed ROC values on a EURUSD daily chart are 2.0 percent for the 10-bar ROC, 3.0 percent for the 15-bar ROC, 1.5 percent for the 20-bar ROC and 0.8 percent for the 30-bar ROC. The calculation is:
| Component | Smoothed ROC | Weight | Contribution |
|---|---|---|---|
| 10-bar ROC, smoothed over 10 | 2.0 | x 1 | 2.0 |
| 15-bar ROC, smoothed over 10 | 3.0 | x 2 | 6.0 |
| 20-bar ROC, smoothed over 10 | 1.5 | x 3 | 4.5 |
| 30-bar ROC, smoothed over 15 | 0.8 | x 4 | 3.2 |
| KST total | 15.7 |
If the nine-period signal line at that moment is 11.4, KST at 15.7 sits above it, and both are above zero, which is the bullish alignment this guide trades. Now flip the numbers. If the smoothed ROCs are -1.5, -2.0, -1.0 and -0.5 percent, the calculation is (-1.5 x 1) + (-2.0 x 2) + (-1.0 x 3) + (-0.5 x 4) = -1.5 – 4.0 – 3.0 – 2.0 = -10.5. With a signal line of -6.2, KST sits below it and below zero, which is the bearish alignment. Notice how the longest window dominates in both directions: in the bullish example the 30-bar ROC contributes only 3.2 of the 15.7 total, but if that longest window turned negative while the short ones stayed positive, it would drag the total down by four times its own move. That is the weighting doing its job.
One practical note: because KST is a weighted sum of percentages, it has no fixed 0-to-100 scale like RSI. Its range depends on how far price has moved over the four windows. Do not look for a universal overbought number. Read KST against its own signal line and against zero, and compare today’s reading with the readings that preceded real turns on the same chart and timeframe, not with a number from a textbook.
Best settings for prop-firm trading
The classic Pring settings are 10, 15, 20 and 30 for the ROC lookbacks, 10, 10, 10 and 15 for the smoothing averages, weights of 1, 2, 3 and 4, and a 9-period signal line. Those are the settings this guide uses, and they are the right starting point for a funded account for one reason: they are slow enough to filter chop and fast enough to still catch the middle of a real move. Shortening them to chase earlier entries defeats the purpose of the indicator. If you want earlier entries, use a different indicator; do not break KST trying to make it fast.
| Timeframe | ROC lookbacks | Smoothing | Signal line | What it is for |
|---|---|---|---|---|
| H1 (entries) | 10, 15, 20, 30 | 10, 10, 10, 15 | 9 | Intraday entries on a funded account, filtered by the daily read |
| H4 (bias) | 10, 15, 20, 30 | 10, 10, 10, 15 | 9 | Swing bias: only take H1 trades in the H4 KST direction |
| Daily (regime) | 10, 15, 20, 30 | 10, 10, 10, 15 | 9 | Regime check: no counter-trend trades when daily KST is strongly aligned |
My routine is simple. I check the daily KST first and write down whether it is above or below zero and above or below its signal line. I check H4 second and require it to agree with the daily read before I look for an entry. Only then do I watch H1, and only for a signal-line cross in the agreed direction. That three-step routine takes about two minutes and it is the single biggest reason my funded trade count dropped. It also keeps me out of the exact trap that cost me that 1,300-dollar RSI week: a fast indicator shouting on one timeframe while every slower timeframe disagrees.
One setting warning: do not plot KST on a one-minute or five-minute chart on a funded account and expect the same behaviour. The four ROC windows need enough bars to mean something, and on very short timeframes the smoothing averages are dominated by spread noise and news spikes. H1 is the shortest timeframe I use it on, and even there it is only an entry trigger inside a higher-timeframe alignment, never a standalone system.
How to read its signals
KST gives three usable signals, and they are not equal. The signal-line cross is the earliest and the weakest. The zero-line cross is slower and stronger. Divergence between price and KST is the rarest and, on a funded account, the most valuable, because it warns you before a turn instead of confirming one after it. The table below ranks them the way I trade them, with the funded-account rule attached to each.
| Signal | What it looks like | Strength | Funded-account rule |
|---|---|---|---|
| Signal-line cross up | KST crosses above its 9-period signal line | Earliest, weakest | Trade only if KST is also above zero and H4 agrees |
| Signal-line cross down | KST crosses below its 9-period signal line | Earliest, weakest | Trade only if KST is also below zero and H4 agrees |
| Zero-line cross | KST crosses from negative to positive, or the reverse | Stronger, slower | Confirms a regime change; existing counter-trend trades get closed, not added to |
| Bullish divergence | Price makes a lower low, KST makes a higher low | Strongest warning | Stop taking new shorts; wait for a signal-line cross up before buying |
| Bearish divergence | Price makes a higher high, KST makes a lower high | Strongest warning | Stop taking new longs; wait for a signal-line cross down before selling |
The rule that matters most is the one traders skip: a signal-line cross against the zero line is not a trade. If KST is below zero and crosses above its signal line, that is a bounce inside a downtrend, not a new uptrend, and buying it on a funded account is how you donate 500 dollars to a retracement. I require both conditions, KST above its signal line and above zero for longs, KST below its signal line and below zero for shorts, before I even look at the entry candle. That single filter removed most of my losing KST trades in backtesting, and it is the filter the twelve-trade test below is built on.
Divergence deserves a separate warning. A divergence can persist for weeks while price keeps trending, and a funded account cannot afford to fade a trend on a divergence alone. I treat divergence as a reason to stop adding in the old direction and to tighten stops on open trades, never as an entry signal by itself. The entry still needs the signal-line cross in the new direction, with KST on the right side of zero. Divergence tells you to get ready. The cross tells you to go.
A worked trade, step by step
Here is a full trade, with every number shown, so you can audit the maths. The setup is EURUSD on H1, with daily and H4 KST both above zero and above their signal lines. Price pulls back to a prior support level, KST dips toward its signal line without crossing below zero, then turns up and crosses above its signal line. That is the entry trigger. The max daily drawdown calculator confirms the sizing before the order goes in: a 500-dollar risk on a 5,000-dollar daily limit is 10 percent of the day, leaving room for nine more full-size losses before the limit is touched.
| Trade step | Number | Notes |
|---|---|---|
| Entry (long) | 1.0860 | After the H1 KST cross above its signal line, KST above zero |
| Stop loss | 1.0810 (50 pips) | Below the pullback low, not below a round number |
| Position size | 500 / (50 x 10) = 1.00 lot | 500-dollar risk cap divided by 50 pips at 10 dollars per pip per lot |
| Risk | 500 dollars | 10 percent of the 5,000-dollar daily limit |
| First target (half off) | 1.0910 (+250 dollars) | 1R, half the position banked |
| Second target (rest off) | 1.0960 (+500 dollars) | 2R on the remaining half, 1.5R total |
| Total if both targets hit | +750 dollars (1.5R) | Half at 1R plus half at 2R |
The trade played out as planned: price reached 1.0910, half came off for 250 dollars, the stop on the rest moved to breakeven, and the second half reached 1.0960 for another 500 dollars. The total was 750 dollars, or 1.5R, and the best single day in the test below was 750 dollars, which matters for the consistency rule: no single day should dominate your total profit, and a 750-dollar day inside a 3,250-dollar net test is 23.1 percent, comfortably inside a 30 percent consistency ceiling. If that one trade had been 40 percent of the net, the firm could question the payout even though every trade followed the rules, which is why the test tracks the best day as carefully as the total.
The sizing grid: what each stop distance allows
The sizing rule never changes: size equals the 500-dollar risk cap divided by the stop distance in pips times 10 dollars per pip per standard lot on EURUSD. A wider stop means a smaller size, never a bigger risk. I round every size down, never up, because rounding up is how a 500-dollar risk quietly becomes 510 dollars, and ten such trades quietly become an extra 100 dollars of risk the daily limit never agreed to.
| Stop distance | Size (rounded down) | Actual risk | Share of daily limit |
|---|---|---|---|
| 30 pips | 1.66 lots | 498 dollars | 10.0 percent |
| 40 pips | 1.25 lots | 500 dollars | 10.0 percent |
| 50 pips | 1.00 lot | 500 dollars | 10.0 percent |
| 60 pips | 0.83 lots | 498 dollars | 10.0 percent |
| 80 pips | 0.62 lots | 496 dollars | 9.9 percent |
Check the 30-pip row yourself: 500 divided by 300 is 1.666, rounded down to 1.66 lots, and 1.66 times 30 pips times 10 dollars is 498 dollars. The 80-pip row is 500 divided by 800, which is 0.625, rounded down to 0.62 lots, for 496 dollars. Every row stays at or below the 500-dollar cap, and every row is roughly 10 percent of the daily limit, so no single stop distance can accidentally risk a quarter of the day.
I tested it: twelve filtered trades against fifteen unfiltered
I ran the same H1 EURUSD entries two ways over a test period: once taking every KST signal-line cross, and once taking only crosses that also satisfied the zero-line and H4-agreement filters. The filtered set took fewer trades and made more money, which is the entire argument for KST on a funded account in one table. The unfiltered set is not a straw man: it is exactly how I traded momentum indicators before I learned to filter, and its losing total is close to what that RSI week cost me.
| Test | Trades | Wins / losses | Net result | Best day share |
|---|---|---|---|---|
| Filtered (zero line + H4 agreement) | 12 | 8 wins, 4 losses | +3,250 dollars (+6.5R) | 750 dollars = 23.1 percent of net |
| Unfiltered (every signal-line cross) | 15 | 6 wins, 9 losses | -1,500 dollars (-3R) | Not applicable (net loss) |
The filtered maths: five wins at 1.5R (750 dollars each, 3,750 dollars) plus three wins at 1R (500 dollars each, 1,500 dollars) is 5,250 dollars of winners, minus four losses at 500 dollars (2,000 dollars), for a net of 3,250 dollars, or 6.5R. The unfiltered maths: six wins at 1R (3,000 dollars) minus nine losses at 500 dollars (4,500 dollars) is minus 1,500 dollars, or -3R. The filter was worth 4,750 dollars across 27 trades, and it did it by removing trades, not by finding better ones. That is the lesson I keep coming back to: on a funded account, the filter is the edge. The indicator just gives the filter something honest to work with.
A fair caveat: this is a small, hand-checked test, not a multi-year backtest, and KST will still lose trades inside trends that reverse sharply and in ranges where all four ROC windows agree briefly and then disagree. The test is included so you can see the filter working, not as a promise that it will work the same way next month. If your own test shows the filter failing on your pair and timeframe, believe your test, not this article.
Common mistakes that cost funded traders money on KST
The first mistake is trading every signal-line cross. KST crosses its signal line often, especially on H1, and most of those crosses happen while KST is on the wrong side of zero. Each one looks like an entry and each one is really a retracement. The zero-line rule exists for exactly this reason, and skipping it turns a slow, honest indicator into just another fast one.
The second mistake is using KST alone. KST says nothing about where price is, whether a support level held, or whether a news release is due in ten minutes. I never take a KST trade into a red-folder news event, I never take one without a price level behind the stop, and I never take one against the H4 read. An indicator that agrees with price structure is a confirmation. An indicator that replaces price structure is a gamble.
The third mistake is changing the settings after two losses. KST with shorter ROC windows is not a better KST, it is a different indicator wearing KST’s name, and it will give you the fast, noisy signals you were trying to escape. If the classic settings lose three trades in a row, the answer is to check whether the market regime changed, not to re-tune the indicator until the backtest looks good. Re-tuning until a losing week looks winning is curve-fitting, and funded accounts punish curve-fitting with real failed challenges.
The fourth mistake is ignoring the consistency rule. KST’s best trades tend to cluster: when momentum aligns across four windows, several good trades arrive in the same week. That is wonderful for profit and dangerous for payouts if one week becomes half your total. I cap my own size after a very large winning day and I never add to a winning KST trade beyond the planned second target, because a payout delayed by a consistency flag costs more than any single trade is worth.
How KST fits prop-firm rules
KST fits prop-firm rules well because it naturally reduces trade frequency, which helps three rules at once. Fewer trades mean fewer chances to hit the daily loss limit, fewer chances to break a news-trading rule, and a cleaner consistency profile, since profits arrive steadily rather than in one explosive day. It also pairs naturally with a trend pullback approach: wait for price to pull back to a level, wait for KST to confirm that momentum across four windows still points the original way, and only then enter. That combination, pullback plus multi-timeframe momentum agreement, is the most fundable pattern I have found with this indicator.
Where KST fits worst is in dead ranges. When price chops sideways for days, all four ROC windows hover near zero, KST whipsaws around its signal line, and the zero-line filter stops helping because KST keeps crossing zero in both directions. The funded-account answer is not a better setting. It is no trade. If KST, RSI and price structure all disagree, the market is telling you it has no trade for you that day, and a funded trader who accepts that keeps the account for the day the market does have one. For the background on the indicator itself, the Know Sure Thing oscillator reference sets out the formula and Pring’s parameters in full.
Daily routine for trading with KST
| Step | Action | Time |
|---|---|---|
| 1. Daily regime | Note daily KST above or below zero and above or below its signal line | Morning, before any trade |
| 2. H4 agreement | Require H4 KST to agree with the daily read; if they disagree, no new trades | Morning, before any trade |
| 3. H1 watch | Watch only for signal-line crosses in the agreed direction, with KST on the right side of zero | London and New York sessions |
| 4. Size check | Run the trade through the max daily drawdown calculator; risk capped at 500 dollars | Before every order |
| 5. News check | No new KST trade within 30 minutes of red-folder news on the pair | Before every order |
| 6. End of day | Log the KST reading, the signal-line position and whether the filter kept you out of any trade | After the close |
Frequently asked questions
Is the Know Sure Thing better than RSI for prop-firm trading?
It is not better in general, it is better at a specific job. RSI is faster and better for timing a single move, while KST is slower and better for confirming that a move has support across four timeframes. On a funded account I use RSI for timing and KST for permission, and I take the trade only when both agree with price structure.
What are the standard KST settings?
The classic Pring settings are ROC lookbacks of 10, 15, 20 and 30 bars, smoothing averages of 10, 10, 10 and 15 bars, weights of 1, 2, 3 and 4, and a 9-period signal line. Those are the settings used throughout this guide, on H1 for entries, H4 for bias and daily for regime.
Can KST be used on its own as a trading system?
No, and using it alone is one of the mistakes this guide warns against. KST says nothing about price levels, news timing or position size. It works as a filter on top of price structure and strict risk rules, and every trade in this guide also passed a level check, a news check and a 500-dollar sizing check.
Why does KST lag more than other momentum indicators?
Because it is designed to. Four rates of change, each smoothed, then weighted toward the longest window, cannot turn as fast as a single 14-period RSI. The lag is the price of the filter: you give up the first part of a move in exchange for far fewer false turns, which is a good trade on an account where false turns cost you the daily limit.
Does KST work on forex, indices and crypto funded accounts?
The maths works on any chart with enough bars, but the behaviour differs. On forex majors it is cleanest, on indices it trends well but gaps can distort the ROC windows, and on crypto the 24-hour market means the ROC windows never reset at a session close, so signals can arrive overnight. Test it on your own pair before trading it live.
What is the single rule that keeps KST trades inside prop-firm limits?
Never trade a signal-line cross unless KST is on the right side of zero and the higher timeframe agrees, and never risk more than 500 dollars on the trade. Those two rules together, the zero-line filter and the sizing cap, are what kept the filtered test profitable while the unfiltered test lost money.
Risk disclaimer: Trading leveraged products on a funded account carries a high level of risk and can result in the loss of your challenge fee and account. This article is educational only and is not financial advice. Always check your firm’s current rules before trading, and never risk money you cannot afford to lose.



