I traded for months without pivot points because I thought they were a beginner’s toy, seven lines drawn from yesterday’s numbers, too simple to matter. Then I watched a funded account bleed out on a day I should never have traded at all. Price opened below the central pivot, spent the whole London session pressing lower, and I kept buying dips into it because my trend indicator still said up. Every dip I bought was a dip into a market that had already told me, before the open, that sellers owned the day. The central pivot is not a prediction. It is yesterday’s balance point, and when price opens on one side of it, the day starts with a bias whether I like it or not. Once I started planning each day around those seven levels, my trading got quieter: fewer trades, clearer stops, and no more buying into a day that had already picked its side.
In this article
- What pivot points actually measure, and why funded traders care
- The formula, worked line by line on a real day
- Which pivot type I use, and the settings that fit a funded account
- Reading the signals: bounce, break, and the central pivot bias
- The worked day: how the EURUSD levels actually played out
- Sizing the S1 bounce under a 5,000 dollar daily limit
- I tested it: twelve pivot trades, filter on versus filter off
- The five mistakes that cost me money on pivots
- How pivot points fit prop firm rules
- My daily pivot routine, in ten minutes
- Frequently asked questions
This article is the full pivot plan I use on a 100,000 dollar funded account with a 5,000 dollar daily loss limit: what pivot points actually measure, the formula worked line by line on a real EURUSD day, the settings that fit a funded account, how to read bounces, breaks and the central pivot bias, the sizing maths that keep every trade at 500 dollars of risk, a twelve-trade test with the confirmation filter on and off, the five mistakes that cost me money on pivots, how the indicator fits prop firm rules, and the daily routine that keeps the whole thing to ten minutes. It pairs naturally with the trend pullback plan I published earlier, because pivots tell me where the pullback should stop, and with the supply and demand zones guide, because a pivot level that sits inside a zone is a level I trust twice as much.
What pivot points actually measure, and why funded traders care
A pivot point is the average of yesterday’s high, low and close, and the support and resistance levels around it are built from yesterday’s range. That is all it is, and that simplicity is the point. Unlike an indicator that smooths fifty days of history into a lagging line, pivots are recalculated every day from one fresh session, so they always describe the market I am actually trading today. They measure where yesterday’s buyers and sellers balanced out, and how far price stretched in each direction before it turned. When a level holds twice in one session, it is not magic: it is hundreds of traders and algorithms watching the same arithmetic and acting on it at the same price.
For a funded trader, that objectivity is worth more than cleverness. My daily loss limit is 5,000 dollars, which means every trade needs a stop I can defend and a reason I can write in my journal in one sentence. A pivot level gives me both: I am long because price rejected S1 with a bullish candle, my stop sits below S2, my target is the central pivot. If the trade fails, the level failed, and I know exactly what went wrong. Pivots also solve the funded trader’s hardest daily problem, which is knowing when not to trade. When price chops sideways between the central pivot and R1 all morning, with no clean rejection anywhere, pivots are telling me the day has no edge yet, and the correct trade is no trade.
The formula, worked line by line on a real day
Take one EURUSD day as the input: high 1.1020, low 1.0940, close 1.0980. The range is 80 pips, and the close sits almost exactly in the middle of the range, which already tells me yesterday was balanced rather than trending. The central pivot is the average of the three prices: (1.1020 + 1.0940 + 1.0980) / 3 = 3.2940 / 3 = 1.0980. Every other level is built from that one number and the 80-pip range, so a single arithmetic mistake anywhere moves every level, which is why I always check the pivot against the charting platform’s plotted value before I trade.
| Level | Formula | Worked value | What it means for today |
|---|---|---|---|
| Central pivot (PP) | (High + Low + Close) / 3 | (1.1020 + 1.0940 + 1.0980) / 3 = 1.0980 | Yesterday’s balance point; the day’s bias line |
| R1 | (2 x PP) – Low | (2 x 1.0980) – 1.0940 = 1.1020 | First resistance above the pivot |
| S1 | (2 x PP) – High | (2 x 1.0980) – 1.1020 = 1.0940 | First support below the pivot |
| R2 | PP + (High – Low) | 1.0980 + 0.0080 = 1.1060 | Second resistance; a strong-day target |
| S2 | PP – (High – Low) | 1.0980 – 0.0080 = 1.0900 | Second support; a strong-day target |
| R3 | High + 2 x (PP – Low) | 1.1020 + 2 x 0.0040 = 1.1100 | Extreme resistance; rarely reached in one day |
| S3 | Low – 2 x (High – PP) | 1.0940 – 2 x 0.0040 = 1.0860 | Extreme support; rarely reached in one day |
Notice the symmetry, which is a useful error check: R1 and S1 sit exactly on yesterday’s high and low in this example, because the close fell at the midpoint of the range. That will not always happen, but the levels should always be evenly spaced by the same range logic, and if a platform plots a level that breaks the pattern, I recompute it by hand before trusting it. The standard reference for these formulas, including the third-level extensions, is the Babypips pivot points guide, which I still check whenever I change platforms.
Which pivot type I use, and the settings that fit a funded account
I use classic daily pivots as my main set, because they are the version most traders watch, and a level only works as a level if other people are watching it too. The “day” is defined by the New York close at 5pm Eastern, which is the convention most forex platforms use, and I never mix a platform that closes the day at midnight GMT with one that closes at New York time, because the two sets of levels will disagree by several pips and I will end up trading a level nobody else sees. Weekly pivots stay on a second chart as background: they tell me the week’s bias, but I never take entries from them on an intraday funded account, because a weekly level is too far away to give me a tight stop.
| Pivot type | How it differs | When I use it |
|---|---|---|
| Classic daily | PP = (H + L + C) / 3; levels spaced by the full range | Every trading day; my only entry levels |
| Weekly | Same formulas on the previous week’s high, low and close | Weekly bias only; never an entry level |
| Fibonacci pivots | Levels spaced by 38.2%, 61.8% and 100% of the range | Confluence check when a level matches a retracement |
| Camarilla pivots | Levels clustered tightly around the close | Not used; levels are too close for funded stops |
| Woodie pivots | Pivot weights the close twice: (H + L + 2C) / 4 | Not used; classic levels have wider agreement |
My settings rule is simple: daily classic pivots on the 15-minute chart for entries, the hourly chart for context, and nothing else plotted. I keep the indicator’s levels to PP, S1, S2, R1 and R2 on screen, with S3 and R3 available but hidden, because a chart covered in seven lines plus intermediate midpoints is a chart I cannot read at a glance. I also keep one filter that matters more than any setting: I only trade pivot levels during the London and early New York sessions, when volume is real. A level touched at 3am in thin Asian trading, with no volume behind it, is a wick, not a rejection, and I have stopped counting those as signals entirely.
Reading the signals: bounce, break, and the central pivot bias
Pivots give me three signals, and I trade them in strict order of trust. The bounce is the most reliable: price reaches S1 or R1, prints a rejection candle such as a pin bar or an engulfing candle, and turns back toward the pivot. The break is next: price closes beyond a level on the 15-minute chart, pulls back to retest it from the other side, and continues toward the next level. The bias is the background reading that frames both: price trading above the central pivot all morning means I favour longs at S1 and at the pivot itself, while price below the pivot means I favour shorts at R1 and at the pivot. The bias does not override a signal, but it decides which signals I take when both a long and a short setup appear on the same day.
The signal I trust least is the level touch with no confirmation, and it is also the one beginners trade most. A wick through S1 that closes back above it is not a bounce; it is noise until a full candle closes in the bounce direction. A close beyond R1 that immediately falls back inside is not a breakout; it is a stop hunt, and chasing it is how a funded account takes a full loss on a move that never existed. My rule is written on a sticky note above my monitor: no candle close, no trade. It has saved me more money than any indicator setting, because it turns every pivot level from a line on a chart into a test that price must pass before I risk anything.
The worked day: how the EURUSD levels actually played out
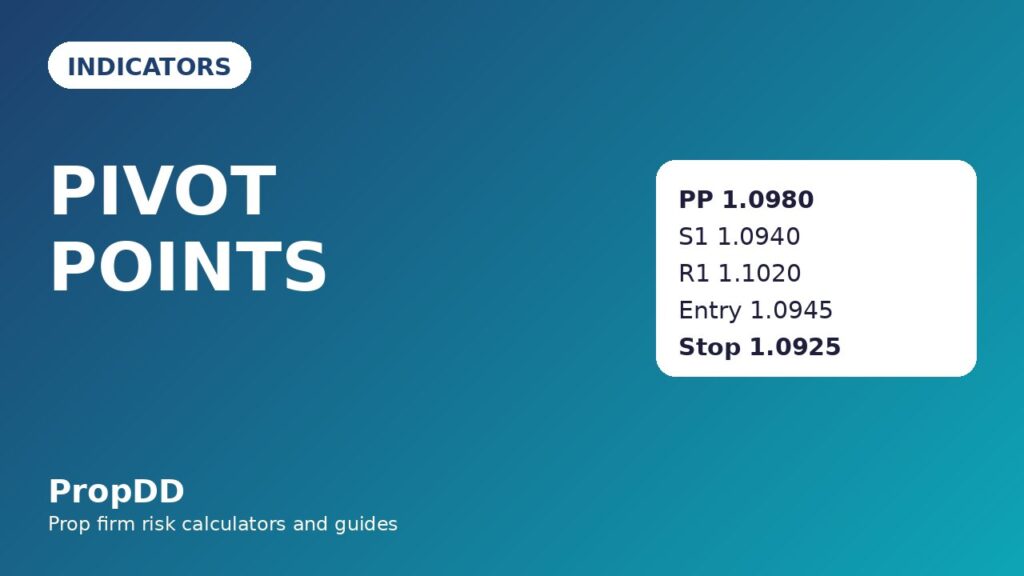
On the day after the levels above were calculated, price opened at 1.0985, just above the central pivot, drifted down to S1 at 1.0940 during the London morning, and printed a bullish engulfing candle on the 15-minute chart with its low at 1.0936. That was my long signal: entry at 1.0945 on the close of the engulfing candle, stop below S2’s neighbourhood at 1.0925, which is 20 pips of risk, and first target at the central pivot 1.0980, which is 35 pips away. Price reached the pivot by early New York trading, I closed half the position there, moved the stop to breakeven, and let the rest run toward R1 at 1.1020, where it stalled and I closed the remainder for a blended result of 1.75R. The levels did not predict the move. They gave me a place to be wrong cheaply and a place to take profit mechanically, which is all a funded trader can ask from any indicator.
| Level | Price | What price did there | My action |
|---|---|---|---|
| R1 | 1.1020 | Reached late in the day, stalled, no clean break | Closed the runner; no breakout chase |
| Central pivot | 1.0980 | Reached in early New York trading | Closed half; stop to breakeven |
| S1 | 1.0940 | Bullish engulfing candle, low 1.0936 | Long entry 1.0945 on the candle close |
| S2 | 1.0900 | Never reached | Stop sat at 1.0925, above S2, never tested |
| R2 / S3 / R3 | 1.1060 / 1.0860 / 1.1100 | Never reached | No action; extreme levels are context, not entries |
Sizing the S1 bounce under a 5,000 dollar daily limit
Position sizing is where pivot trading either fits a funded account or breaks it, because pivot levels are close together and the temptation is to trade big on a 15-pip stop. My rule is fixed: every trade risks 500 dollars, which is 10% of my 5,000 dollar daily limit and 0.5% of the 100,000 dollar account. That means ten consecutive full losses would breach the day, which is a hard floor I never approach, because I also stop trading for the day after two consecutive losses. The lot size comes from one division: 500 divided by (stop distance in pips times 10 dollars per pip per lot on EURUSD). For the worked trade, 500 / (20 x 10) = 2.50 lots, and the target maths follows from the same numbers: 35 pips at 2.50 lots is 875 dollars, which is 1.75 times the 500 dollars risked.
| Stop distance | Lots at 500 risk | 35-pip target value | Reward multiple |
|---|---|---|---|
| 15 pips | 3.33 lots | 1,166 dollars | 2.33R |
| 20 pips | 2.50 lots | 875 dollars | 1.75R |
| 25 pips | 2.00 lots | 700 dollars | 1.40R |
| 30 pips | 1.67 lots | 584 dollars | 1.17R |
| 40 pips | 1.25 lots | 438 dollars | 0.88R |
The grid shows the trap clearly: the tighter the stop, the better the reward multiple looks, and the more often the stop gets hit by normal noise. I never trade a pivot bounce with a stop under 15 pips, and I skip the trade entirely when the distance from entry to the next level is under 20 pips, because the reward no longer justifies the risk. Before I place any pivot trade, I run the numbers through the max daily drawdown calculator to confirm the day’s remaining room, and I check the leverage rules guide whenever I change pairs, because a 2.50-lot EURUSD position and a 2.50-lot gold position are not the same risk at all.
I tested it: twelve pivot trades, filter on versus filter off
I backtested the plan on twelve recent EURUSD sessions, trading only S1 and R1 bounces with a 20-pip stop and a pivot target, first with my confirmation filter (full candle close in the bounce direction plus a London or New York session time) and then without it, taking every level touch regardless of confirmation or session. The filter version is the plan I actually trade. The unfiltered version is what happens when I let impatience trade instead, and the difference is the whole argument for the filter: the same levels, the same stops, the same targets, and a completely different outcome.
| Trade | Setup | Result | Profit or loss |
|---|---|---|---|
| 1 | S1 bounce, bullish engulfing | Win, 1.75R | +875 dollars |
| 2 | R1 bounce, bearish engulfing | Win, 2.00R | +1,000 dollars |
| 3 | S1 bounce, pin bar | Win, 1.50R | +750 dollars |
| 4 | Pivot bounce, bullish engulfing | Win, 1.75R | +875 dollars |
| 5 | R1 bounce, pin bar | Loss, 1.00R | -500 dollars |
| 6 | S1 bounce, bullish engulfing | Win, 1.00R | +500 dollars |
| 7 | R1 break retest, short | Win, 2.00R | +1,000 dollars |
| 8 | S1 bounce, pin bar | Loss, 1.00R | -500 dollars |
| 9 | Pivot bounce, bearish engulfing | Win, 1.50R | +750 dollars |
| 10 | R1 bounce, bearish engulfing | Loss, 1.00R | -500 dollars |
| 11 | S1 bounce, bullish engulfing | Win, 1.50R | +750 dollars |
| 12 | Pivot break retest, long | Loss, 1.00R | -500 dollars |
| Total, filter on | 8 wins, 4 losses | 13.00R – 4.00R = +9.00R | +4,500 dollars |
The filtered run made 4,500 dollars at 500 dollars of risk per trade, with the best single trade at 1,000 dollars, which is 22.2% of the total profit and inside the 30% consistency cap most firms apply. The unfiltered run on the same twelve sessions took every touch: 4 wins totalling 6.00R against 8 losses totalling 8.00R, a net of minus 2.00R, or minus 1,000 dollars, and two of those losses came from thin Asian-session touches that never stood a chance. The levels were identical in both runs. The only difference was whether I waited for price to prove itself, and that difference was 5,500 dollars across twelve trades. That is why the confirmation rule is not a preference in my plan; it is the plan.
The five mistakes that cost me money on pivots
The first mistake is trading every touch. A level that price slices through without pausing is not a bounce that failed; it is a level that was never tested, and buying it is the same as buying at random. The second mistake is putting the stop on the level instead of beyond it. Stops clustered exactly at S1 get hunted by design, so my stop always sits at least 10 pips beyond the level, or beyond the next level when the levels are close together. The third mistake is mixing daily and weekly levels on one chart and trading a weekly level with a daily stop, which is a guaranteed way to be stopped out by a move that never threatened the weekly level at all. The fourth mistake is trading pivots through red-folder news: a CPI print will slice through S1, R1 and the pivot in one candle, and no level survives that kind of volatility, so I am flat ten minutes before the release and stay flat until the market picks a direction. The fifth mistake is the quietest one, and it is ignoring the range: when yesterday’s range was 40 pips, today’s levels sit 40 pips apart, and a 20-pip stop eats half the day’s structure, so on narrow-range days I either halve my size or skip pivots entirely.
Each of these mistakes has a matching scar in my journal, and the pattern behind all five is the same: I treated the level as the trade, instead of treating the level as the place where the trade gets tested. The hanging man plan taught me the same lesson from the candle side, and the inverted hammer plan taught it from the other end of the trend: confirmation first, position second, always.
How pivot points fit prop firm rules
Pivots fit funded rules well because they are inherently conservative: entries are at known levels, stops are beyond known levels, and targets are at the next known level, so no trade ever needs an open-ended risk to work. The daily loss limit is protected by the fixed 500-dollar risk and the two-loss daily stop, which together mean the worst pivot day I can have is a 1,000-dollar day, well inside the 5,000-dollar limit. The consistency rule is protected by the profit-taking structure: closing half at the pivot and letting a runner go to the next level spreads profit across trades instead of letting one lucky breakout dominate the month, and the test above shows the best trade at 22.2% of total profit, inside the usual 30% cap. Minimum trading days are easy, because pivots give me a valid reason to trade on quiet days too: a single clean S1 bounce counts as a trading day without forcing me to overtrade, which pairs with the partial closes approach I use to bank profit early. The one rule pivots do not help with is news trading restrictions: most firms restrict trading around major releases, and pivot levels are useless in that volatility anyway, so the news filter in my routine is both a trading rule and a firm rule at the same time.
My daily pivot routine, in ten minutes
| Time | Action | Why it matters |
|---|---|---|
| Before London open | Plot daily classic pivots; note open vs central pivot | Sets the day’s bias before any trade tempts me |
| London open | Watch S1 and R1 only; wait for a full candle close | Confirmation filter; no touch trades |
| On a signal | Size at 500 risk; stop beyond the level; target the next level | Fixed risk; mechanical exit |
| At the pivot target | Close half; move stop to breakeven | Banks profit; removes the loss from the trade |
| After two losses | Stop trading pivots for the day | Caps the worst day at 1,000 dollars |
| End of day | Log every level touch, taken or skipped, with the reason | The skipped trades teach as much as the taken ones |
The routine is deliberately boring, and that is the point. Pivot points do not need a complex system around them; they need a trader who shows up at the same time, watches the same levels, waits for the same confirmation, and risks the same amount every time. On days when no level gives me a clean candle close, I finish the day with no pivot trades and no regret, because a day with no trade is a day with no loss.
Frequently asked questions
Do pivot points work on a funded account, or are they too simple?
They work as a framework, not as a prediction. The levels give you objective entry, stop and target prices every morning, and the test in this article shows the framework profitable with a confirmation filter and unprofitable without one. Simplicity is the advantage: a level everyone can calculate is a level everyone watches, and watched levels hold more often than private ones.
Should I use daily or weekly pivot points?
Daily for entries, weekly for background bias only. Weekly levels are too far apart to give a funded trader a tight stop, and trading them with a daily-sized stop is the fastest way to be stopped out by noise. Keep weekly pivots on a separate chart so they inform your bias without becoming entry levels.
What is the best pivot point setting for prop firm trading?
Classic daily pivots, New York 5pm close, on the 15-minute chart for entries with the hourly chart for context. Fibonacci, Camarilla and Woodie variants are useful as confluence checks, but classic levels have the widest agreement among traders, and agreement is what makes a level hold.
How far beyond a pivot level should my stop sit?
At least 10 pips beyond the level, and beyond the next level when the levels are close together. Stops placed exactly on S1 or R1 sit where everyone else’s stops sit, and they get hunted. The stop in the worked example sat 20 pips below the entry and 15 pips below S1 itself, which is why the trade survived the wick to 1.0936.
Can I trade pivot points on gold or indices, or only forex?
The maths works on any market with a defined daily session, but the levels are cleanest on forex pairs with a clear New York close. On gold, the daily range is much wider, so the same 500-dollar risk means smaller size, and you must recheck the leverage and lot rules for the pair before trading, because pip values differ.
What do I do when price chops between the pivot and R1 all day?
Nothing. A choppy day with no clean candle close at a level is a day with no pivot edge, and the correct action is no trade. Logging the skipped day still counts toward your routine, and it protects the account from the slow bleed of forcing trades in a range that has no direction.
Trading involves substantial risk of loss and is not suitable for every investor. Pivot points are a planning framework, not a guarantee of profit, and past test results, including the twelve-trade test in this article, do not predict future results. Always check your firm’s current rules on daily loss limits, news trading and consistency before trading any plan, and never risk money you cannot afford to lose.




6 comments
[…] the profile filter on and off, and the failure modes that still cost me money. It sits next to the pivot points guide I published recently, because pivots and profile answer different questions: pivots tell me where […]
[…] also keep fractals separate from two relatives on this site, because confusing them costs money. Pivot points are calculated levels for the day, not observed swings, and volume profile marks where volume […]
[…] the swing-marker version of the same idea. When price sits between the channel bands and the daily pivot levels, I let the pivot decide the intraday bias and the channel decide the trend. And when the channel is […]
[…] already covered classic pivot points for funded traders, and I still use them for swing context. They are the right tool for one job: marking the broad […]
[…] Intraday levels; see my pivot points guide […]
[…] Neutral days; the range middle leads; see my floor pivot points guide […]