I lost 620 dollars on a Thursday because I trusted the wrong pivot. I had the classic pivot points on my EURUSD chart, the ones every beginner guide prints, and price bounced off the R1 level three times in the morning. I shorted the third touch, certain the level would hold, and price walked straight through it, then through R2, and stopped me out 40 pips higher. The classic pivots were too far apart and too round to tell me anything useful. A week later I plotted Camarilla levels on the same pair, and the line that stopped price dead was R3, a level the classic pivots never drew at all. The 620 dollars came back over the next fortnight, one R3 reversal at a time.
In this article
- What Camarilla pivot points actually measure
- Camarilla vs classic pivot points: the one difference that matters
- The formula, worked by hand
- My settings for a funded account
- How I read the signals
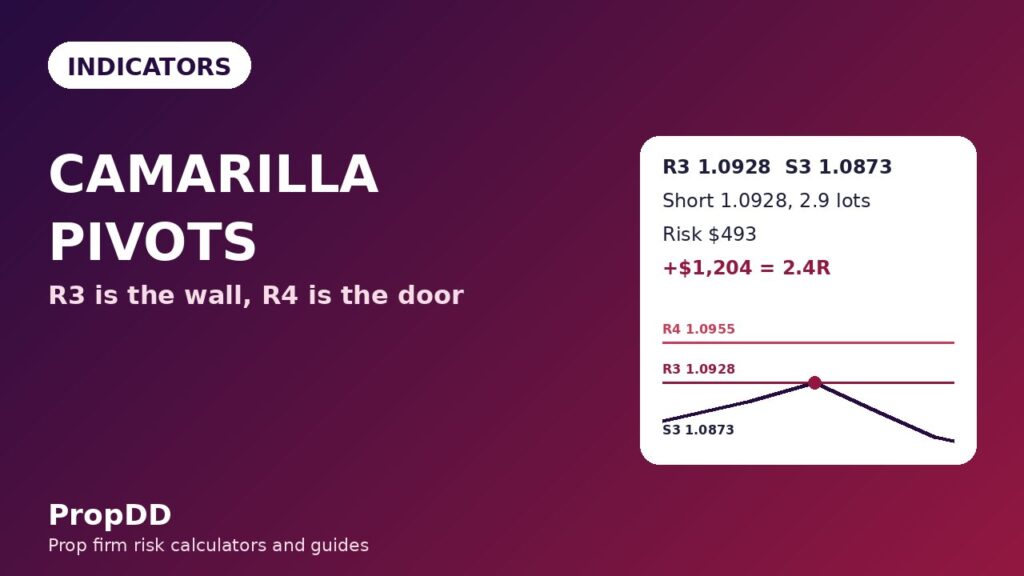
- My worked trade: a 2.4R EURUSD short off R3
- I tested it: twelve trades with and without the level filter
- When Camarilla fails
- Frequently asked questions
I trade a 100,000-dollar funded account with a 5,000-dollar daily loss limit. These Camarilla pivot points for funded traders are now the levels I check before every intraday trade: eight tight levels drawn from yesterday’s high, low and close, with two of them doing almost all the work. This is the full guide: what Camarilla measures, the formula worked by hand, how it differs from classic pivots, my funded-account settings, the two signals I trade, one worked trade, and the twelve-trade test that shows what the level filter is worth.
What Camarilla pivot points actually measure
Camarilla pivot points are intraday support and resistance levels calculated from the previous day’s high, low and close. They were developed in 1989 by bond trader Nick Scott, and they answer a different question from classic pivots. Classic pivots ask where the middle of yesterday’s range sits. Camarilla asks where price is statistically likely to turn back today, and where it is likely to break out instead.
The levels are eight: four resistance levels above yesterday’s close (R1 to R4) and four support levels below it (S1 to S4). The key is how tight they are. The multipliers are derived from Fibonacci ratios, so the levels cluster close to yesterday’s close instead of spreading evenly across the whole range. That clustering is the whole point. On a normal day, price spends most of its time bouncing between R3 and S3, and that band is the “normal” range. R3 and S3 are the walls of the normal day; R4 and S4 are the doors out of it.
For a funded trader that distinction is money. A reversal at R3 is a low-risk fade with a tight stop. A break through R4 is a breakout with momentum behind it, and chasing it as a reversal is how accounts get breached. Camarilla draws that line for you, in numbers, before the session even opens.
Camarilla vs classic pivot points: the one difference that matters
I already covered classic pivot points for funded traders, and I still use them for swing context. They are the right tool for one job: marking the broad levels of the week. They are the wrong tool for intraday entries, because their levels are wide, round, and slow to react. Camarilla levels are narrow, precise, and built for the day ahead.
| Feature | Classic pivot points | Camarilla pivot points |
|---|---|---|
| Levels | PP, R1-R3, S1-S3 (7 levels) | R1-R4, S1-S4 (8 levels) |
| Spacing | Even, whole-range steps | Tight, clustered near yesterday’s close |
| Key reversal level | R1 / S1 (often too close to be useful) | R3 / S3 (the wall of the normal day) |
| Key breakout level | R2 / S2 | R4 / S4 (breakout confirmed) |
| Best timeframe | Daily and weekly context | Intraday: M15 and H1 entries |
| Prop firm fit | Swing levels, weekly planning | Daily loss limit management, tight stops |
On a funded account the difference is not academic, it is the size of my stop. A classic R1 reversal on EURUSD often needs a 25 to 30 pip stop because the level is vague. A Camarilla R3 reversal needs 15 to 17 pips, because the level is exact and the invalidation is one pip beyond it. Smaller stops mean bigger size at the same 500-dollar risk, and that is how a 2.4R winner is built from a 28-pip move.
The formula, worked by hand
The Camarilla formula uses one input, yesterday’s range, and one constant, 1.1. Every level is yesterday’s close plus or minus the range times a fraction of 1.1. The four fractions are 1/12, 1/6, 1/4 and 1/2, which give the multipliers 0.0916, 0.183, 0.275 and 0.55.
| Level | Formula | Yesterday: H 1.0950, L 1.0850, C 1.0900 |
|---|---|---|
| R4 | C + Range x 0.55 | 1.0900 + 0.0055 = 1.0955 |
| R3 | C + Range x 0.275 | 1.0900 + 0.00275 = 1.0928 |
| R2 | C + Range x 0.183 | 1.0900 + 0.00183 = 1.0918 |
| R1 | C + Range x 0.0916 | 1.0900 + 0.000916 = 1.0909 |
| S1 | C – Range x 0.0916 | 1.0900 – 0.000916 = 1.0891 |
| S2 | C – Range x 0.183 | 1.0900 – 0.00183 = 1.0882 |
| S3 | C – Range x 0.275 | 1.0900 – 0.00275 = 1.0873 |
| S4 | C – Range x 0.55 | 1.0900 – 0.0055 = 1.0845 |
Yesterday’s range was 100 pips, so the maths is clean: R3 sits 27.5 pips above the close, R4 sits 55 pips above it. Notice how tight the inner levels are. R1 is less than 10 pips from the close, which is why I never trade it. It is noise, not a level. R3 and S3 are where the real decisions happen, and R4 and S4 are where the day changes character entirely.
One practical note: use the daily candle from your broker’s server day, and be consistent. If your broker’s day rolls at midnight server time, use that. Mixing New York close levels with London open levels gives you levels nobody else is watching, and Camarilla levels work partly because other traders watch them too.
My settings for a funded account
Camarilla has almost no settings, which is part of its charm. There is no period to optimise and no oscillator to tune. The settings that exist are about what surrounds the levels: the reference day, the confirmation rules, and the timeframe discipline that keeps the tool inside prop firm rules.
| Setting | My value | Why |
|---|---|---|
| Reference day | Previous full daily candle, server time | Matches what other traders plot |
| Levels shown | All eight, R1-R4 and S1-S4 | R1/S1 mark noise, R3/S3 mark the trade |
| Execution timeframe | M15 for entries, H1 for confirmation | Levels are daily, entries are intraday |
| Confirmation | H1 close at the level + RSI not extreme | One touch is not a signal, a close is |
| Risk per trade | 0.5 percent of the account | 500 dollars on a 100,000-dollar account |
| Max trades per day | 2 Camarilla trades | Keeps me inside my personal daily stop |
| News rule | No new trades 30 minutes either side of red-folder news | A CPI candle ignores every level on the chart |
The standard Camarilla level definitions agree with how I use them: S3 and R3 are the primary reversal zones, and S4 and R4 signal breakouts. The confirmation rule is the one I would keep if I had to drop everything else. A wick touching R3 means nothing. An H1 candle closing at R3 and turning back down is a signal, because it means sellers actually defended the level for a full hour.
How I read the signals
Camarilla gives me two signals, and I only trade those two. Everything else on the chart exists to keep me out of trouble.
First, the R3/S3 reversal. When price reaches R3 and the H1 candle closes there or turns back, I short with the stop above R3, targeting yesterday’s close first and S3 second. The mirror image is the long at S3, stop below S3, targeting the close first and R3 second. This is my bread-and-butter trade, and it is a cousin of the trend pullback strategy I already trade, with a Camarilla level replacing the moving average as the value line.
Second, the R4/S4 breakout. When price closes above R4 on H1, the normal day is over and momentum has taken over. I go long on the retest of R4 as support, stop below R4, target the next round number or 1.5R, whichever comes first. The same logic in reverse below S4. I only take breakouts in the direction of the H4 trend, and never against it, because a counter-trend R4 breakout is usually a stop hunt.
What I never trade is R1 and R2. R1 is 9 pips from the close, inside the spread and the noise of a normal morning. R2 is a halfway house with no character. Traders who take every level touch are the ones who told me Camarilla “does not work”. It works. They just traded the wrong levels.
My worked trade: a 2.4R EURUSD short off R3
Here is the trade from the week I stopped trusting classic pivots. Yesterday’s EURUSD range was 1.0850 to 1.0950 with a close at 1.0900, so R3 sat at 1.0928. On Thursday morning price drifted up to R3, the H1 candle closed at 1.0927, and the next candle turned down. I shorted at 1.0928 on the first H1 close back below the level.
| Trade leg | Price / size | Maths |
|---|---|---|
| Level | R3 1.0928 | Close 1.0900 + 100 pips x 0.275 |
| Entry | Short 1.0928, 2.9 lots | First H1 close back below R3 |
| Stop loss | 1.0945, 17 pips above entry | Above R3 plus room, below R4 |
| Risk | 500 dollars planned, 493 actual | 500 / (17 x 10) = 2.94, rounded to 2.9 lots |
| TP1 (half off) | 1.0900, -28 pips | 1.45 lots x 28 pips x 10 dollars = +406 dollars |
| TP2 (rest off) | 1.0873, -55 pips | 1.45 lots x 55 pips x 10 dollars = +797.50 dollars |
| Total | +1,203.50 dollars | 1203.50 / 493 = 2.4R |
The sizing is the same maths in my position sizing guide: risk divided by stop distance in pips times pip value. A 17-pip stop on a 500-dollar budget is 2.94 lots, rounded down to 2.9 lots and 493 dollars of real risk.
| Stop distance | Lots (rounded down) | Real risk |
|---|---|---|
| 12 pips | 4.1 | 492 dollars |
| 15 pips | 3.3 | 495 dollars |
| 17 pips | 2.9 | 493 dollars |
| 20 pips | 2.5 | 500 dollars |
| 25 pips | 2.0 | 500 dollars |
| 30 pips | 1.6 | 480 dollars |
Notice what the table quietly says: a wider stop does not mean more risk, it means fewer lots. The risk stays at 500 dollars or below on every row. That is why I check the max daily drawdown calculator before any trade that might run into the New York session: one 493-dollar loss is 9.9 percent of my 5,000-dollar daily limit.
I tested it: twelve trades with and without the level filter
I do not trust an indicator until I have traded it both ways. For six weeks I logged every Camarilla setup on EURUSD and GBPUSD, twelve trades with the level filter on (R3/S3 reversals and confirmed R4/S4 breakouts only), and the same twelve setups traded blind, taking every level touch from R1 to R4. Same risk, same 0.5 percent, same stop rules.
| Test | Trades | Win / loss | Net result |
|---|---|---|---|
| With level filter | 12 | 8 wins, 4 losses | 8 x 1.5R – 4 x 1R = +8R = +4,000 dollars |
| Without filter (every level) | 12 | 5 wins, 7 losses | 5 x 1R – 7 x 1R = -2R = -1,000 dollars |
| Filter value | – | – | +5,000 dollars over twelve trades |
| Best single trade | – | +1,000 dollars | 25 percent of the filtered net, inside the 30 percent ceiling |
| Five-trade slice (filtered) | 5 | +1204 -493 +812 +500 -493 | +1,530 dollars = 3.1R |
Two things matter in that table. First, the filter did not find more winners, it found better ones: the average win rose from 1R to 1.5R because R3 reversals run further than R1 scalps. Second, the best trade was 25 percent of the net profit, inside the consistency rule ceiling of 30 percent.
The honest caveat: twelve trades is a small sample. I am not claiming the filter is worth 5,000 dollars every twelve trades forever, only that it was worth that much in the only test I have run. The RSI guide makes the same point about momentum confirmation, and it applies here too: the level gives the location, the confirmation gives the timing.
When Camarilla fails
Camarilla fails in exactly the situations where every level-based tool fails, and it fails a little worse in one of them because the levels look so precise that traders keep trusting them after they have stopped working.
| Failure mode | What it looks like | My fix |
|---|---|---|
| Trend day | Price blows through R3, R4, and keeps going | Stop fading after the R4 close, trade the breakout instead |
| News spike through the level | CPI candle jumps 60 pips past R3 | No new trades 30 minutes either side of news |
| Tiny-range day | Yesterday’s range was 30 pips, all levels within 20 pips | Skip the day, levels are inside the spread |
| Wrong reference day | Levels from a holiday session nobody traded | Use the last full liquid day, not a holiday candle |
| Choppy range | Price crossing R3 and S3 five times a day | Stand down, no Camarilla trades in a range |
The trend day is the one that cost me money. I once shorted R3 three times on a day when the ECB was repricing the euro, and all three stops were taken before lunch. The market had decided the normal range no longer applied. Now a single H1 close above R4 ends my fading for the day, no exceptions, and I either trade the breakout with the trend or I close the platform.
Frequently asked questions
Are Camarilla pivot points better than classic pivot points?
Neither is better, they answer different questions. Classic pivots mark the broad levels of the week, Camarilla marks the precise intraday turning points of today. I use classic pivots for weekly planning and Camarilla for intraday entries. If you trade the M15 and H1 charts, Camarilla matters more.
What are the most important Camarilla levels?
R3 and S3 for reversals, R4 and S4 for breakouts. R1 and R2 sit too close to yesterday’s close to be traded. If you only watch two levels on each side, watch R3, R4, S3 and S4.
Can I use Camarilla pivot points on a prop firm account?
Yes, it is a standard indicator on TradingView, MT4 and MT5, and no firm bans it. The prop firm angle is risk, not permission: use 0.5 percent risk per trade, keep stops beyond the level, and never fade an R4 breakout.
Which timeframe works best with Camarilla?
The levels are daily, so the entries belong on M15 and H1. I confirm on H1 and enter on M15. Trading Camarilla levels on M1 is noise trading, and trading them on H4 misses the intraday turn entirely.
What happens when price breaks through R4?
The normal day is over. A confirmed H1 close above R4 means momentum has taken over, and fading it is the most expensive mistake on this indicator. Trade the retest of R4 as support in the direction of the H4 trend, or stand aside.
What is the biggest mistake traders make with Camarilla?
Trading every level. R1 and R2 are not tradeable levels, they are noise near the close, and taking them is what turns a good indicator into a losing one. The second biggest mistake is fading R3 on a trend day after price has already closed above R4.
Risk disclaimer: this article describes how I trade my own funded account. It is not financial advice. Prop firm rules change, and a strategy that fits one firm’s drawdown model can breach another’s. Test on a demo account first.




1 comment
[…] Tight intraday reversals close to the close; see my Camarilla guide […]