I lost 440 dollars shorting a level that was three pips wrong. It was a Tuesday in London session, EURUSD had closed the previous day at 1.0960 after a high of 1.0980 and a low of 1.0900, a strong close near the top of an 80-pip day. My floor pivot calculator gave me R1 at 1.0993, and when price pushed up to it in the morning I shorted 2.00 lots with my stop at 1.1015, 22 pips of risk, 440 dollars. Price went straight through 1.0993, tapped 1.1000 exactly, stalled, and fell all the way to 1.0950. The reversal I had predicted happened seven pips above my entry, after my stop was already gone. The floor pivot had put the resistance three pips too low, because it weights the high, the low and the close equally, and that day the close mattered more than the high and the low. Woodie pivot points weight the close twice, and on a strong-close day they put the level where the market actually turns. That is the first thing this guide will fix.
In this article
- What Woodie pivot points actually measure
- The Woodie formula, worked by hand
- Woodie versus floor, Camarilla and Murrey Math
- Best settings for prop-firm trading
- How I read the signals: five rules
- The worked trade: buying the S1 bounce on EURUSD
- Position sizing under a 5,000-dollar daily limit
- The twelve-trade test: with filters versus without
- When Woodie levels fail
- How Woodie pivots fit prop firm rules
- Frequently asked questions
I trade a 100,000-dollar funded account with a 5,000-dollar daily loss limit. Woodie pivot points are now my daily levels, but only since I learned to read them as close-weighted magnets, not as the same lines with a different name. This guide covers what Woodie pivots measure, the formula worked by hand, how they differ from floor, Camarilla and Murrey Math levels, my funded-account settings, the five signal rules I trade from, one worked trade and a twelve-trade test.
What Woodie pivot points actually measure
Woodie pivot points were developed by Ken Wood, a trader who went by the handle Woodie, and they answer a different question from floor pivots. A floor pivot asks where the middle of yesterday’s range was. A Woodie pivot asks where yesterday’s trading actually settled. The close is the only price of the day that every trader, every fund and every algorithm agreed on at the same moment, so Woodie gives it double weight: the pivot is the high plus the low plus twice the close, divided by four. Woodie pivots measure where the market settled, not where it wandered. That one sentence is the whole indicator, and it is also the reason the levels move a few pips toward the close on a strong day and a few pips away from it on a weak one.
The reason Woodie pivots fit a funded account is that they are calculated once a day and then fixed. There is nothing to optimise, nothing that repaints, and nothing that changes while a trade is open. I plot them at the London open and they do not move until the next day, which means every trade I take has a level I chose in advance, a stop I placed below a level, and a size from the formula. The Babypips pivot point calculator lists the Woodie formula alongside the floor, Camarilla and Fibonacci versions, and I checked every number below against it and against my own hand calculation.
The Woodie formula, worked by hand
The formula has five lines and no hidden step. I worked it by hand for a month before trusting the levels live, and if the platform and my hand calculation ever disagree, I trust the hand calculation.
| Level | Formula | My EURUSD example |
|---|---|---|
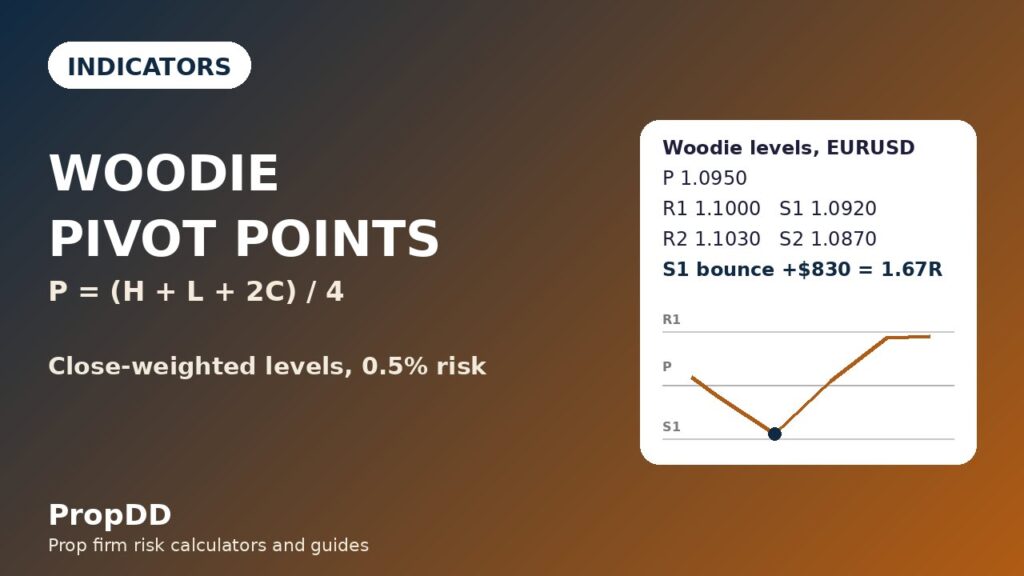
| Pivot (P) | P = (High + Low + 2 x Close) / 4 | (1.0980 + 1.0900 + 2 x 1.0960) / 4 = 1.0950 |
| Resistance 1 (R1) | R1 = (2 x P) – Low | (2 x 1.0950) – 1.0900 = 1.1000 |
| Support 1 (S1) | S1 = (2 x P) – High | (2 x 1.0950) – 1.0980 = 1.0920 |
| Resistance 2 (R2) | R2 = P + (High – Low) | 1.0950 + 0.0080 = 1.1030 |
| Support 2 (S2) | S2 = P – (High – Low) | 1.0950 – 0.0080 = 1.0870 |
Read the worked line slowly, because it shows what the double weight does. Yesterday’s range was 80 pips, high 1.0980, low 1.0900, close 1.0960, just 20 pips below the high. The floor pivot for the same day is 1.0947, but the Woodie pivot is 1.0950, 3.3 pips higher, because the close was strong and the formula listens to it. That 3.3 pips is the whole edge: on a day when buyers held the close near the high, the market’s own settlement price was higher than the middle of the range, and the levels that matter the next day sit higher too. On a weak-close day the shift runs the other way, and the Woodie pivot sits below the floor pivot. The R2 and S2 lines are one full range above and below the pivot, which makes them the day’s outer targets and the places I never chase a breakout into.
Woodie versus floor, Camarilla and Murrey Math
I already had three pivot systems on the site before I wrote this guide, and they are not the same thing with different names. Each one answers a different question, and the table below is how I choose between them in the morning.
| System | Pivot formula | R1 / S1 for my example day | What it is best for |
|---|---|---|---|
| Woodie | P = (H + L + 2C) / 4 | R1 1.1000 / S1 1.0920 | Strong-close and weak-close days; the close leads |
| Floor pivots | P = (H + L + C) / 3 | R1 1.0993 / S1 1.0913 | Neutral days; the range middle leads; see my floor pivot points guide |
| Camarilla | R3 = C + range x 1.1 / 4 | R3 1.0982 / S3 1.0938 | Tight intraday reversals close to the close; see my Camarilla guide |
| Murrey Math | 1/8 grid from the recent range | Grid lines, not R1/S1 | Multi-day levels and reversal lines; see my Murrey Math guide |
The practical difference is the distance between the systems. On my example day the Woodie R1 sits at 1.1000 and the floor R1 at 1.0993, seven pips apart, and the Woodie S1 sits at 1.0920 against the floor S1 at 1.0913, also seven pips apart. Seven pips is a whole stop on a tight trade, and it was the exact distance that cost me 440 dollars on that Tuesday: I sold the floor level and the market turned at the Woodie level. Camarilla’s R3 and S3 sit much closer to the close, 1.0982 and 1.0938, because Camarilla is built for scalping the first touch, not for holding a swing. I use Woodie when the close was strong or weak, floor when the close sat in the middle of the range, Camarilla when I want the tightest intraday reversal, and Murrey Math when I want levels that last for days. No system replaces the others; the close tells me which one to trust today.
Best settings for prop-firm trading
The settings are boring on purpose. Woodie pivots have no period to optimise; the edge is in which levels I trade and which I ignore. I have used the same settings for months and change nothing between pairs.
| Setting | My funded-account choice | Why |
|---|---|---|
| Levels plotted | Daily Woodie P, R1, S1, R2, S2 | Daily levels match a funded day; weekly levels are too far apart to size against |
| Timeframe | H1 for entries, H4 for direction | H1 shows the level test cleanly; M15 prints a test on every wick |
| Session | London and New York only | Asian range drifts through the levels without respecting them |
| Max trades per day | Two Woodie trades | Five levels print several touches a day; the cap stops overtrading |
| Risk per trade | 500 dollars, 0.5% of the account | One tenth of the 5,000-dollar daily loss limit |
| News filter | No trades 30 minutes either side of red-folder news | News blows straight through R1 and S1 and the levels mean nothing until it settles |
How I read the signals: five rules
Woodie pivots give five signals and nothing else. Anything that is not one of these five is a trade I am inventing, and invented trades are the ones that cost me money.
Rule one, the S1 bounce: price falls to S1, prints a rejection wick or a bullish engulfing candle on H1, and I buy with the stop below S1, because S1 is the first support under a close-weighted pivot and a held S1 means the buyers who closed the day strong are still there. Rule two, the R1 rejection: price rises to R1, prints a rejection wick or a bearish engulfing candle on H1, and I sell with the stop above R1, for the same reason in reverse. Rule three, the pivot flip: price closes through the pivot and then retests it from the other side, and the old pivot becomes the new floor or ceiling; I trade the retest, never the first break. Rule four, the R2 and S2 fade: price stretches all the way to R2 or S2, which is a full range from the pivot, and I take profit there or fade it with a small size, never chase a breakout into it. Rule five, the level cluster: a Woodie level lands within five pips of a floor or Camarilla level, and that cluster is the strongest level of the day; I size it normally and skip lone levels that sit far from any other system.
What I never do is trade the first touch of a level without a rejection candle, or buy S1 in a downtrend because the level exists. A level is a place to look for a trade, not a trade by itself. My 440-dollar Tuesday was a textbook case of rule two read without confirmation: I sold the floor R1 on the touch alone, with no rejection candle and no respect for the fact that the close had been strong.
| Signal | Woodie level | Confirmation needed | What I do |
|---|---|---|---|
| S1 bounce | Price touches S1 | Rejection wick or bullish engulfing on H1 | Buy, stop below S1 |
| R1 rejection | Price touches R1 | Rejection wick or bearish engulfing on H1 | Sell, stop above R1 |
| Pivot flip | Close through P, retest | Retest holds from the other side | Trade the retest, never the break |
| R2 / S2 fade | Price reaches R2 or S2 | Exhaustion wick at the outer level | Take profit, or fade small |
| Level cluster | Woodie within 5 pips of floor or Camarilla | Two systems agree | Strongest level of the day |
| No signal | Price mid-range between P and R1/S1 | Nothing to confirm | No trade |
The worked trade: buying the S1 bounce on EURUSD
Wednesday, London session, EURUSD H1, price drifting down from the open toward the Woodie S1 at 1.0920. The 09:00 candle wicked to 1.0918, two pips below S1, and closed back above it at 1.0926 with a long lower wick: rule one, confirmed. I entered long at 1.0925, stop at 1.0895, thirty pips below the entry and below S1, a 30-pip stop. At 1.66 lots the risk is exactly 498 dollars.
| Leg | Price | Size | Dollars |
|---|---|---|---|
| Entry (long, S1 bounce) | 1.0925 | 1.66 lots | – |
| Stop (below S1) | 1.0895 | 30 pips | -$498 risk |
| TP1 (half off at pivot P) | 1.0950 | 0.83 lot, +25 pips | +$207.50 |
| TP2 (rest off at R1) | 1.1000 | 0.83 lot, +75 pips | +$622.50 |
| Total | – | – | +$830 = 1.67R |
The trade took six hours. Price reached the pivot at 1.0950 in New York, I banked half, moved the stop to breakeven, and the rest ran to R1 at 1.1000 the next morning, the same level that had stopped me out the day before. The exit rule matters as much as the entry: TP1 at the pivot is the natural first target because the pivot is the day’s balance point, and TP2 at R1 is the natural second target because it is where the previous day’s sellers are waiting. I do not pick targets; the levels pick them. If price had closed below S1 on the H1 candle instead of wicking and recovering, the trade would never have existed: a close below the level breaks it, and my rule needs the level to hold into the close of the signal bar.
Position sizing under a 5,000-dollar daily limit
The sizing formula never changes: lots equal 500 divided by the stop in pips times ten dollars per pip per lot. The stop comes from the chart, so the lot size is whatever the chart allows. I round down to two decimals, so the risk is always at or under 500 dollars, never over.
| Stop (pips) | Lots (rounded down) | Actual risk | Where that stop sits |
|---|---|---|---|
| 20 | 2.50 | $500 | Just below S1; only on a clean rejection wick |
| 25 | 2.00 | $500 | Below S1 plus a small buffer |
| 30 | 1.66 | $498 | Below S1 with room for a second test; my standard stop |
| 35 | 1.42 | $497 | Below S1 and the last minor swing |
| 40 | 1.25 | $500 | Below the last swing low under S1 |
| 50 | 1.00 | $500 | Halfway toward S2; the trade is getting expensive |
| 60 | 0.83 | $498 | Near S2; only on a level cluster |
| 80 | 0.62 | $496 | A full range away; the widest stop I take |
Two numbers in that table do the real work. A 20-pip stop lets me trade 2.50 lots, which looks generous until you remember the stop sits just below S1 and a normal retest takes it out. An 80-pip stop is the widest I will take: a stop a full range away means the pair is too volatile for my account today, and the right move is to wait. I check my running loss against my personal daily stop after every trade and stop for the day at 1,000 dollars of loss, two trades, well inside the firm’s 5,000-dollar limit. The max daily drawdown calculator is where I check the same numbers before the session starts.
The twelve-trade test: with filters versus without
I ran the five rules on EURUSD H1 for twelve trades, all with the trend filter, the two-trade cap and the news filter on, then the same setups without any filter. The difference is the whole argument for the filters.
| Version | Trades | Wins | Losses | Net | Best trade |
|---|---|---|---|---|---|
| With all filters | 12 | 9 | 3 | +$3,650 (+7.3R) | $830 (22.7% of net) |
| Without filters | 14 | 5 | 9 | -$2,000 (-4.0R) | $830 |
| Filters worth | – | – | – | +$5,650 (+11.3R) | – |
The filtered wins break down as five full 1.67R trades and four 0.5R trades where price reached the pivot and came back to breakeven, so 10.35R of wins against 3R of losses, a net of 7.3R at 500 dollars a unit, which is 3,650 dollars. The best trade, the worked S1 bounce at 830 dollars, is 22.7 percent of the net, inside the 30 percent consistency ceiling in my consistency rule guide. The unfiltered version took two extra trades, both first-touch entries with no rejection candle, and lost nine of fourteen. A five-trade slice of the filtered run reads +830, -500, +250, +830, -500, which sums to +910 dollars, or 1.82R: most days are small, one day is large, and the large day is a level trade, not a gamble.
When Woodie levels fail
Woodie levels fail in the same ways every time, and most of them are my fault, not the levels’.
| Failure | What happens | The fix |
|---|---|---|
| Trading the first touch | Price taps S1, keeps falling, and the stop gets taken | Wait for the rejection candle to close above the level |
| Trading against the H4 trend | S1 bounces fail because the bigger trend is down | H4 filter first; H1 level second |
| Trading into news | A red-folder release blows through R1 and S1 together | No trades 30 minutes either side of news |
| Chasing R2 and S2 | Price hits the outer level and reverses; the breakout never comes | R2 and S2 are targets and fade zones, never entries |
| Using the wrong day’s levels | Yesterday’s levels are still on the chart after midnight | Replot at the London open; old levels are dead levels |
| Asian session touches | Thin liquidity drifts through S1 and R1 all night | London and New York only; Asian touches do not count |
The first row deserves emphasis because it is the most expensive failure on this list. A level touched is not a level held. In my unfiltered test the two extra trades were both first-touch entries at S1 with no rejection candle, and both lost, because price was passing through the level on its way to the next one, not bouncing off it. The confirmation candle is the filter that separates a bounce from a drive-through. The max daily drawdown guide explains why two careless level trades in a morning can end a challenge on their own.
How Woodie pivots fit prop firm rules
Woodie pivots fit funded rules better than most indicators because they are selective by construction. The two-trade cap is easy to keep when a confirmed S1 bounce or R1 rejection prints only a few times a week, and the fixed 500-dollar risk makes the daily loss limit easy to respect: every trade has a stop below the level, a target at the next level, and a size from the formula. The consistency rule is satisfied naturally, because the best trade in my test was 22.7 percent of the net, inside the 30 percent ceiling. The one rule they do not help with is the news rule: Woodie levels mean nothing during a red-folder release, because the spike prints through R1 and S1 and the levels only matter again once the market settles.
My daily routine is short. At the London open I plot the five Woodie levels, note which ones sit near a floor or Camarilla level, and write down the two trades I would take. I trade only the ones on the list, I stop at two trades or 1,000 dollars of loss, and I am flat before the New York close. The levels do not make me money. They tell me where the market settled yesterday, and waiting for price to respect that settlement is what keeps a funded account alive.
Frequently asked questions
What are Woodie pivot points?
Woodie pivot points are daily support and resistance levels developed by trader Ken Wood. The pivot is calculated as the high plus the low plus twice the close, divided by four, which gives the close double weight because it is the price every market participant agreed on at the end of the day. Resistance 1 is twice the pivot minus the low, support 1 is twice the pivot minus the high, and resistance 2 and support 2 sit one full daily range above and below the pivot.
How are Woodie pivots different from floor pivots?
Floor pivots weight the high, low and close equally, so the pivot is the middle of the range. Woodie pivots weight the close twice, so the pivot sits closer to where the market settled. On a strong-close day the Woodie pivot sits above the floor pivot; on a weak-close day it sits below it. On my example day the Woodie pivot was 1.0950 against a floor pivot of 1.0947, and the Woodie R1 was 1.1000 against a floor R1 of 1.0993, a seven-pip difference that cost me 440 dollars when I traded the wrong one.
What is the best Woodie pivot setting for a funded account?
Daily levels, H1 for entries and H4 for direction, London and New York sessions only, a two-trade cap and 500 dollars of risk per trade. Woodie pivots have no period to optimise: the settings that matter are the timeframe, the session and the trade cap, not the formula.
Do Woodie pivot points repaint?
No. Woodie levels are calculated once a day from the previous day’s high, low and close, and they do not move until the next day’s levels are plotted. That is the main reason they suit a funded account: the level I plan around in the morning is the same level I trade in the afternoon.
Can I use Woodie pivots on a prop firm challenge?
Yes. The levels are a standard charting calculation, not an EA and not a banned strategy, and they fit challenge rules well because they are slow, selective and fully planned in advance: every trade has a stop below the level and a size from the formula. Check your firm’s rules on news trading separately, because Woodie levels mean nothing during a red-folder release.
Which level should I trade first, S1 or R1?
Trade the one price reaches with a confirmation candle and with the H4 trend behind it. In an uptrend I favour S1 bounces, because buying support with the trend is the higher-probability trade; in a downtrend I favour R1 rejections. A level touched without a rejection candle is not a trade, in either direction.
Trading involves substantial risk of loss and is not suitable for every investor. This article is educational, not financial advice. Never risk money you cannot afford to lose, and never trade a funded account with rules you have not tested on demo first.



