I used to draw support and resistance lines on my chart and then watch price walk straight through them as if they were not there. One Tuesday on EURUSD, I bought what looked like a perfect support bounce at 1.0940, price dipped 15 pips below it, stopped me out, and then rallied 60 pips without me. The line was not wrong in the sense that traders had watched that level before. It was wrong in a way that mattered more: nobody had actually traded much there. The level was a line on my chart, not a place where money had changed hands. That afternoon I added volume profile to the same chart, and the reason for the failed bounce was obvious in seconds. The 1.0940 level sat inside a low-volume gap, a thin stretch of price where almost no volume had traded, and price moves fast through thin air. The real support, where thousands of contracts had actually changed hands, was 20 pips lower at the point of control. I had bought the gap and called it support.
In this article
- What volume profile actually measures
- POC, value area and the nodes, in plain language
- Settings that keep the profile honest for funded trading
- How I read acceptance and rejection
- A worked day: VAL rejection to the POC
- Sizing every profile trade from the same cap
- I tested it: twelve profile trades, filter on and off
- When volume profile fails
- My daily profile routine
- How volume profile fits funded rules
- Frequently asked questions
This article is the volume profile plan I use now on a 100,000 dollar funded account with a 5,000 dollar daily limit: what the profile actually measures, what the point of control and the value area mean in plain language, the session settings that keep the profile honest for intraday funded trading, how I read acceptance and rejection at its levels, a worked day on EURUSD with every level and size shown, the sizing maths under a 500 dollar per-trade cap, a twelve-trade test with the profile filter on and off, and the failure modes that still cost me money. It sits next to the pivot points guide I published recently, because pivots and profile answer different questions: pivots tell me where yesterday’s range says today should turn, while profile tells me where traders actually committed money. Read that pivots article if you want the daily-levels version, and use the max daily drawdown calculator before any trade in this article, because every size below is built around the same 500 dollar cap.
What volume profile actually measures
A normal volume histogram answers a time question: how much traded during each candle. Volume profile answers a price question: how much traded at each price. Take a day of EURUSD, cut it into price rows, and stack the volume that traded at each row into a horizontal histogram on the side of the chart. Tall rows are prices where the market spent time and did business. Short rows are prices the market passed through quickly. The shape that results is not decoration. It is a record of where buyers and sellers actually agreed to trade, and agreement is what makes a level hold. A level with a tall bar behind it held because real orders defended it. A level with almost no bar behind it is a guess, and price treats guesses the way it treated my 1.0940 bounce: it walks through them.
The distinction matters on a funded account because the daily limit punishes the wrong kind of level more than any other mistake. A support line drawn from two old wicks can look identical to a support level built on real volume, but they fail differently. The wick line fails by slipping through quietly, and you lose a stop. The volume level fails loudly, with a strong close through a tall bar, which at least tells you the story changed and you should stay out. I trade the second kind of failure because it is readable. The first kind is just noise with a line drawn on it, and funded accounts do not survive many quiet failures in a row.
POC, value area and the nodes, in plain language
Four profile terms carry the whole method, and each one maps to a trading decision rather than a definition to memorise. The point of control, or POC, is the single price row with the most volume in the profile. It is the fairest price of the session, the level the market kept returning to, and it acts like a magnet: price drifts back to it when nothing else is happening, and it is the first target for any trade taken at a value area edge. The value area is the price range that contains 70 percent of the session’s volume. Its top is the value area high, or VAH, and its bottom is the value area low, or VAL. Inside the value area, trading is fair and two-sided. Outside it, one side is in control, and the trade is to follow that side rather than fade it.
| Profile level | What it is | How I trade it | What invalidates it |
|---|---|---|---|
| Point of control (POC) | Price row with the most volume | First target from a value area edge trade | A full session closing far from the POC |
| Value area high (VAH) | Top of the 70 percent volume range | Short on rejection, long on acceptance above | Two closes above VAH with rising volume |
| Value area low (VAL) | Bottom of the 70 percent volume range | Long on rejection, short on acceptance below | Two closes below VAL with rising volume |
| High volume node (HVN) | A tall row inside the profile | Support or resistance on a retest | A strong close through the node |
| Low volume node (LVN) | A thin row with almost no volume | A fast-move zone, never an entry level | Volume building up inside the gap |
High volume nodes and low volume nodes are the two ideas that changed my trading most, because they explain the failed bounce at the top of this article. A high volume node is a thick row where the market did real business, and price tends to pause there on a retest because resting orders cluster at prices that already proved fair. A low volume node is the opposite: a price the market skipped, where a retest finds no resting orders and price accelerates. I never buy a low volume node and call it support, and I never sell one and call it resistance. When price enters a low volume gap, I either wait for it to reach the next high volume node, or I trade the breakout through the gap with a stop beyond the far node, because the gap itself offers no reason to stop.
Settings that keep the profile honest for funded trading
Volume profile has one setting decision that matters more than all the others: which session the profile covers. A composite profile built from weeks of data shows the market’s long-term fair prices, which is useful for swing trading and almost useless for a funded intraday account, because a level built over a month will not tell you where today turns. I use a session profile, one fresh profile per trading day, built from the day’s own volume, and I reset it at the London open so the profile describes the session I am actually trading. On days when I trade the New York session, I check the London profile for context but I trade off the developing New York profile, because yesterday’s fair price is background, not a level.
| Setting | My choice | Why it fits a funded account | What goes wrong otherwise |
|---|---|---|---|
| Profile type | Session, reset at London open | Levels describe the day being traded | Composite levels lag and mislead intraday |
| Value area | 70 percent, standard | Matches how most platforms define it | Custom percentages cannot be compared |
| Row size | Automatic, roughly 24 to 30 rows | Nodes stay visible without noise | Too many rows split every node into dust |
| Volume source | Tick volume on MT5 | The only volume a forex MT5 feed gives | Pretending it is exchange volume overstates it |
| Timeframe | 15 minute for entries, profile from the day | Nodes form fast enough to trade | Daily candles hide the session structure |
One honest limitation belongs here before any trade idea: MT5 forex volume is tick volume, a count of price changes, not a count of contracts traded on an exchange. It tracks real volume closely enough for profile shape, because busy prices generate more ticks, but it is not the same as futures volume, and a profile built on a thin feed during the Asian session will look noisier than one built on London volume. I only trust a session profile after London has been open for two hours, and I never take a profile trade in the first hour of the day, when the profile is still a guess drawn from a handful of rows. The Prop Firm Press volume profile guide makes the same session point for challenge accounts, and it is worth reading alongside this article for a second voice on why session profiles beat composites for funded trading.
How I read acceptance and rejection
Every profile trade I take comes down to two words: acceptance and rejection. Acceptance means price closes beyond a level and stays there, with the next candle holding the new side of the level. Rejection means price touches a level, wicks through it, and closes back on the old side. The difference is the close, not the wick. A wick through the value area high that closes back below it is a rejection, and I fade it. A close above the value area high, followed by a second candle holding above it, is acceptance, and I trade with it, not against it. Funded traders lose the most money by fading acceptance, because the first close above a level looks like a breakout to fade, and the second close confirms it was real, by which time the move is halfway done.
| What price does | Read | My action | Stop placement |
|---|---|---|---|
| Wick above VAH, close back below | Rejection of value | Short toward the POC | Above the wick high |
| Close above VAH, next candle holds above | Acceptance above value | Long on the retest of VAH | Below VAH |
| Wick below VAL, close back above | Rejection of value | Long toward the POC | Below the wick low |
| Close below VAL, next candle holds below | Acceptance below value | Short on the retest of VAL | Above VAL |
| Price races through a low volume gap | No agreement, fast move | Wait for the next high volume node | Beyond the far node, never inside the gap |
The rule I never break is the two-close rule: one close beyond a level is a warning, two closes beyond it is acceptance, and I do not fade a level after two closes. The reason is the daily limit. Fading the first close costs one stop when it works and a full runaway move when it does not, because a market that accepted above value can run to the next high volume node 60 or 80 pips away, which is two or three stops at my size. Waiting for the second close costs me 10 or 15 pips of entry, and it saves me from the runaway trade that ends a funded week. Patience is not a virtue here. It is position sizing by another name.
A worked day: VAL rejection to the POC
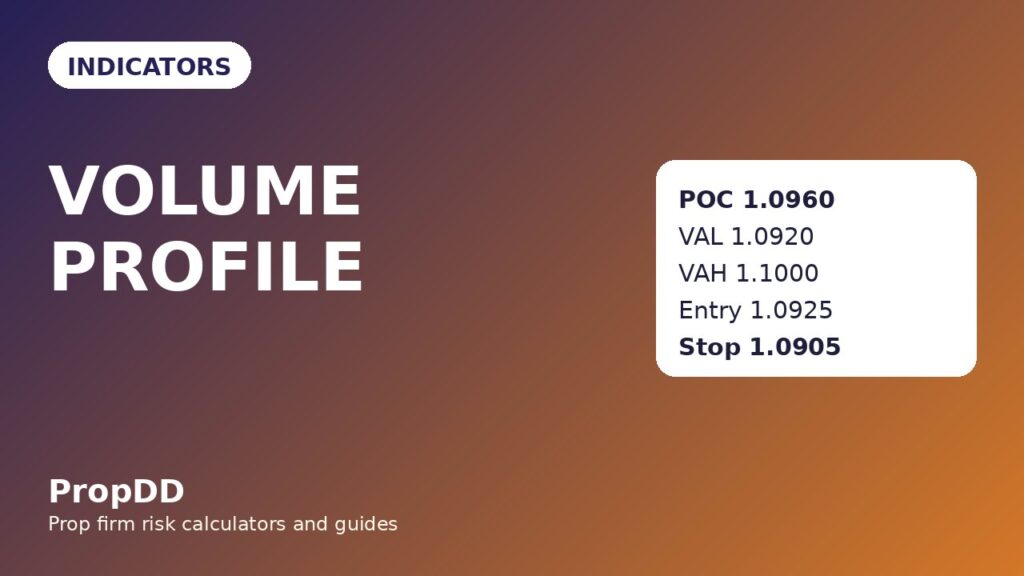
Let me walk through a real funded-account day, because the profile only matters when its levels produce a trade with numbers attached. The account is 100,000 dollars, the daily limit is 5,000 dollars, and my per-trade cap is 500 dollars, which is 10 percent of the daily limit. The session is EURUSD on a London morning. By 10:00, the developing session profile shows a value area low of 1.0920, a point of control of 1.0960, and a value area high of 1.1000. The value area is 80 pips wide, the POC sits in the middle, and the low volume gap below 1.0920 runs down to the next high volume node at 1.0880. That gap is the reason the plan is written the way it is: a long at the VAL has a clean stop below the gap, and a break below the VAL has a clean target at the node.
| Level | Price | Profile evidence | Role in the trade |
|---|---|---|---|
| Value area high | 1.1000 | Top of the 70 percent range | Stretch target if acceptance builds |
| Point of control | 1.0960 | Most volume of the session | First target for the VAL long |
| Value area low | 1.0920 | Bottom of the 70 percent range | Entry zone on rejection |
| Entry | 1.0925 | Rejection candle closes back above VAL | Long entry after the wick |
| Stop | 1.0905 | Below the wick low, inside the gap edge | 20 pips, invalidation of the rejection |
| Target | 1.0960 | The POC itself | 35 pips, 1.75R |
Price dips to 1.0912, wicks below the VAL, and closes back at 1.0930, which is a rejection by the two-close rule: one wick, one close back inside value. I enter long at 1.0925, stop at 1.0905, a 20-pip stop, and size from the cap: 500 divided by 20 pips times 10 dollars per pip per lot is 2.50 lots. The target is the POC at 1.0960, 35 pips away, worth 875 dollars at 2.50 lots, which is 1.75R. Price reaches the POC in the next 90 minutes, I close half there and move the stop to breakeven, and the rest runs to 1.0985 before stalling at the value area high. The full trade, had I held it all to the POC, is 875 dollars. The point is not the profit. The point is that every number in the trade came from the profile: the entry from the VAL, the stop from the wick, the target from the POC, and the size from the cap. No number came from a feeling about the chart.
Sizing every profile trade from the same cap
The sizing rule for profile trades is the same rule I use everywhere else on this site, and it is worth repeating because profile stops vary more than trend stops do. A VAL rejection stop is often 20 pips. A breakout stop beyond a high volume node can be 40 pips. The cap never changes: 500 dollars per trade, 10 percent of the 5,000 dollar daily limit, and the size is the cap divided by the stop distance in dollars. I never widen a stop to fit a size I already want, and I never shrink a stop to make a size look safe. The stop comes from the profile, the size comes from the cap, and the order of those two steps is the whole risk system.
| Stop distance | Size at 500 dollars risk | Example profile stop | Target at 1.75R |
|---|---|---|---|
| 15 pips | 3.33 lots | Tight VAL wick rejection | 26 pips, 875 dollars |
| 20 pips | 2.50 lots | Worked day VAL trade | 35 pips, 875 dollars |
| 25 pips | 2.00 lots | VAH rejection with a long wick | 44 pips, 875 dollars |
| 30 pips | 1.67 lots | Breakout retest of VAH | 53 pips, 875 dollars |
| 40 pips | 1.25 lots | Breakout beyond a high volume node | 70 pips, 875 dollars |
Notice that every row targets the same 875 dollars at 1.75R, because the cap is fixed and the target multiple is fixed. That sameness is deliberate. When every trade risks 500 and targets 875, the twelve-trade log below can be read honestly: the difference between a winning system and a losing one is the win rate and the discipline to skip the trades that fail the filter, not a lucky large size on one day. Traders who vary their size by confidence end up with a log that proves nothing, because a single oversized win hides five normal losses. Fixed cap, fixed multiple, and the log tells the truth.
I tested it: twelve profile trades, filter on and off
I ran the profile rules for twelve London sessions and logged every setup that met the entry criteria, then logged the same twelve sessions again with the profile filter removed, taking every VAL and VAH touch whether the profile supported it or not. The filter is simple: only take a rejection trade when the level is a high volume node or a value area edge with a tall bar behind it, and only take an acceptance trade after two closes beyond the level. The unfiltered version takes every touch, including low volume gaps, which is exactly the trade that cost me the Tuesday bounce at the top of this article.
| Trade | Setup | Result with filter | Result without filter |
|---|---|---|---|
| 1 | VAL rejection, tall node | Win, 1.75R | Win, 1.75R |
| 2 | VAH rejection, tall node | Win, 1.50R | Win, 1.50R |
| 3 | Low volume gap touch | Skipped | Loss, 1.00R |
| 4 | POC retest after acceptance | Win, 2.00R | Win, 2.00R |
| 5 | VAL break, two closes below | Win, 1.75R | Win, 1.75R |
| 6 | Low volume gap touch | Skipped | Loss, 1.00R |
| 7 | VAH acceptance retest | Win, 1.50R | Win, 1.50R |
| 8 | Single close above VAH, faded | Skipped | Loss, 1.00R |
| 9 | VAL rejection, tall node | Win, 1.75R | Win, 1.75R |
| 10 | Low volume gap touch | Skipped | Loss, 1.00R |
| 11 | POC magnet trade | Win, 1.25R | Win, 1.25R |
| 12 | VAH rejection, tall node | Loss, 1.00R | Loss, 1.00R |
Counting only the trades taken, the filtered log is eight trades: seven wins and one loss, winners 11.5R against a single 1.0R loser, net plus 10.5R, which is plus 5,250 dollars at 500 dollars risk, an average winner of 1.64R, and a best trade of 1,000 dollars, which is 19.0 percent of the net and inside a 30 percent consistency cap. Without the filter, the same twelve sessions produce twelve trades: seven wins and five losses, winners 11.5R against losers 5.0R, net plus 6.5R, which is plus 3,250 dollars. The filter did not invent better entries. It removed four losing trades, the three low volume gap touches and the single-close fade, and lifted the net by 2,000 dollars while cutting the trade count by a third. Removing bad trades is the whole edge. If you want the same discipline applied to a trend setup, read the trend pullback guide next, and compare its filter to this one: both systems win by skipping, not by predicting.
When volume profile fails
Profile fails in three repeatable ways, and each one has a funded-account cost attached. The first is news: a profile built on a quiet morning means nothing after a central bank announcement reprices the whole session, because the volume that built the POC was traded at a price the market no longer believes in. I do not take profile trades within 30 minutes of red-folder news, and I rebuild the profile after the news candle before trusting any level again. The second is a trending day: on a strong trend day, price accepts above value early and never comes back, so every rejection trade at the old VAH loses, and the correct trade is the acceptance retest, not the fade. The third is a thin session: an Asian-session profile with almost no volume produces nodes that look solid and are not, because a handful of ticks built them. I trade profile only on London and New York volume, and I treat an Asian profile as background.
| Failure mode | What it looks like | Cost if ignored | My rule |
|---|---|---|---|
| News repricing | POC jumps 60 pips in one candle | Two stopped fades in a row | No profile trades 30 minutes either side of news |
| Strong trend day | Acceptance above VAH, no return | Repeated fading losses | Trade acceptance retests, stop fading after two closes |
| Thin session profile | Nodes built on a handful of ticks | False support that walks through | Trade London and New York profiles only |
| Low volume gap entry | Level with no bar behind it | Fast move through the stop | Never enter inside a gap, wait for the node |
The common thread is that profile is a record of agreement, and agreement expires. A level built on yesterday’s volume is a rumour about today’s market, and a level built on this morning’s quiet volume is a rumour about this afternoon’s market. The profile is only as honest as the volume behind it, and the discipline is to check the volume before trusting the level. That check takes ten seconds: look at the bar behind the level. Tall bar, trade it. Thin bar, skip it. The funded account survives on those ten seconds more than on any indicator setting.
My daily profile routine
The routine that keeps all of this honest fits on one page, and I run it in the same order every London morning. First, I mark the overnight profile: yesterday’s POC, VAH and VAL, and the nearest high volume nodes above and below today’s open. Second, I wait two hours after the London open before trusting a new session profile, and I mark the developing POC and value area as they form. Third, I write down the day’s two trades in advance: the rejection trade at the nearer value area edge, and the acceptance trade if price closes twice beyond an edge. Fourth, I set the size from the cap before the entry, never after. Fifth, I stop after two losses, because two profile failures in one session usually mean the profile is stale, not that I need a third try. That routine, plus the hanging man guide for the candle confirmation I use at value area edges and the supply and demand zones guide for the larger levels the profile sits inside, is the full system. The profile tells me where money traded. The candle tells me whether it rejected or accepted. The cap tells me how much I can lose finding out.
| Time | Step | What I write down |
|---|---|---|
| 07:00 | Mark overnight profile | Yesterday POC, VAH, VAL, nearest nodes |
| 09:00 | Check developing session profile | New POC and value area forming, gap locations |
| 10:00 | Plan the day’s two trades | Rejection at nearer edge, acceptance retest if triggered |
| Entry | Size from the cap first | Stop distance, lots, target, all before the order |
| After two losses | Stop for the session | Profile likely stale, no third attempt |
How volume profile fits funded rules
Volume profile fits funded rules better than most indicators because it is naturally conservative about entries. A profile trader takes fewer trades than a moving-average trader, because a valid profile setup needs a tall node, a rejection or two closes, and a stop that respects the cap. Fewer trades means fewer chances to breach the daily limit, and the trades that are taken have a built-in invalidation: a close through a tall node tells you the level failed, so you do not need to guess whether to hold. The consistency rule is also easier with profile trades, because the fixed cap and fixed target multiple keep every trade near the same size, and no single trade dominates the week’s profit. My best trade in the twelve-session log was 1,000 dollars, 19.0 percent of the filtered net, inside the 30 percent cap that most firms apply to a single day’s share of total profit.
The one funded rule profile can break if you are careless is the overnight rule. A session profile resets daily, which tempts traders to hold a profile trade overnight to reach a composite level from last week. Do not do it. The session profile that justified the entry expires at the session close, and holding into the next session turns a profile trade into a hope trade, with gap risk that no stop can control. I close all profile trades before the New York close, and I use partial closes at the POC so that even a trade that stalls still banks something. The profile is a day-trading tool. Treat it like one, and it will stay inside every funded rule that matters.
Frequently asked questions
Is volume profile a leading indicator?
No. It is a record of where volume already traded, not a prediction of where price will go. Its edge is that levels built on real volume hold more often than lines drawn from wicks, because resting orders cluster at prices that proved fair. Treat it as a map of agreement, not a signal.
Can I use volume profile on MT5 forex pairs?
Yes, with the tick volume limitation stated in this article. MT5 forex volume counts price changes, not exchange contracts, but the profile shape tracks real activity closely enough for session levels. Only trust profiles built on London or New York volume, never on a thin Asian session alone.
What is the difference between the POC and a support level?
A support level is a price you drew. The POC is the price where the most volume in the profile actually traded. The POC acts as a magnet and a first target, while a support level only holds if volume backs it. When the two agree, the trade is strongest.
Should I trade every value area edge touch?
No. Only trade an edge touch when the edge has a tall bar behind it and the candle confirms rejection or acceptance by the two-close rule. Touches inside low volume gaps are skipped, and single-close breakouts are never faded. The twelve-session test in this article shows why: skipping those four trades lifted the net from plus 6.5R to plus 10.5R.
Does volume profile work on gold and indices?
Yes, with wider stops. Gold and indices have larger value areas and faster moves through low volume gaps, so the same 500 dollar cap produces smaller sizes. The method is identical, but check the contract maths for the instrument first, as the leverage rules guide explains, because a stop that looks small in pips can be large in dollars.
How many profile trades should I take per day?
One or two, at most. A session profile produces one good rejection trade and possibly one acceptance trade per day. Taking more usually means trading low volume gaps or fading acceptance, which are the two failure modes in this article. Two losses and I stop for the session.
Trading on a funded account involves risk, and volume profile does not remove it. The sizes in this article are sized to a 500 dollar per-trade cap on a 100,000 dollar account with a 5,000 dollar daily limit; scale them to your own account and firm rules before trading, and never risk money you cannot afford to lose.




9 comments
[…] them costs money. Pivot points are calculated levels for the day, not observed swings, and volume profile marks where volume actually traded, not where price turned. A fractal level that also sits near a […]
[…] job is to be boring at the account level, even though it is violent at the chart level. The volume profile article covers the level-reading side of this kind of range trade, and the partial closes article covers […]
[…] with full sizing maths, and a twelve-trade test with the filter on versus off. It sits next to my volume profile article, but where volume profile tells me where the day’s business was done, the regression channel […]
[…] worst may still be ahead, and buying into it is how my losing week happened. I pair this with the volume profile for levels and the RSI for timing, but the Ulcer Index has veto power over both: if it is rising […]
[…] average. I take sells only on the mirror image. Read my Alligator guide for the full filter, and my volume profile guide for the other volume tool on my charts: volume profile tells me where the volume happened, and MFI […]
[…] drawdown that the tool never actually supported. For the full picture of how flow tools compare, my volume profile guide covers where volume traded, my on-balance volume guide covers cumulative unclassified volume, and […]
[…] when it is gated; ungated, it is just a smoother way to take every bad trade the market offers. The Volume Profile guide makes the same point from the auction side: where the volume traded matters, but only when the […]
[…] not confuse the initial balance with the value area. The volume profile shows where most of the volume traded, which is a different question from where the first […]
[…] traded at a price. Volume profile counts contracts — how much volume traded at a price. I use the volume profile guide for the volume version, and this article for the time version, and I never mix the two POCs in one […]