On a Tuesday in late October I lost fifteen hundred dollars in three hours, and every one of the three trades looked perfect on the chart. EURUSD had printed a clean 1-2-3 reversal, broken out above point 2, and then made a textbook Ross Hook. I bought the hook, the hook failed, and I bought the next one, and the next one. By lunch my day was over: three five-hundred-dollar losses, thirty percent of my daily limit. The pattern had not been wrong. The market had been flat, and Ross says hooks are useless when the market is flat. I trade a 100,000-dollar funded account, so one 500-dollar loss is ten percent of my daily limit and three end my day.
In this article
- What a Ross Hook actually is
- The 1-2-3 formation, point by point
- My six rules: the full setup
- The two entries: Traders Trick vs the conservative breakout
- The sizing formula: one loss is ten percent of my daily limit
- My worked trade: a EURUSD H1 long with every number shown
- Twelve trades, counted honestly
- When the Ross Hook fails
- My daily routine for trading hooks
- Frequently asked questions
What a Ross Hook actually is
The Ross Hook is Joe Ross’s continuation pattern. Ross traded for more than forty-eight years, wrote twelve books, and named the Law of Charts and the 1-2-3 formation. The hook is the second half of his method: the first half finds the reversal, the hook trades the trend that follows it.
The sequence runs in three steps. First, a trend ends with a 1-2-3 reversal: a swing extreme, a retracement, and a second extreme that fails to update the first. Second, price breaks out past point 2. Third, the new trend pauses: a bar fails to make a new high, or a new low. That failed extreme is the Ross Hook. The trade is the continuation after the pause — buying the retest of the hook, which Ross called the Traders Trick Entry, or buying the break back above the hook high.
Two things decide whether the hook works at all. It only works in a trending market — in a flat market every bar fails to make a new high, so hooks print all day. And it is a continuation pattern, not a reversal pattern: it trades with the new trend, after the 1-2-3 has already turned it.
The 1-2-3 formation, point by point
Every hook I trade starts with a 1-2-3, and every point has a rule. If any rule fails, there is no hook trade.
| Point | What it is | The rule |
|---|---|---|
| Point 1 | The swing extreme ending the old trend | A clear high in a downtrend turning up, or a clear low in an uptrend turning down |
| Point 2 | The retracement extreme against the old trend | The high of the retracement in a bullish reversal; the breakout past point 2 is the confirmation |
| Point 3 | The second extreme, toward the new trend | A higher low than point 1; it must NOT update point 1, and it should sit 23.6% to 61.8% back from point 2 |
| The breakout | The close past point 2 | A full hourly close above point 2 for a long; a wick that closes back inside is a fakeout |
| The hook | The first failed extreme after the breakout | After the breakout, a bar fails to make a new high in an uptrend, or a new low in a downtrend |
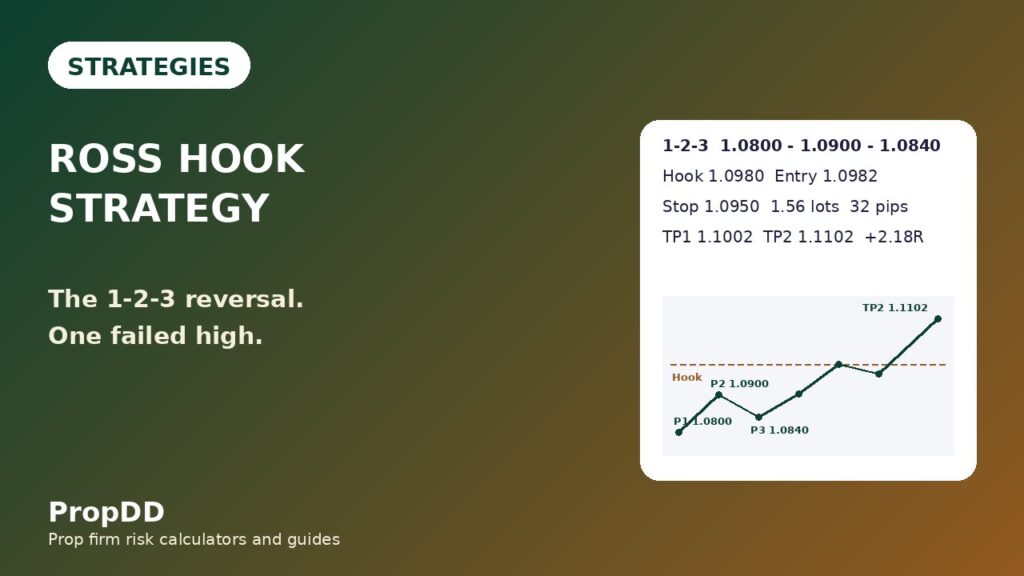
My example ran on EURUSD H1. The downtrend bottomed at point 1, 1.0800, retraced to point 2, 1.0900 — a 100-pip leg — and pulled back to point 3, 1.0840, a 60.0% retracement, inside the 23.6% to 61.8% band. Then an hourly candle closed above 1.0900. Notice what the raw 1-2-3 breakout would have cost: entry at 1.0902 with the stop below point 3 at 1.0835 is a 67-pip stop — but the target sits so close to the entry that the trade pays less than one R. That is why I wait for the hook, where the stop is a third of the size.
My six rules: the full setup
Every Ross Hook I take passes the same six checks, in order. If a check fails, the trade is cancelled, not adjusted.
| Rule | The rule | The number |
|---|---|---|
| 1. Trend | Price on the right side of the 200 EMA on H1 | Above the EMA-200 for longs, below it for shorts |
| 2. Flat filter | No hook trades when ranging: the last ten H1 bars must span at least 40 pips on EURUSD | Ten-bar range under 40 pips means flat — stand down |
| 3. Formation | A complete 1-2-3, point 3 inside 23.6% to 61.8%, then a full hourly close past point 2 | Point 3 at 60.0% in my example, inside the band |
| 4. Hook | After the breakout, the first bar that fails to make a new high (long) or new low (short) | The hook high is 1.0980 in my example |
| 5. Entry and stop | Traders Trick: buy the retest. Conservative: buy stop above the hook high. Stop below the pullback low plus 5 pips, never wider than 50 pips | Stop 5 pips past the pullback low |
| 6. Session and news | London 07:00-10:00 UTC or New York 12:30-15:30 UTC; flat 30 minutes either side of red-folder news | Two sessions, two chances, never more |
Rule two would have saved my fifteen hundred dollars. Ross says the strategy is efficient in a trending market and absolutely useless when the market is flat. On that Tuesday the ten-bar range was 31 pips, and every hook that day was a flat-market hook. The filter is the edge.
The two entries: Traders Trick vs the conservative breakout
Ross taught two ways into the same hook. The Traders Trick Entry buys the retest at the hook zone with a tight stop below the pullback low, and pays a much bigger multiple. The conservative entry waits for the break back above the hook high, pays more for the entry, and gets confirmation in return.
| Traders Trick Entry | Conservative breakout entry | |
|---|---|---|
| Entry | Buy at the retest of the hook zone, 1.0965 | Buy stop above the hook high, 1.0982 |
| Stop | Below the pullback low, 1.0950 — 15 pips | Below the pullback low, 1.0950 — 32 pips |
| Size at 500 dollars risk | 3.33 lots, risk 499.50 dollars | 1.56 lots, risk 499.20 dollars |
| TP1 (1.618 extension, 1.1002) | Half off, plus 612.72 dollars | Half off, plus 154.44 dollars |
| TP2 (2.618 extension, 1.1102) | Rest off, plus 2,277.72 dollars | Rest off, plus 934.44 dollars |
| Total | Plus 2,890.44 dollars, 5.79R | Plus 1,088.88 dollars, 2.18R |
| What can go wrong | The retest keeps falling and stops you out; the hook never retests at all | You pay 17 extra pips for confirmation, so every target is worth less |
Ross’s own guidance on the first entry: it carries a large stop, placed at point 3, and the trader has to be sure the sellers will not take control again — which is why he says to start with moderate size and build as confidence grows. On the LiteFinance Ross Hooks guide, a NZDUSD H4 hook, that first stop was 200 points. My rule follows his: I never take a Traders Trick Entry at full size. I take half size at the retest, and add the second half only when price breaks the hook high.
The sizing formula: one loss is ten percent of my daily limit
The account is one hundred thousand dollars, the daily loss limit is five thousand, and my risk per trade is five hundred dollars — half a percent of the account and ten percent of the daily limit. One loss is ten percent of my daily limit, so three consecutive losses end my day by my own personal daily stop. The position size is never chosen by feel. It follows from the stop distance: lots equal risk divided by stop distance times pip value. I run every size through the max daily drawdown calculator before I place the trade.
| Figure | Value | How it is calculated |
|---|---|---|
| Account | 100,000 dollars | Funded account balance |
| Daily loss limit | 5,000 dollars | 5% of the account |
| Risk per trade | 500 dollars | 0.5% of the account, 10% of the daily limit |
| Formula | Lots = 500 / (stop in pips x 10) | EURUSD pip value is 10 dollars per lot |
| Actual risk | 499.20 dollars | 1.56 lots x 32 pips x 10 dollars |
| Stop distance | Lots at 500 dollars risk | Actual risk |
|---|---|---|
| 15 pips | 3.33 | 499.50 dollars |
| 20 pips | 2.50 | 500.00 dollars |
| 25 pips | 2.00 | 500.00 dollars |
| 30 pips | 1.66 | 498.00 dollars |
| 40 pips | 1.25 | 500.00 dollars |
| 50 pips | 1.00 | 500.00 dollars |
The risk is always 500 dollars because the lots shrink as the stop grows. And one trade is always 10 percent of the daily limit. A hook that needs a stop wider than 50 pips is a skipped trade, not a bigger one. Ross’s own first-entry stop at point 3 would have been 67 pips — wider than my ceiling.
My worked trade: a EURUSD H1 long with every number shown
Wednesday, London session. The downtrend had bottomed at point 1, 1.0800, retraced to point 2, 1.0900, and pulled back to point 3, 1.0840. An hourly candle closed above 1.0900 and the reversal was confirmed. Price ran 78 pips to 1.0980, then printed a bar that failed to make a new high. That was the hook. Price pulled back to 1.0955, and I placed a buy stop at 1.0982, two pips above the hook high, with the stop at 1.0950, 5 pips below the pullback low. The risk was 32 pips.
| Figure | Value | How it is calculated |
|---|---|---|
| Account | 100,000 dollars | Funded account balance |
| Daily loss limit | 5,000 dollars | 5% of the account |
| Point 1 / Point 2 / Point 3 | 1.0800 / 1.0900 / 1.0840 | 100-pip leg; point 3 is a 60.0% retracement |
| Breakout | Hourly close above 1.0900 | Entry would have been 1.0902; not traded — 67-pip stop |
| Ross Hook high | 1.0980 | First bar after the breakout that failed to make a new high |
| Pullback low | 1.0955 | 25-pip pullback from the hook high |
| Entry (conservative) | 1.0982 | Buy stop 2 pips above the hook high |
| Stop loss | 1.0950 | 32 pips, 5 pips below the pullback low |
| Position size | 1.56 lots | 500 / (32 x 10) = 1.5625, rounded down |
| Risk | 499.20 dollars | 1.56 lots x 32 pips x 10 dollars |
| TP1 (1.618 extension) | 1.1002 | Point 3 plus 1.618 x the leg; 19.8 pips above entry |
| TP2 (2.618 extension) | 1.1102 | Point 3 plus 2.618 x the leg; 119.8 pips above entry |
| Result | Plus 1,088.88 dollars, 2.18R | TP1 half plus 154.44 dollars; TP2 half plus 934.44 dollars |
Price hit TP1 the same session; I took half off at 1.1002 for 154.44 dollars and moved the stop to breakeven. The rest reached 1.1102 the next morning for 934.44 dollars — 1,088.88 dollars on 499.20 dollars of risk: 2.18R. The measured move lands at 1.1082, between my two targets, and the EMA-200 sat below price the whole way. Joe Ross gives no exit rules of his own, so the targets came from Fibonacci ratios: the 1.618 and 2.618 extensions of the 1–2 leg, measured from point 3.
Twelve trades, counted honestly
I traded this exact setup for twelve H1 hooks over six weeks, all on EURUSD or GBPUSD, all during London or New York, all with the six rules above.
| Trade | Pair | Direction | Entry | Result | Notes |
|---|---|---|---|---|---|
| 1 | EURUSD | Long | Conservative | +2.18R | Worked trade |
| 2 | GBPUSD | Long | Traders Trick | +2.00R | Retest held |
| 3 | EURUSD | Long | Conservative | +1.50R | TP1 only |
| 4 | GBPUSD | Short | Conservative | +1.50R | Clean hook |
| 5 | EURUSD | Short | Traders Trick | -1.00R | Retest failed |
| 6 | GBPUSD | Long | Conservative | +1.50R | RRH held |
| 7 | EURUSD | Long | Traders Trick | +1.00R | TP1 only |
| 8 | GBPUSD | Short | Conservative | +2.00R | Full 2R |
| 9 | EURUSD | Long | Conservative | -1.00R | Dead trend |
| 10 | GBPUSD | Long | Traders Trick | +1.00R | TP1, runner |
| 11 | EURUSD | Short | Conservative | -1.00R | News drift |
| 12 | GBPUSD | Short | Traders Trick | -1.00R | Range day |
Eight wins, four losses: the winners total 11.68R, the losers 4R, so the net is plus 7.68R, or 3,838.88 dollars at five hundred dollars of risk per trade. The win rate is 66.7 percent, the expectancy is plus 0.64R per trade, and the best single trade made 1,088.88 dollars — 28.4 percent of the net, inside the 30 percent consistency ceiling most firms apply. Trades three to seven add up to plus 6.5R, or 3,250 dollars — the edge is spread, not carried by one trade.
Unfiltered, the same six weeks won eight and lost eight, for a net of plus 3.68R, or 1,838.88 dollars, and the best trade was 59.2 percent of the net — a consistency failure. The filters were worth 4.0R, or two thousand dollars, over twelve trades. That is the whole strategy.
When the Ross Hook fails
Hooks fail in six predictable ways. A flat market prints hooks all day because nothing trends — the filter exists for this exact day. A dead trend lets the hook trigger and then keeps falling through the pullback low; the stop exists for this trade. A Traders Trick stop hunt dips below the pullback low, takes the tight stop, then reverses — which is why the Trick entry is half size only. A range in disguise makes every pullback look like a hook; the EMA-200 rule filters these before entry. A news spike prints a violent pullback, the hook looks perfect, and the move reverses the moment the number is digested — the blackout exists for exactly this trade. And sometimes there is no retest at all: price breaks the hook high and never comes back. The hook is not the hook reversal (two bars, no 1-2-3), the second entry (a pullback inside a live trend), or the trend pullback (the first pullback) — it waits for the reversal to prove itself with a breakout, then trades the pause after it.
My daily routine for trading hooks
Genuine hooks that pass all six rules appear roughly two or three times a week, so there is no pressure to force one every day. 06:30 — mark the EMA-200 direction and note any 1-2-3 forming. 07:00 — watch for the breakout past point 2; the breakout is the confirmation, a wick is not. 08:00 — check the news calendar and mark the 30-minute blackout windows. 09:00 — scan for the first failed extreme after any breakout; under 40 pips means flat. 12:30 — repeat the scan for New York, one setup maximum per session. 15:30 — close the book and log the day. One more rule: a maximum of two hook trades per day, never two in the same direction on the same pair. Hooks cluster, and the third one in one morning will take your money.
Frequently asked questions
Is the Ross Hook the same as a hook reversal?
No. A hook reversal is a two-bar pattern — one push bar and one inside bar — and it needs nothing else. A Ross Hook needs a full 1-2-3 reversal, a breakout past point 2, and then the first bar that fails to make a new high or low.
What is the Traders Trick Entry?
It is Joe Ross’s tighter entry: buy the retest of the hook zone with a stop below the pullback low, instead of waiting for the break above the hook high. The stop is much smaller — 15 pips against 32 on my worked trade — so the same 500 dollars buys more than twice the size, and the same targets pay 5.79R instead of 2.18R.
Does the Ross Hook work in a ranging market?
No. Ross says the strategy is efficient in a trending market and absolutely useless when the market is flat. In a range every bar fails to make a new high, so hooks print all day. My flat filter is a ten-bar H1 range under 40 pips on EURUSD — below that, I stand down.
Where do I put the stop on a Ross Hook trade?
Below the pullback low plus a 5-pip buffer, on both entries. On the conservative entry that was 1.0950, a 32-pip stop; on the Traders Trick Entry the same line gives a 15-pip stop, because the entry is closer to it. Ross’s own first-entry stop sat at point 3 — 67 pips on my example, wider than my 50-pip ceiling.
How do I set targets if Ross gives no exit rules?
Ross gives no exit rules of his own, so I use Fibonacci ratios and pivot points, the way he suggests. My targets are the 1.618 and 2.618 extensions of the 1–2 leg, measured from point 3: 1.1002 and 1.1102. The measured move lands at 1.1082, between the two targets.
How often does a tradeable Ross Hook appear?
Roughly two or three times a week across EURUSD and GBPUSD, once the six rules are applied. Most 1-2-3s fail a rule: the point-3 retracement sits outside the band, the breakout never closes, the market is flat, or the hook forms in the dead hours between sessions.
Risk disclaimer: trading funded accounts involves substantial risk of loss. The figures here come from my own trading log and are not a promise of future results. Never risk money you cannot afford to lose.



1 comment
[…] — a failed extreme, then a turn — different construction, different stop, different size. The Ross Hook guide covers that method in full. Never mix the two in one trade […]