I lost 500 dollars to a fractal that was never actually there, and that sentence is less strange than it sounds. It was a Thursday on EURUSD, price had been grinding lower all morning, and a neat little triangle printed below a candle on my chart. I read it as a bottom, bought the next candle with a full position, and watched price fall straight through the level that was supposed to hold. The triangle vanished. It had not been a confirmed fractal at all. It was a candidate that needed two more candles to prove itself, and I had traded it before those two candles existed. On a funded account, where one careless loss is ten percent of my personal daily stop, that is not a small technicality. It is the whole difference between using fractals and being used by them.
In this article
- What a Williams fractal actually is, and the naming trap
- The five-bar maths that make a fractal
- Why fractals alone lose on a funded account
- My funded settings: timeframe, flank and the Alligator filter
- The six rules I trade
- Worked example: a EURUSD long, priced to the pip
- I tested it: twelve filtered trades against twenty raw breaks
- Common mistakes that turn fractals into losses
- How fractals fit prop firm rules
- My daily fractal routine
- Frequently asked questions
This article is the Williams fractal plan I use now on a 100,000 dollar funded account with a 5,000 dollar daily loss limit: what a fractal really is, the five-bar maths behind it, the settings and filter that keep it honest, six rules, sizing maths under the daily cap, a worked EURUSD long, and a twelve-trade test. It is the companion to the Alligator indicator, because Bill Williams designed the two to work together, but the fractal does a different job: it does not tell me the trend, it marks the exact swing points where I am allowed to act.
What a Williams fractal actually is, and the naming trap
A Williams fractal is not a prediction. It is a label for a swing high or a swing low, defined so strictly that two traders looking at the same chart will mark the same points. That objectivity is the entire appeal. Most support and resistance levels are drawn by hand and argued about afterwards. A fractal either meets the five-bar rule or it does not, and there is nothing to argue about.
The naming trap catches almost everyone at first, including me. A fractal that prints above price is called a bearish fractal, or an up fractal, because it marks a swing high. A fractal that prints below price is called a bullish fractal, or a down fractal, because it marks a swing low. The arrow points away from the swing, not towards the trade direction. When I first started, I bought an up fractal because the arrow sat on top and my brain read “up” as “go long”. It was a swing high. Price fell from it, exactly as a swing high should suggest. Learn the names by the swing, not by the arrow: up fractal means a top, down fractal means a bottom.
A fractal is also, by construction, a look backwards. It can only be confirmed once the two bars to the right of the middle bar have closed. That means every fractal on your chart marks a turning point that happened at least two bars ago. It confirms where price turned. It does not promise that price will turn again from that level, and it certainly does not promise it in time for you to catch the move from the start.
The five-bar maths that make a fractal
The rule is simple enough to check by hand, and I recommend doing exactly that on your first twenty fractals, because hand-checking is what stops you trusting unconfirmed triangles later. Take any five consecutive bars. The middle bar is the one being tested.
| Bar position | Bearish fractal (swing high) test | Bullish fractal (swing low) test |
|---|---|---|
| Two bars left | High lower than the middle bar high | Low higher than the middle bar low |
| One bar left | High lower than the middle bar high | Low higher than the middle bar low |
| Middle bar | Highest high of the five bars | Lowest low of the five bars |
| One bar right | High lower than the middle bar high | Low higher than the middle bar low |
| Two bars right | High lower than the middle bar high | Low higher than the middle bar low |
Put numbers on it. Suppose five EURUSD hourly bars have highs of 1.0940, 1.0955, 1.0970, 1.0950 and 1.0945. The middle bar, at 1.0970, is higher than both bars on each side, so once the fifth bar closes, a bearish fractal is confirmed at 1.0970. If the fifth bar had instead printed a high of 1.0975, there would be no fractal at all, no matter how good the first four bars looked. The rule is all five bars or nothing.
The formula box is the whole indicator, and it fits in three lines:
| Condition | Rule |
|---|---|
| Bearish fractal confirmed | High of the middle bar is greater than the highs of the two bars before it and the two bars after it |
| Bullish fractal confirmed | Low of the middle bar is lower than the lows of the two bars before it and the two bars after it |
| Confirmation moment | Only when the second bar to the right closes; before that, the marker is a candidate, not a fractal |
That two-bar lag is not a flaw to work around. It is the price of objectivity. A swing cannot be known to be a swing until price has moved away from it on both sides, and the right side takes two bars to prove. Every fractal strategy that pretends otherwise is trading candidates and calling them fractals.
Why fractals alone lose on a funded account
On an unfunded demo, trading every fractal feels busy and occasionally brilliant. On a funded account it bleeds, for three reasons that all hit the daily loss limit directly. First, fractals print constantly. On a fifteen-minute chart, a new fractal appears every few hours, and most of them are meaningless wiggles inside a range. Second, a fractal marks a past turning point, not a future one, so a swing high in a strong uptrend is usually followed by a higher high, not a reversal. Trading every up fractal as a short in an uptrend is how I donated my first month of fractal experiments to the market. Third, the lag means your stop, placed beyond the fractal, is often far from the entry by the time the breakout confirms, which forces either a tiny position or a stop that eats a large share of the daily cap.
The funded-account answer is not to abandon fractals. It is to refuse most of them. A fractal is only useful when three things agree: the fractal itself, a trend filter that says which direction is allowed, and a session or level context that says this particular swing matters. Without the filter, I measured it myself in the test below, the raw signals lose money. With the filter, the same markers become a disciplined breakout and stop-placement system. That gap, not the indicator, is the article.
My funded settings: timeframe, flank and the Alligator filter
I trade fractals on the one-hour chart for entries and check the four-hour chart for direction. The one-hour chart prints enough fractals to trade most days without drowning me in noise, and the four-hour chart keeps me from buying a bullish fractal inside a four-hour downtrend. On the fifteen-minute chart I found the markers too dense to filter honestly, and on the daily chart there are too few to build a funded routine around.
| Setting | My funded value | Why |
|---|---|---|
| Chart for entries | One hour | Enough signals to trade, few enough to filter by hand |
| Chart for direction | Four hour | Keeps hourly fractals aligned with the bigger swing structure |
| Flank | Two bars each side (the classic five-bar rule) | The standard definition; wider flanks mark fewer, stronger swings but starve a daily routine |
| Trend filter | Alligator: price above all three lines, lines fanned out | Only longs when the Alligator is awake and pointing up; only shorts when it is awake and pointing down |
| Session filter | London and New York overlap only, 13:00 to 17:00 server time | Fractal breakouts outside liquid hours fake out far more often |
| News filter | No new trade within thirty minutes of red-folder news | A news spike through a fractal level is not a breakout, it is a lottery ticket |
The Alligator filter is the one I will not trade without. Williams himself filtered fractal breakouts with the Alligator, taking only breakouts beyond the most recent fractal in the direction the Alligator pointed. When the Alligator lines are tangled together, the animal is asleep, and I take no fractal trade at all, because a sleeping Alligator means a ranging market, and ranging markets print fractals the way a sprinkler prints puddles. The Alligator guide covers the jaw, teeth and lips in full; here, all you need is the rule: fanned lines in my direction, or no trade.
I also keep fractals separate from two relatives on this site, because confusing them costs money. Pivot points are calculated levels for the day, not observed swings, and volume profile marks where volume actually traded, not where price turned. A fractal level that also sits near a pivot or a high-volume node is stronger, and I note that confluence in my journal, but the fractal rule itself never changes.
The six rules I trade
Rule one: only confirmed fractals count. If the second bar to the right has not closed, there is no fractal, and there is no trade, no matter how perfect the shape looks. Rule two: only trade in the Alligator’s direction. Longs only when price is above a fanned, rising Alligator; shorts only when price is below a fanned, falling one. Rule three: enter on the break, not on the fractal. For a long, I place a buy stop a few pips above the high of the bullish fractal bar, and I enter only when price closes through it in the session window. Rule four: the stop goes beyond the fractal extreme, never inside it. For a long, the stop sits below the fractal low, because a break of that low invalidates the swing I traded. Rule five: the first target is the nearest opposing fractal level, and the second target is twice the risk, so every trade is planned at one-to-one or better before I enter. Rule six: one fractal trade per session, win or lose, because the second trade of a session is almost always revenge dressed up as analysis.
That stop rule deserves emphasis, because it is where funded traders quietly blow up. A stop placed inside the fractal swing, a few pips below the entry to keep the position big, gets hunted by normal noise and then the trader re-enters, bigger, angrier, and now outside the plan. A stop beyond the fractal low is honest: if price takes it out, my read of the swing was wrong, and the loss is the planned one. The sizing maths below only works because the stop is honest first.
Worked example: a EURUSD long, priced to the pip
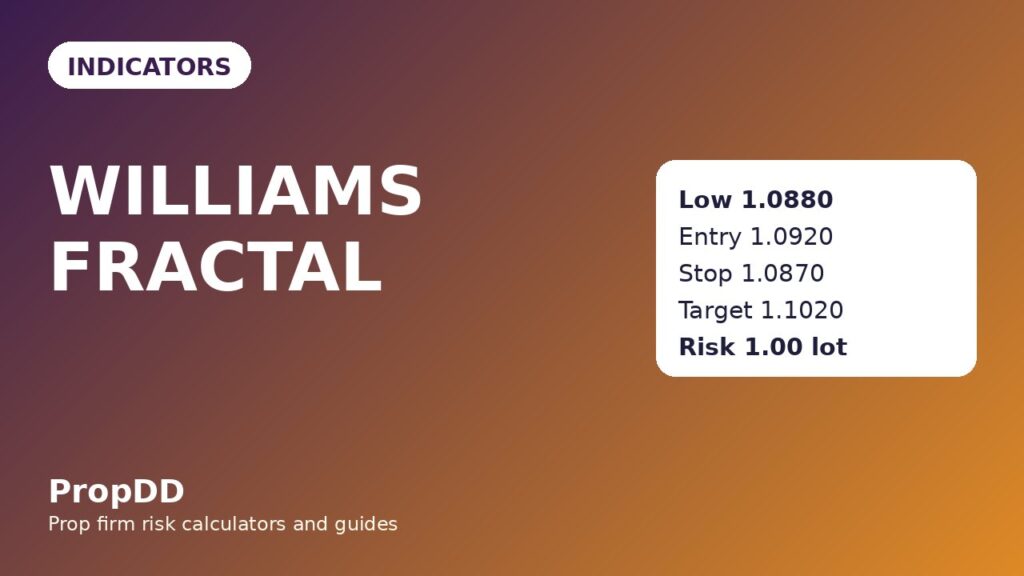
Here is a real-shaped example from my journal, with the numbers exactly as I traded them. EURUSD had fallen for two days, then printed a bullish fractal on the one-hour chart: a middle bar with a low of 1.0880, flanked by two higher lows on each side. The four-hour Alligator was fanned and rising, price was above all three lines, and the session window was open. The fractal bar’s high was 1.0915. My buy stop sat just above it, and price closed through it during the London afternoon.
| Element | Level | Reason |
|---|---|---|
| Bullish fractal low | 1.0880 | Lowest low of five bars, confirmed after two bars to the right closed |
| Fractal bar high | 1.0915 | Breakout trigger level for the long |
| Entry | 1.0920 | Buy stop above the fractal bar high, filled on the confirming close |
| Stop loss | 1.0870 | Ten pips below the fractal low; a break here invalidates the swing |
| Stop distance | 50 pips | 1.0920 minus 1.0870 |
| First target | 1.0970 | 50 pips, one times risk, near the last bearish fractal high |
| Second target | 1.1020 | 100 pips, two times risk |
The sizing maths runs through the same formula I use for every trade on this site. My personal daily stop is 500 dollars, which is ten percent of the firm’s 5,000 dollar daily loss limit, so a single stopped trade can never take more than a tenth of the day’s room. One pip on one lot of EURUSD is worth ten dollars, so the position size is the risk divided by the stop in pips times ten dollars:
| Calculation | Maths | Result |
|---|---|---|
| Risk per trade | 10 percent of the 5,000 dollar daily limit | 500 dollars |
| Position size | 500 divided by (50 pips times 10 dollars) | 1.00 lot |
| First target value | 50 pips times 10 dollars times 1.00 lot | 500 dollars, or one times risk |
| Second target value | 100 pips times 10 dollars times 1.00 lot | 1,000 dollars, or two times risk |
| Daily room after a full stop | 5,000 dollars minus 500 dollars | 4,500 dollars left for the day |
I run the same check through the max daily drawdown calculator before every session, because the calculator forces me to type the numbers instead of trusting my head. The trade itself played out the boring way good trades do: price reached the first target, I moved the stop to breakeven, and price continued to the second target for a two-times-risk win of 1,000 dollars. The boring part is the point. A fractal trade that needs excitement to work is a gamble, and gambles are what the daily loss limit is designed to punish.
When the stop distance changes, the size must change with it, or the risk silently changes instead. This grid is the one taped to my monitor, all at 500 dollars of risk:
| Stop distance | Position size | Value of one times risk |
|---|---|---|
| 25 pips | 2.00 lots | 500 dollars |
| 30 pips | 1.67 lots | 500 dollars |
| 40 pips | 1.25 lots | 500 dollars |
| 50 pips | 1.00 lot | 500 dollars |
| 60 pips | 0.83 lots | 500 dollars |
Notice what the grid refuses to do. A 50-pip stop does not get a 2.00-lot position because I feel confident. Confidence is not an input to the formula. The formula has exactly three inputs, risk, stop distance and pip value, and every trade I have ever regretted on a funded account started by letting a fourth input, usually a feeling, sneak in.
I tested it: twelve filtered trades against twenty raw breaks
I ran this as a proper comparison, not a victory lap. Over four weeks I logged every fractal breakout on EURUSD one-hour charts in two columns: the filtered set, which passed the Alligator, session and news rules, and the raw set, which took every confirmed fractal break regardless of filter. The filtered set produced twelve trades. The raw set produced twenty. The difference is the article in one table.
| Trade | Setup | Result in risk multiples |
|---|---|---|
| 1 | Bullish fractal, Alligator up | Plus 1.0 |
| 2 | Bullish fractal, Alligator up | Plus 2.0 |
| 3 | Bearish fractal, Alligator down | Plus 1.5 |
| 4 | Bullish fractal, Alligator up | Minus 1.0 |
| 5 | Bearish fractal, Alligator down | Plus 2.0 |
| 6 | Bullish fractal, Alligator up | Plus 1.0 |
| 7 | Bearish fractal, Alligator down | Minus 1.0 |
| 8 | Bullish fractal, Alligator up | Plus 2.0 |
| 9 | Bearish fractal, Alligator down | Plus 1.5 |
| 10 | Bullish fractal, Alligator up | Minus 1.0 |
| 11 | Bearish fractal, Alligator down | Plus 2.0 |
| 12 | Bullish fractal, Alligator up | Minus 1.0 |
Add the filtered column up: eight wins totalling 13.0 risk multiples, four losses totalling 4.0, net plus 9.0 risk multiples, which at 500 dollars of risk per trade is plus 4,500 dollars. The average winner is 1.63 risk multiples, and the best single trade, 1,000 dollars, is 22.2 percent of the net profit, inside the thirty percent consistency cap most firms apply, so no single trade dominates the result. Now the raw column: twenty fractal breaks with no filter, seven wins totalling 10.5 risk multiples, thirteen losses totalling 13.0, net minus 2.5 risk multiples, or minus 1,250 dollars at the same risk. Same indicator, same market, same month. The filter did not improve the fractal. It removed the trades the fractal was never qualified to take.
Two details from the journal matter more than the headline. First, the filtered losers were all clean, planned losses: the stop beyond the fractal was hit, the thesis was wrong, and the day continued. None of them spiralled, because the one-trade-per-session rule left no room for a revenge second trade. Second, the biggest raw-set damage came from the Asian session, where fractal breaks faked out again and again on thin liquidity. The session filter alone would have saved most of that column, which is why it stays in the rules even on days when I am tempted to trade early.
Common mistakes that turn fractals into losses
The first mistake is trading the candidate. If you enter before the second bar to the right closes, you are not trading a fractal, you are guessing that a fractal will form, and the market charges full price for that guess. The second mistake is trading every fractal. A chart prints dozens of them a week, and most are noise inside a range; the Alligator filter exists precisely to say no to most of them. The third mistake is placing the stop inside the swing, close to the entry, to justify a bigger position. That stop is not a stop, it is a donation to normal market noise, and it breaks the sizing maths that the whole plan rests on. The fourth mistake is chasing the breakout after it has already run twice the risk away from the fractal level. A late entry has a stop that no longer belongs to the swing, and a target that no longer pays for the risk.
The fifth mistake is subtler, and it cost me a payout review once: using fractals as reversal signals in a strong trend. A bearish fractal in an uptrend is a pause, not a top, and shorting it because the triangle printed is fighting the trend with a lagging marker. Williams designed fractals as breakout levels in the trend’s direction, and the trend pullback strategy on this site makes the same point from the price-action side: trade with the direction, use the swing only for timing and stops. If you remember one sentence from this article, make it this one: a fractal tells you where the swing is, the trend filter tells you whether you are allowed to trade it, and neither one works alone.
How fractals fit prop firm rules
Fractals fit funded rules well, but only in the filtered form. The daily loss limit is protected because every trade risks a fixed 500 dollars, the stop sits beyond a real swing rather than at an arbitrary distance, and the one-trade-per-session rule caps the day’s fractal damage at that single planned loss. The consistency rule is protected because targets are planned at one and two times risk, so no single win balloons past thirty percent of the total, as the test above shows. The trailing drawdown rule, the one that quietly ends most funded accounts, is protected by the breakeven move at the first target: once price reaches one times risk, the stop moves to entry, and the trade can no longer add to the drawdown, even if it later reverses.
What fractals do not do is exempt you from any firm rule. They do not make news trading safe, they do not justify holding through a weekend gap, and they do not turn a martingale recovery into a plan. A fractal level that breaks on a news spike is not a failed indicator, it is a trade that should never have been taken, and the thirty-minute news filter is there for exactly that reason. Trade the filtered system, log every fractal you skip as well as every one you take, and after a month you will have your own version of the table above, which is worth more than any article, including this one.
My daily fractal routine
| Step | Action | Time |
|---|---|---|
| 1 | Check the four-hour Alligator direction and mark the latest confirmed fractals | Before the London session |
| 2 | Note the nearest opposing fractal levels as targets and invalidation points | Before the London session |
| 3 | Run the drawdown calculator and confirm 500 dollars of room for one trade | Before the session window |
| 4 | Wait for a confirmed fractal break in the Alligator direction, inside 13:00 to 17:00 server time | Session window only |
| 5 | Enter on the break, stop beyond the fractal extreme, targets at one and two times risk | On confirmation |
| 6 | Move the stop to breakeven at the first target, then stop trading fractals for the day | After the first target, or after one loss |
Frequently asked questions
What is a Williams fractal in simple terms?
A Williams fractal is a five-bar pattern that marks a swing high or a swing low. The middle bar must have the highest high, for a bearish fractal, or the lowest low, for a bullish fractal, compared with the two bars on each side. It is confirmed only when the second bar to the right has closed.
Why does a fractal appear two bars late?
Because a swing cannot be confirmed until price has moved away from it on both sides. The left side is history by the time you look, and the right side needs two closed bars to prove the extreme held. That lag is built into the definition, not a setting you can remove.
Can I trade fractals without the Alligator?
You can, but my own test says you should not on a funded account. Twenty unfiltered fractal breaks lost 2.5 risk multiples in the same month that twelve Alligator-filtered trades gained 9.0. Any trend filter is better than none, but the Alligator is the filter Williams designed for this job.
What timeframe works best for fractals on a funded account?
I use the one-hour chart for entries and the four-hour chart for direction. Shorter charts print too many meaningless fractals, and the daily chart prints too few to build a routine around. Whatever timeframe you choose, keep the two-bar confirmation rule unchanged.
Where should the stop loss go on a fractal trade?
Beyond the fractal extreme: below the fractal low for a long, above the fractal high for a short. A stop inside the swing gets hit by normal noise and invalidates the sizing maths, because the trade’s risk is no longer the distance to a real invalidation point.
Do fractals repaint?
Unconfirmed fractals disappear, because the pattern can still fail while the right-hand bars are forming. Confirmed fractals do not repaint: once the second bar to the right has closed, the five-bar pattern is fixed history. That is why the confirmation rule, not the marker, is the real indicator.
Trading fractals on a funded account is a discipline exercise disguised as an indicator, and the discipline is mostly saying no: no to unconfirmed triangles, no to counter-trend swings, no to quiet sessions, no to a second trade after a loss. Say no to those, and the five-bar markers that remain are some of the cleanest entry and stop levels on the chart. For the textbook definition behind the five-bar rule, see the LuxAlgo guide to Williams fractals. Risk disclaimer: this article is educational only and is not financial advice. Trading leveraged products carries a high risk of loss, and past results, including the test log above, do not guarantee future results. Never risk money you cannot afford to lose, and always trade within your firm’s rules.




1 comment
[…] it has no bounded range and no overbought level. And it is not a swing-point marker like the Williams fractal, which labels completed five-bar highs and lows after the fact. The activator is a live state […]