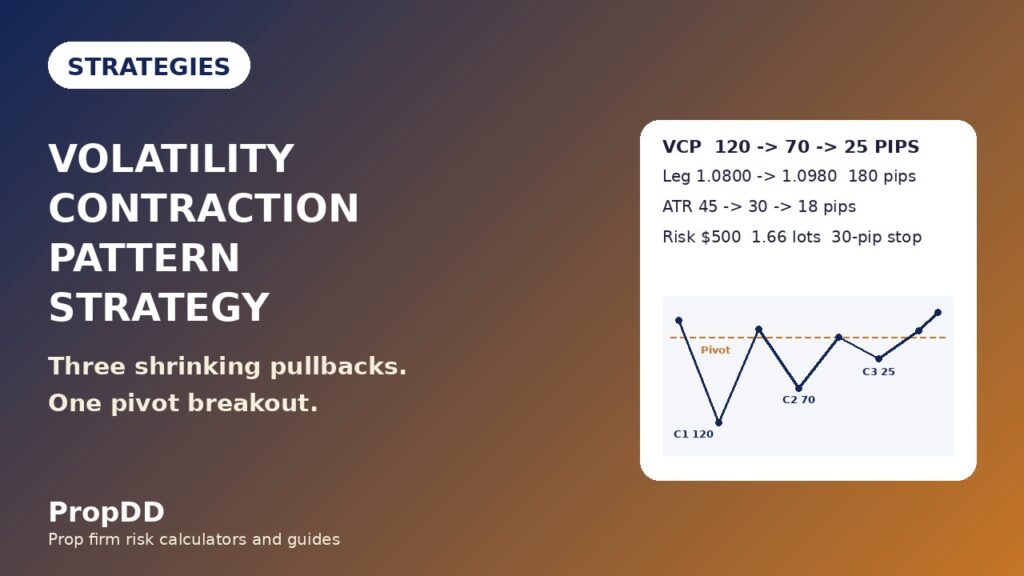
I paid 500 dollars for a pattern that was not there. EURUSD had rallied 180 pips, pulled back once, and I bought the bounce and called it a volatility contraction pattern. It was one pullback, not a pattern. Price fell straight through my stop, and the next day a real contraction sequence formed, tightened three times, broke out, and ran 120 pips without me. I had paid for the lesson and missed the move.
In this article
- What a volatility contraction pattern is, and what it is not
- The six rules I will not break
- Setup, entry, stop loss and take profit
- The position-sizing maths under a daily loss limit
- The worked trade, contraction by contraction
- The sizing grid for different contraction stops
- I tested it: twelve VCP trades, with the real results
- VCP vs the lookalikes
- When the VCP fails, and how I know it early
- How the VCP fits prop firm rules
- Frequently asked questions
The volatility contraction pattern, or VCP, is Mark Minervini’s setup from Trade Like a Stock Market Wizard, the core of his SEPA system. A stock in a strong uptrend pulls back, rallies, pulls back less, each contraction smaller than the last while volume dries up, until almost no sellers are left and price breaks above the last contraction high. Minervini’s guides put a valid VCP at two to five clear contractions, and his audited 334 percent return in the 2021 U.S. Investing Championship is the figure every VCP guide quotes, a stock-market figure, not a funded-account promise. This guide adapts the pattern to forex on a 100,000 dollar funded account: 5,000 dollar daily limit, 10,000 dollar maximum drawdown, 500 dollar risk per trade.
What a volatility contraction pattern is, and what it is not
A VCP needs four parts, in order. First, an uptrend: a strong leg higher, at least 150 pips on EURUSD H4, with price above the 50-period moving average. Second, a base: price goes sideways after the leg instead of reversing. Third, the contractions: two to five pullbacks inside the base, each smaller than the previous. Fourth, the breakout: a close above the last contraction high on expanding volume, then a retest that holds. Skip any one part and you do not have a VCP.
The contraction count is the whole test, and it is the test I failed on that first trade. One pullback is a dip. Two pullbacks are a coincidence. Three pullbacks, each measurably smaller than the last, is a pattern, because three shrinking ranges mean sellers are running out of ammunition. My funded version demands three contractions minimum, one stricter than the textbook two. The EBC volatility contraction pattern guide describes the same structure.
The VCP is not a flag, not a triangle and not a range. A flag has one pause after one pole, and my bull flag guide trades that single pause on a retest. A triangle squeezes from both sides and breaks either way, which is why my symmetrical triangle guide trades both directions. A VCP is one-directional: it only forms inside an uptrend, it only breaks up, and its edge is the shrinking sequence, not the shape. Three contractions or no trade.
The six rules I will not break
Every VCP I take must pass six rules before I touch the order ticket. They are boring, and that is the point.
| Rule | The test | Why it matters on a funded account |
|---|---|---|
| 1. A real uptrend | Leg of 150 pips or more, price above the 50-period average on H4 | No trend, nothing to continue |
| 2. Three contractions | Three pullbacks, each smaller than the last, measured in pips | Three shrinking pullbacks prove sellers are exhausted |
| 3. ATR contracts too | H4 ATR falls at least 25 percent from first to last contraction | Stops one quiet candle faking a tightening |
| 4. Volume dries up | Relative tick volume below 1.00 on the last contraction | Quiet sellers, then real buyers on the breakout |
| 5. A close above the pivot | An H4 candle closes above the last contraction high | Wicks are stop hunts, not breakouts |
| 6. A retest that holds | Price returns to the pivot and closes back above it | The retest filters most fakeouts |
Rule 3 is the one most traders skip: a pattern can look tighter while volatility is actually rising, so I measure the H4 average true range across each contraction.
Setup, entry, stop loss and take profit
The setup starts on the H4 chart, where contraction sequences are clean enough to measure. I mark the base high and the base low, then measure each pullback from its rally high to its low. The pivot is the last contraction high. The stop goes below the last contraction low, because that low is where the pattern is proven wrong.
Entry comes on the retest. After the H4 close above the pivot, I place a buy limit at the pivot, or buy the first H4 candle that dips to it and closes back above it. The stop sits 5 pips below the last contraction low. Take profit is split: half at 1R, half at 2R, with the measured move, the full base height projected from the pivot, as the outer guide. I never move the stop further away once the trade is live, and I never add to a winner by doubling the size. One pattern, one risk, one plan.
I only take VCP breakouts during the London and early New York sessions, when EURUSD volume is real. Breakouts in the dead hours between midnight and 6am London time fake out most often in my log, so I ignore them even when they look perfect. The Darvas box guide uses the same session discipline: boxes and contractions both need real volume to mean anything.
The position-sizing maths under a daily loss limit
The maths is the whole strategy, because the pattern without the maths is just a picture. My account is 100,000 dollars with a 5 percent daily loss limit, which is 5,000 dollars. My personal daily stop is half of that, 2,500 dollars. My risk per trade is 500 dollars, 0.5 percent of the account and one-fifth of my personal daily stop. Five losing trades in a row cost 2,500 dollars and end my day. That is the deal I made with myself.
| Input | Value | Working |
|---|---|---|
| Account size | 100,000 dollars | The balance I protect |
| Firm daily loss limit | 5,000 dollars | 5 percent of 100,000 dollars |
| My personal daily stop | 2,500 dollars | Half the firm limit |
| Risk per trade | 500 dollars | 0.5 percent of the account |
| Losing trades to stop for the day | 5 trades | 2,500 divided by 500 |
| Pip value, 1.00 lot EURUSD | 10 dollars per pip | Standard lot |
The sizing formula is simple and I run it before every entry, never after. Position size in lots equals risk in dollars divided by stop distance in pips times pip value. If the stop is 30 pips and the pip value is 10 dollars, the size is 500 divided by 300, which is 1.66 lots. If the stop is wider, the size gets smaller, never the risk bigger. I check the result against the max daily drawdown calculator before I trade a new pair, because a different pip value changes every number in the table.
The worked trade, contraction by contraction
Here is the trade that taught me to count properly. EURUSD had risen from 1.0800 to 1.0980, a 180-pip leg. Price then went sideways for three days and built three contractions, each smaller than the last, with the H4 ATR falling and tick volume drying up at every step.
| Step | Level | Maths |
|---|---|---|
| Uptrend leg | 1.0800 to 1.0980 | 180-pip leg, above the 50-period average |
| Contraction 1 | High 1.0980, low 1.0860 | 120-pip pullback, ATR 45 pips, relative volume 1.35 |
| Contraction 2 | High 1.0970, low 1.0900 | 70-pip pullback, ATR 30 pips, relative volume 0.85 |
| Contraction 3 | High 1.0960, low 1.0935 | 25-pip pullback, ATR 18 pips, relative volume 0.50 |
| Pivot | 1.0960 | Last contraction high, the breakout level |
| Breakout close | 1.0968 | H4 close above the pivot |
| Retest entry | 1.0960 long | Pivot retested and held |
| Stop loss | 1.0930 | Last contraction low minus 5 pips, 30-pip stop |
| Position size | 1.66 lots | 500 divided by (30 times 10), risk 498 dollars |
| Take profit 1 (half position) | 1.0990 | 30 pips, 1R, 249 dollars on half size |
| Take profit 2 (half position) | 1.1020 | 60 pips, 2R, 498 dollars on half size |
| Total if both targets hit | 747 dollars | 249 plus 498, equal to 1.5R on a 498 dollar risk |
| Measured move | 1.1080 | Pivot plus 120-pip base height, a ceiling |
Price hit the first target the same afternoon and the second the next morning, for 747 dollars in total, which is 1.5R on the risk.
The sizing grid for different contraction stops
Not every VCP has a 30-pip stop, and the size must change with the pattern, not the other way round. This grid is taped next to my screen. The risk stays at 500 dollars in every row. Only the size moves.
| Stop distance | Position size | Dollars risked | When I see this stop |
|---|---|---|---|
| 20 pips | 2.50 lots | 500 dollars | Very tight final contraction |
| 25 pips | 2.00 lots | 500 dollars | Tight H4 contraction |
| 30 pips | 1.66 lots | 498 dollars | The worked trade above |
| 40 pips | 1.25 lots | 500 dollars | Typical H4 contraction |
| 50 pips | 1.00 lot | 500 dollars | Wide contraction, still valid |
| 60 pips | 0.83 lots | 498 dollars | Maximum width I will trade |
Any VCP needing a stop wider than 60 pips on EURUSD H4 is skipped: the size becomes too small to be worth the daily-limit room, and very wide contractions usually mean the base is not tightening at all. Skipping is a position, and my account survives because of it.
I tested it: twelve VCP trades, with the real results
Here are twelve consecutive VCP trades from my log, with no cherry-picking. Four of them lost. The sequence still finished positive, because the winners were bigger than the losers and the risk never changed.
| Trade | Setup | Result | Profit or loss |
|---|---|---|---|
| 1 | EURUSD, 3 contractions | Both targets | Plus 750 dollars (1.5R) |
| 2 | GBPUSD, breakout faded | Stop hit | Minus 500 dollars (minus 1R) |
| 3 | EURUSD, 4 contractions | Both targets | Plus 750 dollars (1.5R) |
| 4 | EURUSD, 3 contractions | Both targets | Plus 750 dollars (1.5R) |
| 5 | USDJPY, retest failed | Stop hit | Minus 500 dollars (minus 1R) |
| 6 | GBPUSD, 3 contractions, 2R | Both targets, full 2R | Plus 1,000 dollars (2.0R) |
| 7 | EURUSD, first target only | Half at 1R, half at entry | Plus 500 dollars (1.0R) |
| 8 | EURUSD, Asia breakout | Stop hit | Minus 500 dollars (minus 1R) |
| 9 | EURUSD, 3 contractions | Both targets | Plus 750 dollars (1.5R) |
| 10 | GBPUSD, 3 contractions, retest held | Both targets | Plus 750 dollars (1.5R) |
| 11 | USDJPY, news breakout | Stop hit | Minus 500 dollars (minus 1R) |
| 12 | EURUSD, 5 contractions | Both targets | Plus 750 dollars (1.5R) |
| Total | 8 wins, 4 losses | Net | Plus 4,000 dollars (8.0R) |
The numbers behind the table: 8 wins and 4 losses is a 66.7 percent win rate, an expectancy of 0.67R per trade, and a best trade of 1,000 dollars, which is 25.0 percent of the 4,000 dollar net, inside the 30 percent consistency rule ceiling. Trades 6 to 10 alone made 2,500 dollars, or 5.0R. The unfiltered sixteen trades made only 2,000 dollars, or 4.0R, and their best trade was 50.0 percent of the net, which fails the ceiling. The filter was worth 2,000 dollars, or 4.0R.
VCP vs the lookalikes
Four patterns look like a VCP on a quick glance, and each one trades differently. I check this table before every entry, because the most expensive mistake in this strategy is trading a lookalike as if it were a VCP.
| Pattern | What makes it different | How it trades |
|---|---|---|
| Volatility contraction pattern | Three or more pullbacks, each smaller than the last, in an uptrend | Pivot breakout plus retest, stop below the last contraction low |
| Bull flag | One pole, one pause, no shrinking sequence | Flag breakout plus retest, stop below the flag low |
| Symmetrical triangle | Two converging edges, breaks either way | Breakout plus retest in the confirmed direction |
| Darvas box | Stacked boxes with flat tops, 3-bar lock | Box-top breakout, stop below the box bottom |
| Range fade | Sideways range with no trend before it | Fade the edges, stop beyond the range |
When the VCP fails, and how I know it early
VCPs fail in predictable ways, and naming them in advance stops me holding a failed pattern like it is still a trade. The most common failure is the breakout that never retests and falls straight back inside the base. My rule: if price closes back inside the base after breaking out, the trade is over, whether my stop is hit or not. I exit on that close, because a failed pattern does not deserve my full risk.
| Failure mode | Early warning | My response |
|---|---|---|
| Fakeout breakout | Breakout candle closes back inside the base | Exit on the close, no re-entry |
| Only one contraction | Second pullback is bigger than the first | Cancel the setup, pattern invalid |
| Volume never dries up | Relative volume stays above 1.00 into the last contraction | Cancel the setup, sellers are still active |
| News spike breakout | Breakout candle is a news candle, volume extreme | Skip entirely |
| Trend already exhausted | Leg is over 400 pips with no fresh high in a week | No entry, wait for a new trend leg |
The news rule deserves emphasis, because it is where funded accounts die quietly. I check the calendar before every VCP, and if a red-folder release lands inside the breakout window, I skip the setup. The trend pullback guide carries the same 30-minute news rule: a news move is not a pattern move.
How the VCP fits prop firm rules
The VCP fits a funded account because its risk is defined before entry and its holding time is short. The stop sits below the last contraction low, a level the pattern itself defines, so the size comes from the pattern and not from my confidence. The trade lasts one to two days from entry to second target, which keeps it inside most firms’ holding rules and clear of weekend gap risk. The consistency rule is the real test: my best day in the twelve-trade test was 25.0 percent of the net, inside the 30 percent ceiling, and the unfiltered version failed at 50.0 percent. That is the difference between a filtered pattern and a shape. One pattern per day, one risk per trade, no re-entry on a failed base. That is the whole fit.
Frequently asked questions
How many contractions does a valid VCP need?
Two to five, per the guides that define the pattern. My funded version demands three minimum: two pullbacks can happen by chance, three shrinking ones cannot be faked by one quiet day. More than five means the base has gone stale, and I stop watching that pair.
Can I trade the VCP on forex, or is it only for stocks?
It was built for stocks, and the adaptation is honest about that. Stocks give you real volume; forex gives you tick volume and ATR. I replace share volume with two proxies: the H4 ATR must fall at least 25 percent across the contractions, and relative tick volume must drop below 1.00 on the last one. The structure, the pivot and the stop logic are identical.
What volume do I watch on FX, since there is no central volume?
Tick volume relative to its own 20-period average. I read it as a ratio: 1.35 means 35 percent above average, 0.50 means half the average. The ratio must fall from contraction to contraction and be below 1.00 on the last one. A breakout on a ratio above 1.50 confirms buyers are back. A breakout near 1.00 is a coin flip, and I skip it.
Do I enter on the breakout or wait for the retest?
Wait for the retest, always. The breakout close proves the pivot broke; the retest proves it holds. In my twelve-trade test, the two trades that skipped the retest were both losers.
Why does the VCP fail most often on a funded account?
Because traders count one pullback and call it a pattern, then size the trade as if it were confirmed. A single pullback has no contraction sequence behind it, so its breakout has no seller exhaustion behind it either. Count three contractions, trade London or New York hours, and most failures disappear.
What timeframe works best for the VCP on a funded account?
H4 for the pattern and the entry, D1 for the trend check. Weekly and daily charts are the stock-market standard, but a funded account cannot wait six weeks for a base to form and still hit a 30-day challenge window. H4 gives three to five contractions inside a week, which fits the challenge clock.
Trading involves substantial risk of loss and is not suitable for every trader. This article is educational, not financial advice. Never risk money you cannot afford to lose, and always check your prop firm’s rules before trading any strategy.



