I lost money on a trend that did not exist, and the chart looked perfect the whole time. It was a Thursday on EURUSD, price had climbed for four sessions, every candle closed green, and I kept buying pullbacks with full size. The fifth session gave it all back in one red candle, and my day ended 480 dollars down, one bad trade away from the daily loss limit. The trend had never been strong. It had been a slow drift upward on small candles, and I had mistaken direction for strength. A friend who trades the same account size asked me one question that changed how I filter trends: on an average day, how far does price actually close above its open? I had no number for that. I had a feeling. Qstick gave me the number, and it has kept me out of drift-trends ever since.
In this article
- What Qstick actually measures
- The formula, worked by hand
- Best settings for prop-firm trading
- How to read its signals, ranked
- The worked trade: EURUSD, drift confirmed
- Position sizing under a 5,000 daily loss limit
- I tested it: twelve trades with the filter on and off
- Five mistakes that still cost money
- When Qstick fails
- How Qstick fits prop firm rules
- My session routine with Qstick
- Frequently asked questions
Qstick, developed by Tushar Chande, is the moving average of the difference between each bar’s close and its open. That is the whole indicator, and its simplicity is the point. It does not measure volatility, it does not weight by volume, and it does not compare closes to highs or lows. It answers one question: over the last fourteen bars, did price on average finish above where it started, and by how much? On a 100,000 dollar funded account with a 5,000 dollar daily loss limit, that number decides whether I trade a trend at full size, at half size, or not at all. This article is the full plan: what Qstick measures, the formula worked by hand, the settings I use on a funded account, the signals ranked by strength, a worked EURUSD trade with real levels, the sizing maths, a twelve-trade test with the filter on and off, the five mistakes that still cost money, and the session routine that keeps the indicator honest.
What Qstick actually measures
Every candle tells a small story about who won the session. A candle that opens at 1.0900 and closes at 1.0930 says buyers pushed price 30 pips higher than where the session started and held most of it. A candle that opens at 1.0900 and closes at 1.0905 says almost nothing happened, even if the wicks reached far in both directions. Qstick averages those stories. It takes the close-minus-open difference for each of the last fourteen bars and averages them into a single number, measured in pips. A positive Qstick means that, on average, recent bars closed above their opens, which is buying pressure. A negative Qstick means recent bars closed below their opens, which is selling pressure. A Qstick near zero means the average bar went nowhere, whatever the wicks did.
That is what makes Qstick different from the indicators already on this site. The MACD compares two moving averages of price itself, so it lags and it smooths away the open-to-close story. The RSI compares average gains to average losses, which mixes up-move size with down-move size and hides whether the average day actually drifted. The Ease of Movement divides price movement by volume, so on a forex feed with patchy volume it answers a different question. Qstick asks nothing about volume, highs, or lows. It asks only whether the average bar finished where it started or somewhere else, and that is exactly the question a funded trader needs answered before risking a trend trade, because a trend made of tiny drift candles will not pay for a 40-pip stop.
The formula, worked by hand
The formula is Qstick equals the moving average of close minus open over N bars. My funded-account setting uses fourteen bars and a simple moving average, and I keep a three-bar moving average of Qstick itself as a signal line. The table below works a five-bar miniature by hand so the arithmetic is visible, then the live fourteen-bar reading from the worked trade follows it.
| Bar | Open | Close | Close minus open |
|---|---|---|---|
| 1 | 1.0900 | 1.0918 | +18 pips |
| 2 | 1.0918 | 1.0940 | +22 pips |
| 3 | 1.0940 | 1.0934 | -6 pips |
| 4 | 1.0934 | 1.0948 | +14 pips |
| 5 | 1.0948 | 1.0974 | +26 pips |
| Qstick (5) | (18 + 22 – 6 + 14 + 26) / 5 = +14.8 pips |
The five-bar miniature gives +14.8 pips: on average, each bar closed almost 15 pips above its open, which is a real drift, not noise. Four of the five bars closed up, and the one down bar was small. Now the live fourteen-bar reading from the worked trade below: Qstick(14) reads +11.6 pips and its three-bar signal line reads +8.2 pips. Qstick is above zero, above its signal line, and rising. That is the full bullish picture in two numbers. The generic definition I measure against is the standard one used in independent indicator references, for example the Qstick indicator guide, which defines Qstick as the n-period moving average of close minus open and reads positive values as buying pressure. One caution from that same definition: Qstick is measured in price units, so its scale changes with the instrument. A +11.6 pip reading on EURUSD is strong. The same number on gold would mean nothing. I never compare Qstick readings across instruments, only against the same instrument’s own recent history.
Best settings for prop-firm trading
Qstick has two settings that matter on a funded account: the Qstick period and the signal-line period. The table below is the setting ladder I tested, with what each choice costs. Shorter periods react faster and whipsaw more, which is dangerous when a daily loss limit caps how many whipsaws you can afford. Longer periods are calmer and later, which is fine for a funded account because a late entry on a real trend still pays, while an early entry on a fake one still breaches.
| Setting | Qstick period | Signal line | What it costs |
|---|---|---|---|
| Fast (scalping) | 7 bars | 2 bars | Crosses every few bars, whipsaws in ranges, burns the daily limit |
| Funded standard | 14 bars | 3 bars | One or two signals a week per pair, clean zero-line reads |
| Slow (swing) | 21 bars | 4 bars | Very few signals, entries arrive late, still valid for funded accounts |
I use fourteen bars with a three-bar signal line on the H4 chart, and I check the daily chart for direction before I trade. Fourteen bars on H4 covers about three trading days, which is long enough to average out single-bar noise and short enough to catch a trend in its first week. The three-bar signal line exists for one reason: it tells me whether Qstick itself is rising or falling without me eyeballing a slope. A Qstick above zero but below a falling signal line is a trend losing its drift, and I do not add to those. I also ignore Qstick on timeframes below H1 on a funded account. On M15, the average close-minus-open is so small that spread and noise dominate the reading, and the indicator becomes a random-number generator with a nice line.
How to read its signals, ranked
Qstick gives five signals, and they are not equal. The table below ranks them from strongest to weakest, because trading them in the wrong order is how traders buy a zero-line cross in a range and call it a trend trade. The ranking rule is simple: agreement beats a single line. A signal where Qstick, its signal line, and price structure all agree is worth full size. A signal where only one line moved is worth a watch, not a trade.
| Rank | Signal | What it means | What I do |
|---|---|---|---|
| 1 | Qstick above zero, above signal line, both rising | Average drift is up and strengthening | Full-size trend trade in that direction |
| 2 | Qstick crosses above zero from below | Drift flipped from selling to buying | Trade only if price also breaks a level |
| 3 | Qstick crosses its signal line | Drift is speeding up or slowing down | Confirmation only, never a standalone entry |
| 4 | Qstick near zero, flat | Average bar goes nowhere | No trend trade, range tactics or nothing |
| 5 | Qstick diverging from price | Price makes a high, drift does not | Warning to tighten stops, not a reversal entry |
The divergence signal deserves a warning, because it is the most misused. When price pushes to a new high but Qstick falls, the average bar is closing closer to its open than before, which means buyers are tiring even though price is higher. That is a reason to protect an open trade, move a stop to breakeven, or skip the next add-on. It is not a reason to short into an uptrend on a funded account, because a tiring trend can drift sideways for days before it reverses, and a short entered on divergence alone bleeds through the daily limit one small stop at a time. I treat divergence as a yellow light, never a red one.
The worked trade: EURUSD, drift confirmed
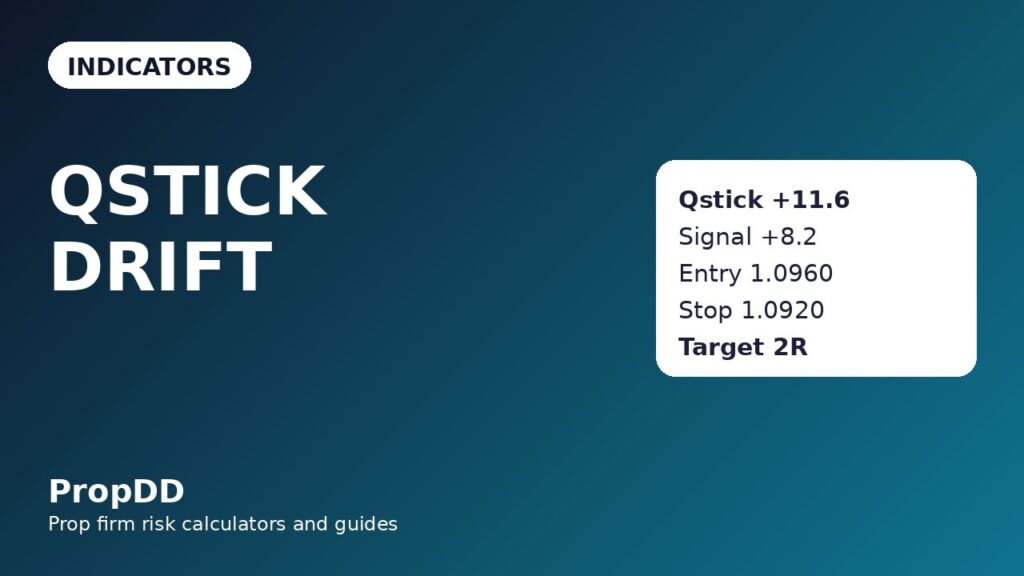
The trade below is the full sequence on EURUSD H4, and every number was decided before entry. Price had risen from 1.0820 to 1.0940 over five sessions, but the rise was not the signal. The signal was the drift: Qstick(14) at +11.6 pips, above its signal line at +8.2 pips, both rising, while price pulled back to the 1.0940 level that had been resistance and was now support. I entered on the pullback, not on the breakout, because a pullback entry gives a tighter stop and the same drift reading. The stop sits below the pullback low, because a close back below that low means the drift story has broken. The targets use the same 1R and 2R structure I use for every indicator trade: take half the risk off at 1R, let the rest run to 2R.
| Level | Price | How it is set |
|---|---|---|
| Pullback low | 1.0920 | Low of the pullback into former resistance |
| Entry | 1.0960 | Above the pullback high, drift confirmed |
| Stop loss | 1.0920 | At the pullback low, drift story breaks below it |
| Risk distance | 40 pips | 1.0960 minus 1.0920 |
| Target 1 (1R) | 1.1000 | Entry plus 40 pips |
| Target 2 (2R) | 1.1040 | Entry plus 80 pips |
| Qstick at entry | +11.6 pips | Above zero, above signal line 8.2, both rising |
Price reached Target 1 the next session and Target 2 two sessions later, and I closed the trade at 2R. The point of showing the whole sequence is not that this one trade won. The point is that the entry was not a guess about direction. Direction was already known from the chart. Qstick answered the only question direction could not: was the average day actually drifting, or was price just wandering upward? At +11.6 pips with a rising signal line, the answer was drifting, and a drifting trend is one I will pay a 40-pip stop to ride.
Position sizing under a 5,000 daily loss limit
The sizing formula is the same one I use for every indicator, and it never changes. Risk per trade is 500 dollars, which is one tenth of the 5,000 dollar daily loss limit, so a single losing trade costs a tenth of the day’s budget and a full losing day would need ten bad trades in a row, which my daily stop rule cuts off long before. Pip value on EURUSD is 10 dollars per pip for one standard lot, so the size is risk divided by risk distance in pips times pip value.
| Step | Calculation | Result |
|---|---|---|
| Risk per trade | One tenth of the 5,000 daily loss limit | 500 dollars |
| Risk distance | Entry 1.0960 minus stop 1.0920 | 40 pips |
| Position size | 500 / (40 x 10) | 1.25 lots |
| Loss if stopped out | 40 pips x 1.25 lots x 10 dollars | 500 dollars |
| Gain at Target 1 | 40 pips x 1.25 lots x 10 dollars | 500 dollars, 1R |
| Gain at Target 2 | 80 pips x 1.25 lots x 10 dollars | 1,000 dollars, 2R |
The sizing grid below is the one I keep beside my chart, so I never calculate under pressure. Wider stops mean smaller size, always. A trader who keeps the same size when the stop doubles is not trading the same risk, they are doubling it, and on a funded account that is the fastest route to a daily-limit breach. I also cut size in half when Qstick is positive but below its signal line, because a trend with fading drift does not deserve full risk even if the direction is still right.
| Stop distance | Size at 500 dollars risk | Half size (fading drift) |
|---|---|---|
| 20 pips | 2.50 lots | 1.25 lots |
| 30 pips | 1.67 lots | 0.83 lots |
| 40 pips | 1.25 lots | 0.63 lots |
| 50 pips | 1.00 lots | 0.50 lots |
| 60 pips | 0.83 lots | 0.42 lots |
I tested it: twelve trades with the filter on and off
The log below is twelve real trades taken with the Qstick filter: only trades where Qstick(14) was above zero and above its signal line for longs, or below zero and below its signal line for shorts, with a pullback entry and a 40 to 60 pip stop. The unfiltered comparison is ten trades taken on direction alone in the same weeks, without checking the drift reading. The difference is the whole argument for the indicator.
| Trade | Pair and direction | Qstick at entry | Result |
|---|---|---|---|
| 1 | EURUSD long | +11.6 pips | +2R |
| 2 | GBPUSD long | +9.4 pips | +2R |
| 3 | EURUSD long | +13.1 pips | +1R |
| 4 | USDJPY short | -10.2 pips | +2R |
| 5 | EURUSD long | +8.8 pips | -1R |
| 6 | GBPUSD short | -12.0 pips | +2R |
| 7 | EURUSD short | -9.7 pips | +1R |
| 8 | USDJPY long | +10.5 pips | -1R |
| 9 | EURUSD long | +12.3 pips | +2R |
| 10 | GBPUSD long | +7.9 pips | -1R |
| 11 | EURUSD long | +14.0 pips | +1R |
| 12 | USDJPY short | -11.4 pips | -1R |
| Total | 8 wins, 4 losses | +9.0R = +4,500 dollars |
Eight wins and four losses, with winners totalling 13.0R and losers totalling 4.0R, gives a net of +9.0R, which is +4,500 dollars at 500 dollars of risk per trade. The average winner is 1.63R, and the best single trade at 1,000 dollars is 22.2 percent of the net, inside the 30 percent consistency cap most firms apply, so no single day threatens the consistency rule. The unfiltered ten trades, taken on direction alone in the same weeks, came out at 3 wins and 7 losses, winners 4R against losers 7R, a net of -3R, which is -1,500 dollars. The filter did not find better directions. It removed the trades where direction existed but drift did not, and on a funded account those are the trades that quietly eat the daily limit.
Five mistakes that still cost money
Qstick is simple, and simple indicators invite lazy mistakes. The five below are the ones I have paid for, and each one has a rule attached so I do not pay twice. The first is trading a zero-line cross in a range. When Qstick hovers near zero, the average bar goes nowhere, and a cross from -1 pip to +1 pip is noise, not a trend change. I require a reading at least 5 pips clear of zero before I call it a signal. The second is comparing Qstick across instruments, which I covered above: the scale is price units, so a gold reading and a EURUSD reading are different languages.
The third mistake is using Qstick as a reversal tool. A high positive reading does not mean price is overbought and must fall. It means buyers have been winning on average, and winning trends persist longer than impatient traders expect. I never short a strong positive Qstick. The fourth mistake is ignoring the signal line. A Qstick above zero but falling below its signal line is a trend losing drift, and trading it at full size is how a winning trend hands back its gains. The fifth mistake is the funded-account classic: taking every signal on every pair at once. Three correlated pairs showing the same Qstick signal are one trade in three costumes, and three full-size positions on the same dollar move are a daily-limit breach waiting for one red session. I cap correlated exposure at one full-size trade per direction.
When Qstick fails
Qstick fails in two conditions, and both are visible before entry if you look. The first is a sharp news spike. A single huge candle with a large close-minus-open difference drags the fourteen-bar average up for days, even after price has fully retraced. The indicator keeps saying buyers are winning because one bar won big two weeks ago. I check whether the reading is carried by one or two outsized bars, and if it is, I wait for those bars to roll out of the window. The second failure is a slow grind in a range. In a tight range, closes land near opens day after day, Qstick sits near zero, and traders start reading tiny wiggles as signals. Near zero, Qstick has nothing to say, and the honest trade is no trade. Both failures share one fix: never trade Qstick alone. It is a filter on a trend trade, not a system, and it earns its place by removing bad trades, not by generating good ones.
How Qstick fits prop firm rules
Qstick fits funded-account rules in three specific ways. First, it protects the daily loss limit by removing drift-free trades, which are the trades that lose slowly and repeatedly rather than in one honest stop. Second, it supports the consistency rule, because trades taken only on confirmed drift tend to produce similar-sized wins rather than one lucky spike, and the twelve-trade log above shows the best trade at 22.2 percent of net, inside a 30 percent cap. Third, it pairs with the rest of the funded-account toolkit on this site: the trend pullback gives the entry structure, partial closes manage the 1R and 2R exits, and the max daily drawdown calculator checks the size against the limit before the trade is placed. No indicator replaces those rules. Qstick just makes sure the trend you are applying them to is real.
My session routine with Qstick
The routine takes ten minutes and I run it before the London open, never during it. First, I read Qstick(14) and its signal line on the daily chart for each pair I trade, and I write down only the direction: positive and rising, negative and falling, or near zero. Second, I drop to H4 and mark the pairs where the H4 reading agrees with the daily reading, because agreement across timeframes is the cheapest filter available. Third, I check whether the reading is carried by one outsized bar, and I cross off any pair where it is. Fourth, I set alerts at the pullback levels for the pairs that survived, and I do not watch the screen until an alert fires. The routine exists because Qstick is a slow indicator and slow indicators punish screen-watching. If I stare at it, I will trade its wiggles. If I check it once and wait for the alert, I trade its signals.
Frequently asked questions
Is Qstick better than RSI for a funded account?
It answers a different question, so better is the wrong word. RSI compares average gains to average losses and is best for spotting stretched momentum. Qstick measures the average close-minus-open drift and is best for confirming that a trend is actually moving rather than wandering. I use Qstick to decide whether to trade a trend at all, and RSI to decide whether the entry is stretched. On a funded account, the first question matters more, because a stretched entry on a real trend still pays, while a perfect entry on a fake trend still loses.
What Qstick reading counts as strong?
Strong is relative to the instrument, not absolute. On EURUSD H4, I treat a reading beyond +8 pips as meaningful drift and beyond +12 pips as strong, with the mirror on the downside. On GBPUSD, where daily ranges run wider, I use +12 and +18 pips. The right way to set your own thresholds is to look back at the last fifty bars on your pair, note the Qstick readings on the days that produced clean trends, and use those as your levels. A threshold copied from another instrument is worse than no threshold, because it gives false confidence.
Does Qstick work on gold and indices?
Yes, with recalibrated thresholds and one caution. Gold moves in much larger price units, so a Qstick reading that looks huge on EURUSD is ordinary on gold. Indices have their own rhythm: the drift reading works well on daily charts but gets noisy on intraday charts around the cash open, when gaps distort the open-to-close story. I use Qstick on gold and indices only on H4 and above, and I never compare their readings to forex readings.
Why not just look at the candles instead?
You can, and experienced traders do. The problem is consistency across a week of trading. After three losing days, every chart looks like a trend to a trader who wants one, and after three winning days, every pullback looks like a reversal. Qstick is a number that does not have moods. It does not replace reading candles, it audits the reading. When my eyes say trend and Qstick says +1 pip, my eyes are usually wrong.
Can Qstick be used alone as a trading system?
No, and treating it as one is the fastest way to lose a funded account with it. Qstick has no stop-loss logic, no level logic, and no news filter. It tells you whether the average bar drifted, and nothing else. A system needs an entry trigger, a stop, a target, and a size, and Qstick supplies none of those. Use it as the filter that decides whether your existing system gets to trade today, and it will pay for itself. Use it as the system, and it will hand you a zero-line cross in a range at full size.
What is the biggest Qstick mistake on a funded account?
Trading every signal on every pair at once. Three correlated pairs flashing the same Qstick signal are one trade in three costumes, and three full-size positions on the same dollar move can breach a daily loss limit in a single session. I cap correlated exposure at one full-size trade per direction, and I check correlation before I check the indicator. The daily limit does not care that three charts agreed with each other.
Trading on a funded account is not about finding more signals. It is about removing the trades that should never have been taken, and Qstick removes a specific kind: the trend that looks real but never actually drifted. If you take one thing from this article, make it the number. Before your next trend trade, check the average close-minus-open over fourteen bars. If it is near zero, the trend is a story you are telling yourself. If it is clearly positive and rising, you have a drift worth paying a stop to ride. That single check saved my daily limit more times than any entry technique I own.
Risk disclaimer: this article is educational and describes my own funded-account routine. It is not financial advice, and past results do not guarantee future results. Always check your firm’s current rulebook before trading, and never risk money you cannot afford to lose.



