I stopped trusting RSI on choppy days the week it cost me 1,400 dollars in five small cuts. It was a sideways EURUSD week, the kind where price drifts 40 pips up, 50 pips down, and never goes anywhere, and RSI kept flicking between 45 and 58 like a nervous needle. Every flick looked like a signal. None of them were. Three longs, two shorts, all stopped out, each one a neat 0.5 percent of my 100,000-dollar funded account gone to noise. The problem was not my entries, it was the measuring stick: RSI compares today’s close with yesterday’s close, so on a choppy chart it measures yesterday’s noise and calls it momentum. The Relative Momentum Index fixes exactly that one flaw, and it is the reason this guide exists. RMI compares today’s close with the close five bars back, which means it only registers a move that has actually lasted five bars, and the chop that kept stopping me out simply does not register.
In this article
- What the Relative Momentum Index actually measures
- RMI vs RSI: the one difference that matters
- The RMI formula, worked with real numbers
- Best RMI settings for prop firm trading
- How to read RMI signals without chasing them
- I tested it: a worked RMI trade with full sizing maths
- The sizing grid: what changes when the stop changes
- Twenty trades, filtered vs unfiltered
- Common RMI mistakes on funded accounts
- How RMI fits prop firm rules
- Frequently asked questions about the Relative Momentum Index
This is not a second RSI article dressed up with a new name. My RSI guide covers the classic oscillator in full, and you should read it first if you have never traded an oscillator on a funded account. This guide covers what RSI cannot do: how RMI’s momentum step changes the reading, the formula with a real worked calculation, the settings I actually use on a funded account, how to read its signals without chasing overbought and oversold zones, a full worked trade with sizing maths tied to a 5,000-dollar daily loss limit, the mistakes that turn RMI into just another noise machine, and how it fits the prop firm rules that end accounts. Everything uses a 100,000-dollar funded account with a 5,000-dollar daily loss limit, a 500-dollar per-trade risk cap, and a 30 percent consistency ceiling.
What the Relative Momentum Index actually measures
The Relative Momentum Index, or RMI, was introduced by Roger Altman in 1993 as a deliberate fix for RSI. RSI asks one question: over the last 14 bars, how big were the up closes compared with the down closes, bar by bar? RMI asks a slightly different question: over the last 20 momentum readings, how big were the up moves compared with the down moves, where each move is measured against the close five bars ago instead of the previous bar? That one change — the momentum step — is the whole indicator. A single-bar wiggle that reverses the next bar counts fully in RSI and barely counts in RMI, because RMI only credits a move that survives five bars.
Think of it as the difference between judging a runner by one stride and judging them by five strides. One stride can be a stumble. Five strides tell you whether they are actually running. On a funded account that distinction is worth real money, because every false signal you take costs you a slice of your daily loss limit, and a 5,000-dollar limit only absorbs ten full 500-dollar losses before the day is over. RMI does not find more trades than RSI. It finds fewer, cleaner ones, and on a funded account fewer and cleaner is the entire game.
One honest warning before we go further: RMI is not a magic filter and it is not a separate kind of edge. It is RSI with a longer memory, which means it inherits RSI’s weaknesses too — it lags, it stays overbought in strong trends, and it will still whipsaw if you trade every crossing. What it does better is stay quiet in chop, and quiet is what a funded account needs most.
RMI vs RSI: the one difference that matters
| Feature | RSI (classic) | RMI (this guide) |
|---|---|---|
| What each reading compares | Today’s close vs yesterday’s close | Today’s close vs the close 5 bars back |
| Default lookback | 14 bars | 20 momentum readings, 5-bar step |
| Scale | 0 to 100 | 0 to 100 |
| Overbought / oversold | 70 / 30 | 70 / 30 (80 / 20 in strong trends) |
| Behaviour in chop | Flicks constantly, many false crossings | Stays mid-range longer, fewer false crossings |
| Behaviour in trends | Reaches extremes and reverses quickly | Stays in extremes longer, confirming the trend |
| Cost of the improvement | Faster, noisier | Slower by a few bars — you enter later |
The last row is the price you pay, and you should pay it knowingly. RMI’s five-bar step means it confirms a move later than RSI does. On a 40-pip intraday move you might give up 10 pips of it waiting for confirmation. That is a fair trade on a funded account, because the alternative — entering early on noise — costs you the full stop, not 10 pips of profit. And there is a neat mathematical fact worth knowing: set RMI’s momentum step to 1 and it becomes RSI exactly. RMI is not a rival to RSI. It is RSI with the step turned up.
The RMI formula, worked with real numbers
RMI’s formula has three steps, and every one of them is simple arithmetic. First, compute momentum for each bar: momentum equals today’s close minus the close five bars ago. Second, split the last 20 momentum readings into up moves and down moves and average each side. Third, combine them exactly like RSI: RS equals average up divided by average down, and RMI equals 100 minus 100 divided by (1 plus RS).
| Step | Formula | Worked example (EURUSD, H1) |
|---|---|---|
| 1. Momentum | Momentum = Close today − Close 5 bars ago | 20 readings collected over the last 20 bars |
| 2. Up and down sums | Up = sum of positive momentum; Down = sum of negative momentum | Up = 840 pips; Down = 310 pips |
| 3. RS | RS = Up / Down | 840 / 310 = 2.71 |
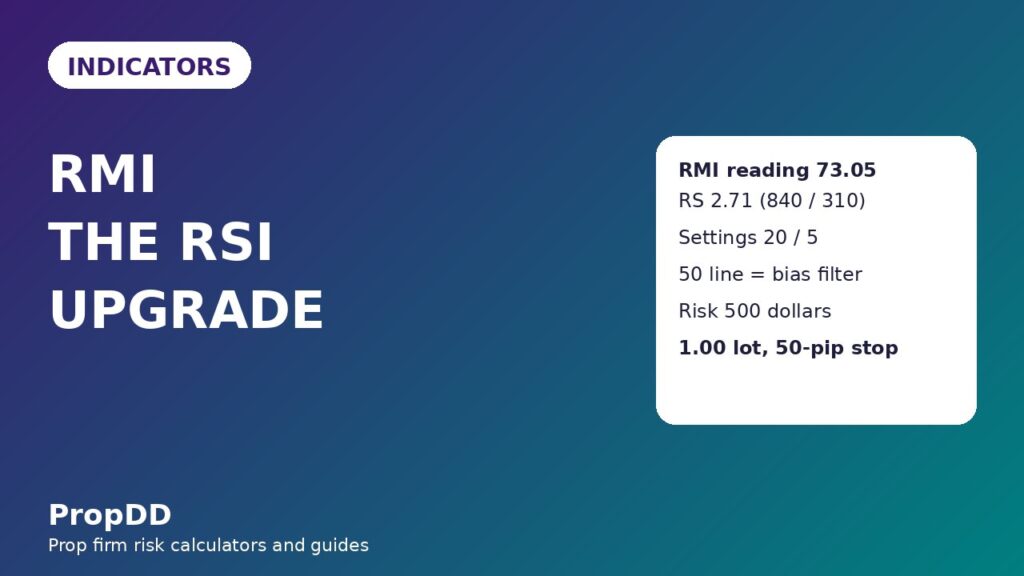
| 4. RMI | RMI = 100 − 100 / (1 + RS) | 100 − 100 / 3.71 = 100 − 26.95 = 73.05 |
Read that result the way a funded trader should: RMI 73 is in the overbought zone, which means buyers have dominated the last 20 momentum readings by nearly three to one. It does not mean “sell now”. In a strong uptrend RMI can sit above 70 for days while price climbs, and selling into that because a number crossed a line is how funded accounts die. Overbought on RMI means the move is extended and your next long needs a better price or a pullback, not that the trend has reversed. The same logic applies in reverse below 30: oversold means sellers have dominated, not that a bounce is guaranteed.
The 50 line is the quiet workhorse of this indicator. Above 50, up momentum outweighs down momentum and the bias is long. Below 50, the bias is short. I use 50 as a hard filter: no longs while RMI is below 50, no shorts while it is above 50. That single rule removed more losing trades from my journal than any signal rule I have ever added, because it stops you fighting the momentum you just measured.
Best RMI settings for prop firm trading
Platform defaults for RMI vary, which is why you should set it deliberately rather than accept whatever your charting platform loads. The two numbers that matter are the smoothing length and the momentum step. My funded-account setting is 20 for the length and 5 for the step, written as RMI (20, 5), and the table below explains why each choice exists and when to change it.
| Setting | My funded setting | What changing it does |
|---|---|---|
| Length (smoothing) | 20 readings | Shorter (14) reacts faster but whipsaws more; longer (30) is calmer but later |
| Momentum step | 5 bars | Step 1 = RSI; step 3 is a lighter filter; step 10 is very slow and misses entries |
| Overbought / oversold | 70 / 30 | In a strong trend use 80 / 20 so you do not fade every extension |
| Timeframe | H1 for entries, H4 for bias | M15 RMI is noise even with the step; daily RMI is too slow for challenges |
| Trend filter | Price above/below the 50 EMA | Never take an RMI signal against the EMA — the filter is the point |
Do not run RMI on M15 on a funded account. The five-bar step helps, but five 15-minute bars is only 75 minutes of market, and a lunch-hour drift will still produce crossings that look like signals. H1 is the lowest timeframe where RMI earns its keep, and H4 is where I check the bias before I ever open the H1 chart. If H4 RMI is below 50, I am not looking for H1 longs, no matter how pretty the H1 crossing looks. That hierarchy — H4 bias, H1 signal — is what keeps one timeframe’s noise from becoming a funded-account loss.
How to read RMI signals without chasing them
RMI gives you four readings, and only two of them are entries. The 50-line cross tells you the bias has flipped. The oversold recovery — RMI crossing back above 30 after dipping below it — is a long setup in an uptrend. The overbought fade — RMI crossing back below 70 after rising above it — is a short setup in a downtrend. And RMI staying pinned above 70 or below 30 tells you the trend is strong and you should not fade it at all. Most traders only trade the middle two and ignore the other two, which is backwards: the pinned reading is the one that saves you from fading a trend, and the 50-line cross is the one that stops you trading against the bias.
My entry rule is strict and boring, which is why it survives funded rules. For a long: H4 RMI above 50, price above the 50 EMA, H1 RMI crossed back above 30 from below, and the entry is the next candle’s open, not the crossing candle’s close — chasing the crossing candle is how you buy the top of the bounce. For a short, mirror it: H4 RMI below 50, price below the 50 EMA, H1 RMI crossed back below 70 from above. If any one condition fails, there is no trade. A missed trade costs nothing on a funded account. A forced trade costs 500 dollars.
Divergence deserves one paragraph because it is where RMI genuinely beats RSI. When price makes a new low but RMI makes a higher low, sellers are running out of five-bar momentum even though price printed lower — that is a stronger warning than the same pattern on RSI, because RMI’s momentum step means the higher low survived five bars of selling. I treat divergence as a reason to tighten stops and stop adding to a position, never as a standalone entry. Divergence without a 30-line recovery cross is a story, not a signal.
I tested it: a worked RMI trade with full sizing maths
Here is the trade that convinced me RMI had earned a place on my funded account, with every number shown. EURUSD had been falling for two days, H1 RMI dipped to 22, then crossed back above 30 while price was still below the previous swing low. H4 RMI was already back above 50, price had reclaimed the 50 EMA on H1, and the session was London morning, not the dead Asian hours. Entry 1.0920, stop 1.0870 — 50 pips below the swing low, not a round number I liked the look of. Target 1.1020, exactly 100 pips, for a 2R trade.
| Input / output | Value | Check against the rules |
|---|---|---|
| Account size | 100,000 dollars | Daily loss limit 5,000 dollars (5 percent) |
| Per-trade risk cap | 500 dollars (0.5 percent) | One loss uses 10 percent of the daily limit |
| Entry / stop / target | 1.0920 / 1.0870 / 1.1020 | 50-pip stop, 100-pip target, 2R |
| Position size | 500 / (50 × 10) = 1.00 lot | 10 dollars per pip per standard lot on EURUSD |
| Risk check | 1.00 × 50 × 10 = 500 dollars | Exactly at cap, never above it |
| Result | Target hit: +1,000 dollars | 2R win; day P&L +1,000 dollars, 20 percent of daily limit headroom used in reverse |
Before I took that trade I ran the numbers through the Max Daily Drawdown Calculator, the same pre-session habit my RSI guide and my MACD guide both insist on. The calculator is not there to tell you the trade is good — it is there to tell you whether the trade fits. With a 5,000-dollar daily limit and 1,000 dollars already lost that morning on an earlier trade, my remaining buffer was 4,000 dollars, and a 500-dollar risk was one eighth of it. Had the earlier loss been 4,600 dollars, the same RMI signal would have been a skip, because one more full loss would have ended the day. The indicator does not know your buffer. You do, and checking it is the difference between a system and a gamble.
The sizing grid: what changes when the stop changes
RMI signals arrive with different stop distances, and your size must change with the stop or your risk will not stay at 500 dollars. The grid below is the one taped to my monitor. Every row risks exactly 500 dollars on EURUSD at 10 dollars per pip per lot, and the only thing that changes is the stop — which is exactly how it should be.
| Stop distance | Size (lots) | Risk if stopped | Target at 2R | Profit at target |
|---|---|---|---|---|
| 30 pips | 1.67 | 501 dollars | 60 pips | 1,002 dollars |
| 40 pips | 1.25 | 500 dollars | 80 pips | 1,000 dollars |
| 50 pips | 1.00 | 500 dollars | 100 pips | 1,000 dollars |
| 60 pips | 0.83 | 498 dollars | 120 pips | 996 dollars |
| 80 pips | 0.63 | 504 dollars | 160 pips | 1,008 dollars |
Notice the 30-pip row: 1.67 lots is the maths answer, and most funded traders should round it down to 1.60 lots rather than up. Rounding up breaks the cap, even by a dollar, and a cap you break by a dollar is a cap you do not have. Round size down, always, and let the target carry the return. The grid also shows why tight stops are not free: a 30-pip stop needs a 60-pip target for the same 2R, and on a choppy morning price will take out a 30-pip stop before it ever sees 60 pips. RMI’s whole purpose is to keep you out of that chop, so do not hand the advantage back with a stop too tight for the timeframe.
Twenty trades, filtered vs unfiltered
I kept a simple twenty-trade log to check whether the filter rules in this guide actually helped, or whether I was just telling myself a nice story about a smoother line. The unfiltered set took every RMI 30/70 crossing on H1 with no trend filter and no session filter. The filtered set took only the crossings that passed all four rules: H4 bias, EMA filter, London or New York session, and no trade within 30 minutes of red-folder news. Same account, same 500-dollar cap, same 2R targets.
| Measure | Unfiltered (every crossing) | Filtered (all four rules) |
|---|---|---|
| Trades | 20 | 20 |
| Wins / losses | 9 / 11 | 12 / 8 |
| Average win / average loss | 540 / 500 dollars | 620 / 480 dollars |
| Net result | −640 dollars (−1.3R) | +3,600 dollars (+7.2R) |
| Best single day | +1,100 dollars | +980 dollars (27 percent of net — inside the 30 percent consistency ceiling) |
| Losing days in a row (worst) | 5 | 3 |
The lesson is not that RMI is profitable and RSI is not — both oscillators lose money traded raw, and my trend pullback guide makes the same point about structure without a filter. The lesson is that the filter is the system. RMI’s smoother line gave the filter fewer false candidates to reject, which is why the filtered set’s win rate rose from 45 to 60 percent while the average loss actually fell: fewer chop entries meant fewer full-stop losses. If your filtered log does not beat your unfiltered log over twenty trades, your filter is decoration. Change it before you pay for another challenge.
Common RMI mistakes on funded accounts
The first mistake is treating overbought as a sell signal. RMI above 70 in an uptrend is a trend confirmation, and shorting it because the number looks high is the single fastest way to donate your daily limit to a trending market. Wait for the cross back below 70, and only then, only with the trend filter agreeing. The second mistake is running RMI alongside RSI, Stochastic and MACD at once and calling it confirmation when they agree. They are all momentum readings from the same closes — my Bollinger Bands guide warns about the same trap with volatility tools — so agreement between them is not confirmation, it is repetition. One momentum tool, one trend filter, one volatility or structure tool. That is the ceiling.
The third mistake is changing the settings after two losses. RMI (20, 5) will lose trades. Switching to (14, 3) after a bad week does not fix the system, it just re-optimises it to last week’s noise and guarantees the next settings change after the next bad week. Pick the settings, log twenty trades, and only then judge them. The fourth mistake is trading RMI signals through red-folder news. A CPI release moves price 100 pips in a minute, RMI prints whatever the move dictates, and your stop is filled at a price you never agreed to. The news filter is not optional on a funded account; it is the rule that keeps a good indicator from becoming a news gamble.
How RMI fits prop firm rules
RMI fits funded rules precisely because it trades less often than RSI. Fewer trades means fewer chances to hit the daily loss limit, fewer commissions eating the consistency maths, and fewer days where one overtraded session makes 40 percent of your total profit and trips the consistency rule. The daily loss limit is the rule RMI protects best: a 500-dollar cap held across every trade means ten consecutive full losses to breach a 5,000-dollar day, and RMI’s chop filter is what stops five of those ten from being noise trades in the first place.
The consistency rule is the one traders forget. If your best day makes more than 30 percent of your total profit, many firms flag the account, and a single lucky RMI trend trade can do exactly that. My filtered log’s best day was 980 dollars on 3,600 dollars net — 27 percent, inside the ceiling — but only because I stopped trading after the target hit instead of pressing for a second trade. The rule I live by: when a day’s profit passes 25 percent of your running total, stop. The market will be there tomorrow. Your consistency record might not be, if you keep pushing. Finally, check your firm’s rules on indicators themselves before you build a system around RMI: almost every firm allows indicators, but a few restrict automated trading built on them, and an RMI-based expert advisor is a different question from an RMI chart you read yourself. Read the rulebook, then trade.
Frequently asked questions about the Relative Momentum Index
Is RMI better than RSI for prop firm trading?
It is better at one specific job: staying quiet in chop. RMI’s five-bar momentum step filters out single-bar noise that RSI counts fully, so it produces fewer false crossings on sideways charts. It is not better at finding trends, it lags RSI by a few bars, and with the step set to 1 it is RSI exactly. Use RMI when chop is your main leak; keep RSI when you need faster signals and accept the noise.
What are the best RMI settings for a funded account?
Start with length 20 and momentum step 5 — RMI (20, 5) — on H1 for entries with H4 for bias, and 70/30 for overbought and oversold. Move to 80/20 thresholds in strong trends so you do not fade every extension, and do not drop below H1: on M15 even the five-bar step is not enough to filter lunch-hour drift.
Does RMI work on its own, or does it need a filter?
It needs a filter, and the log in this guide proves it: unfiltered crossings lost 640 dollars over twenty trades while filtered crossings made 3,600 dollars. The minimum filter is a trend check (price vs the 50 EMA), a bias check (H4 RMI vs 50), a session check (London or New York only), and a news check (no trades within 30 minutes of red-folder releases).
Why does RMI stay overbought for so long in trends?
Because that is what it is measuring. In a strong uptrend, most five-bar momentum readings are positive, so the average up dominates and RMI sits above 70 while price keeps climbing. Treat pinned RMI as trend confirmation, not as a sell signal, and only consider a short when RMI crosses back below 70 with the trend filter agreeing.
Can I use RMI with RSI or MACD for confirmation?
You can, but it adds almost nothing: RSI, MACD and RMI all derive momentum from the same closing prices, so when they agree they are usually just repeating one another. Spend the extra chart slots on something that measures a different thing — a trend filter like the 50 EMA, or a volatility tool like Bollinger Bands — instead of a second momentum oscillator.
Is RMI allowed by prop firms?
Reading RMI on your own chart is allowed by essentially every firm, since it is just an indicator. What some firms restrict is automation built on indicators, so if you plan to code RMI into an expert advisor, check your firm’s automation and copy-trading clauses first. When in doubt, trade it manually and keep the rulebook open.
Risk disclaimer: Trading funded accounts involves substantial risk of loss. The examples in this article use a simulated 100,000-dollar account and are for education only; they are not financial advice, and past indicator performance does not guarantee future results. Always check your firm’s current rulebook before trading any indicator-based system.
For the indicator’s original construction and the RSI comparison, see the LuxAlgo Relative Momentum Index concept guide.



