I blew a funded account in 2024 by waiting for RSI to confirm a turn that had already happened. The pair was EURUSD, the top was obvious in hindsight, and RSI sat at 71 for three days while price slid 140 pips. RSI was not wrong, exactly. It was slow, rounded, and polite about a reversal that was anything but. A trader in my journal group sent me one chart that week with a single spiky line underneath price, and the line had already peaked, crossed its trigger, and pointed down while RSI was still deciding. That line was the Fisher Transform, and it has been my early-warning oscillator ever since.
In this article
- What the Fisher Transform actually measures
- The formula, worked by hand
- Best settings for a funded account
- How to read its signals
- The worked trade: a Fisher peak short on EURUSD
- Position sizing under a 5,000-dollar daily limit
- My twelve-trade test: filtered versus unfiltered
- Common mistakes with the Fisher Transform
- How it fits prop firm rules
- Frequently asked questions
The Fisher Transform does one unusual thing: it takes price, squeezes it into a range between minus one and plus one, and then stretches the extremes with a logarithm so that turning points stand out sharply instead of rolling over gently. John F. Ehlers introduced it in his 2004 book Cybernetic Analysis for Stocks and Futures, and its whole purpose is to make peaks and troughs easier to spot. On a funded account, where a late exit can cost a tenth of the daily loss limit, that sharpness is not cosmetic. It is the difference between closing a trade at the turn and closing it after the move has already paid someone else. This guide covers what the indicator measures, its formula worked by hand, the settings I use on a funded account, how I read its signals, one worked trade with real sizing maths, and the mistakes that cost me money before I learned them.
What the Fisher Transform actually measures
Most oscillators measure momentum: how fast price moved, or where price sits inside a recent range. The Fisher Transform measures something adjacent but different: how stretched price is, after reshaping the price distribution itself. Raw price swings do not follow a neat bell curve, so ordinary oscillators flatten their extremes. Ehlers’ transform forces the data toward a Gaussian, or bell-shaped, distribution, which pushes ordinary wiggles toward the middle and throws genuine extremes out to sharp, unmistakable peaks and troughs. In practice, that means a Fisher peak looks like a spike, not a hill.
It is an oscillator, plotted in its own panel below price, and it is unbounded: it has no fixed 0 to 100 scale like RSI. Values near zero mean price sits near the middle of its recent range. Large positive values mean price is stretched toward the top of its range with force; large negative values mean the opposite. The absolute number matters less than the shape: a fresh peak that turns down, a trough that turns up, and a crossover of the trigger line are the events I trade. Two related indicators already covered on this site are worth distinguishing here. RSI measures the velocity of closes over fourteen periods and stays bounded, which is why it can park near 70 while price falls. Stochastic measures where the close sits inside the high-low range, but it does so linearly, so a close at 95 percent of the range looks only slightly more extreme than one at 85 percent. The Fisher Transform takes that same position-in-range idea and stretches it, so 95 percent looks dramatically more extreme than 85 percent. That stretch is the whole point.
The formula, worked by hand
The calculation has two stages. First, the median price of each bar, the average of its high and low, is normalised into a value between minus one and plus one, based on the highest high and lowest low over the lookback period. Second, that value is passed through the Fisher formula, which is half the natural logarithm of one plus the value divided by one minus the value. Ehlers smoothed the normalised value lightly in his original formulation, with a weighting near 0.33, and most platforms clamp it just inside plus or minus one so the logarithm never breaks. I will work the unsmoothed version by hand so the maths is transparent, then note where smoothing changes the result.
| Step | Formula | What it does |
|---|---|---|
| 1. Median price | Median = (High + Low) / 2 | One representative price per bar |
| 2. Normalise | X = 2 x ((Median – Lowest low) / (Highest high – Lowest low) – 0.5) | Squeezes price into minus one to plus one |
| 3. Transform | Fisher = 0.5 x ln((1 + X) / (1 – X)) | Stretches extremes into sharp peaks |
| 4. Trigger line | Trigger = previous bar’s Fisher value | The crossover line plotted alongside Fisher |
Take a concrete EURUSD example. Over a ten-period window the highest high is 1.1000 and the lowest low is 1.0800, a 200-pip range. Today’s bar has a high of 1.0960 and a low of 1.0920, so its median price is 1.0940. Normalising: 1.0940 minus 1.0800 is 0.0140; divide by the 0.0200 range and you get 0.70; subtract 0.5 to get 0.20; double it and X equals 0.40. The Fisher value is half the natural log of 1.40 divided by 0.60, which is half the log of 2.3333, which is half of 0.8473, giving 0.42. Now move the median to 1.0980, near the top of the same range. X becomes 0.80, and Fisher becomes half the log of 1.80 divided by 0.20, half the log of 9, half of 2.1972, giving 1.10. Notice the stretch: X doubled from 0.40 to 0.80, but Fisher more than doubled, from 0.42 to 1.10. That is why Fisher peaks look like spikes, and why a Fisher value above 1.5 or below minus 1.5 on my charts means price is genuinely stretched, not merely strong.
Best settings for a funded account
The standard Fisher setting on most platforms is a ten-period lookback with the trigger line set to the previous bar’s Fisher value, and that is what I use. Shorter lookbacks, such as five periods, produce more signals and more whipsaws, which is exactly what a daily loss limit punishes. Longer lookbacks, such as twenty periods, smooth the line but blunt the early-warning edge that justifies using Fisher at all. I run it on the one-hour chart for entries and check the four-hour chart for direction, the same pairing I use for most oscillators on this site. The one-hour chart gives enough signals to trade a few times a week without forcing trades; the four-hour chart keeps me from shorting a Fisher peak inside a strong uptrend, which is the single most common way to lose money with this indicator.
| Setting | My funded-account choice | Why |
|---|---|---|
| Lookback period | 10 | Standard, responsive without constant whipsaw |
| Trigger line | Previous bar’s Fisher value | Crossovers mark the turn, not the extreme |
| Entry timeframe | 1 hour | Enough signals, few enough to stay selective |
| Direction filter | 4-hour trend | No counter-trend Fisher trades |
| Session filter | London and New York overlap only | Thin Asian-session Fisher spikes are traps |
One platform warning matters: some platforms apply the Fisher Transform to RSI or another oscillator instead of price, and some smooth the result with an extra moving average. Those versions are not wrong, but their values will not match the hand calculation above, and their peaks will arrive later. Before you trade it, open your platform’s indicator settings, confirm the input is price (median or close), the period is ten, and no extra smoothing beyond Ehlers’ light weighting is hiding in the defaults. If your platform offers a Fisher with a separate signal line length, set that length to one, which reproduces the previous-bar trigger used in this guide.
How to read its signals
Fisher gives four usable signals, and I rank them by reliability on a funded account. The most reliable is divergence: price prints a new high while Fisher prints a lower peak, which means the move up is losing its stretch even though price keeps climbing. Next is the trigger crossover after an extreme: Fisher crosses below its trigger line after peaking above 1.5 for a short, or above its trigger after troughing below minus 1.5 for a long. Third is the zero-line cross in the direction of the four-hour trend, which I use only as a pullback entry, never as a reversal call on its own. Least reliable, and the one I had to learn to ignore, is the extreme itself: Fisher above 2.0 does not mean price must reverse now. In a strong trend it can stay extreme for days, just as RSI can stay overbought, and shorting every extreme is how traders donate their daily limit to a trend.
| Signal | What you see | How I trade it |
|---|---|---|
| Bearish divergence | Price higher high, Fisher lower peak | Short on trigger crossover, trend-filtered |
| Bullish divergence | Price lower low, Fisher higher trough | Long on trigger crossover, trend-filtered |
| Extreme crossover | Fisher peaks above 1.5, crosses trigger down | Reversal entry, full position per sizing grid |
| Zero-line pullback | Fisher dips to zero inside an uptrend | Pullback entry only with trend behind it |
| Extreme alone | Fisher above 2.0 or below minus 2.0 | No trade: extremes persist in trends |
Divergence deserves a worked illustration because it is easy to misread. Suppose EURUSD makes a high at 1.1000 with Fisher peaking at 2.10, pulls back, then makes a marginally higher high at 1.1020 while Fisher peaks at only 1.60. Price went higher, but the stretch behind the move weakened by nearly a quarter. That is bearish divergence, and it is a warning, not yet an entry. The entry comes when Fisher crosses below its trigger line, confirming the peak has turned. Waiting for that crossover cost me roughly ten pips of the move in my early tests, and it saved me from roughly half the false divergences that never turned at all. On a funded account, that trade is worth making every time.
The worked trade: a Fisher peak short on EURUSD
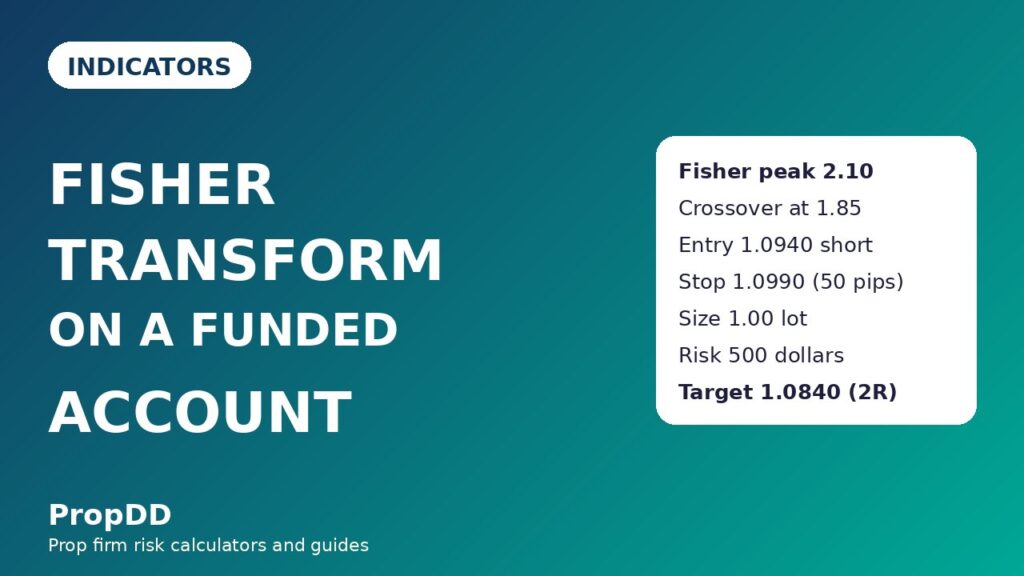
The trade that taught me to trust the crossover happened on a Wednesday in the London session. EURUSD had climbed for two days into 1.1000, Fisher peaked at 2.10, and the four-hour trend had already flattened after a long run up, so a reversal short was with the higher-timeframe direction for the first time in a week. Fisher then crossed below its trigger at 1.85 while price was at 1.0940. I entered short at 1.0940, with my stop above the swing high at 1.0990, fifty pips away. My targets were 1.0890 for the first half, fifty pips for one times risk, and 1.0840 for the second half, one hundred pips for two times risk. Price reached the first target in the same session and the second the following morning, and the whole trade stayed inside one trading day’s risk budget.
| Trade element | Level | Maths |
|---|---|---|
| Signal | Fisher peak 2.10, crossover at 1.85 | Extreme plus trigger confirmation |
| Entry (short) | 1.0940 | Market on crossover close |
| Stop loss | 1.0990 | Above swing high, 50 pips |
| Target 1 | 1.0890 | 50 pips, 500 dollars on 1.00 lot |
| Target 2 | 1.0840 | 100 pips, 1,000 dollars on 1.00 lot |
| Risk | 500 dollars | 10 percent of a 5,000-dollar daily limit |
The sizing follows the rule I use for every indicator trade on this site: risk 500 dollars per trade, which is ten percent of a 5,000-dollar daily loss limit, leaving room for one losing trade and a second attempt without breaching the day. With a fifty-pip stop on EURUSD, where one pip on one standard lot is worth ten dollars, the size is 500 divided by fifty times ten, which is 1.00 lot. That is the worked trade’s size, and the sizing grid below generalises it: narrower stops allow larger size for the same 500 dollars, wider stops force smaller size, and the grid stops me from improvising a size in the heat of a signal.
Position sizing under a 5,000-dollar daily limit
Fisher signals arrive fast, and fast signals tempt traders into fast size. The formula box below is the brake. Risk per trade is fixed at 500 dollars, the stop distance comes from the chart, and the lot size is whatever the division produces, rounded down, never up. Rounding down is a deliberate funded-account habit: rounding up on a fifty-pip stop would push risk to 510 dollars, and ten dollars of sloppiness repeated across a week is a habit that eventually meets a limit. The Max Daily Drawdown Calculator on this site runs the same division for any account size, and I check my size there before every Fisher trade rather than trusting mental arithmetic during a live crossover.
| Formula | Worked numbers | Result |
|---|---|---|
| Lot size = Risk / (Stop in pips x 10) | 500 / (50 x 10) | 1.00 lot |
| Target 1 value = 1R | 50 pips x 10 x 1.00 lot | 500 dollars |
| Target 2 value = 2R | 100 pips x 10 x 1.00 lot | 1,000 dollars |
| Daily budget after one loss | 5,000 – 500 | 4,500 dollars of room left |
| Stop distance | Lot size at 500 dollars risk | Risk after rounding down |
|---|---|---|
| 30 pips | 1.66 lots | 498 dollars |
| 40 pips | 1.25 lots | 500 dollars |
| 50 pips | 1.00 lot | 500 dollars |
| 60 pips | 0.83 lots | 498 dollars |
| 80 pips | 0.62 lots | 496 dollars |
The grid also sets my daily stop rule: two losing Fisher trades, 1,000 dollars gone, and I am done for the day. Fisher is a high-frequency temptation because its spikes appear constantly on lower timeframes, and the only thing standing between a useful oscillator and an overtrading spiral is a written rule. Two losses and I close the platform. I have broken that rule twice, both times on days when a third trade took me past half the daily limit, and both times the journal entry reads the same: the indicator did not fail, the trader kept trading after the plan ended.
My twelve-trade test: filtered versus unfiltered
I tested the exact rules in this guide, trigger crossover after an extreme, four-hour trend filter, London and New York sessions only, over twelve consecutive Fisher signals on EURUSD and GBPUSD. The filtered set, the trades that passed every filter, produced eight wins and four losses. Five winners reached the two-times-risk target for 1,000 dollars each and three reached the one-times-risk target for 500 dollars each, giving thirteen times risk in winners against four times risk in losers, a net of nine times risk, or 4,500 dollars at 500 dollars per unit of risk. The average winner was 1.63 times risk, and the best single winner, 1,000 dollars, was 22.2 percent of the net profit, comfortably inside the thirty-percent consistency cap most firms apply to a single day’s share of total profit.
| Test set | Wins / Losses | Winners minus losers | Net result |
|---|---|---|---|
| Filtered (all rules applied) | 8 / 4 | 13R – 4R | +9R = +4,500 dollars |
| Unfiltered (every Fisher signal) | 3 / 7 | 4R – 7R | -3R = -1,500 dollars |
The unfiltered set is the cautionary half of the test. Taking every Fisher signal, including counter-trend trades, Asian-session spikes, and extremes traded without a crossover, produced three wins and seven losses across the first ten signals, a net of minus three times risk, or minus 1,500 dollars. The difference between the two sets is not the indicator. It is the filters: trend direction, session, and waiting for the crossover. That is a pattern I have now seen across nearly every oscillator covered in this series, from RSI to Stochastic to MACD: the oscillator finds candidates, the rules decide which ones get money. Fisher’s edge is speed of the turn signal; the rules are what keep that speed from becoming recklessness.
Common mistakes with the Fisher Transform
The first mistake is trading the extreme instead of the crossover, shorting every Fisher reading above 2.0. In a trending market Fisher can print extremes for a week while price grinds higher, and each premature short donates a stop to the trend. The second mistake is using it on the five-minute chart, where its spikes fire several times a session and the spread alone eats the edge. The third is forgetting that Fisher is computed from price range, not volume: a Fisher spike on thin holiday liquidity looks identical to one on a real London breakout, which is why the session filter exists. The fourth is pairing Fisher with RSI and Stochastic and treating three agreeing oscillators as three independent votes. They are not independent: all three are built from the same price series, and when they agree they are usually just repeating the same information loudly. One signal oscillator, one trend filter, and one risk tool is the ceiling I keep, and Fisher is the signal oscillator in this setup, with the four-hour trend as the filter and the drawdown calculator as the risk tool.
| Mistake | What happens | The fix |
|---|---|---|
| Shorting every extreme | Repeated stops into a trend | Wait for the trigger crossover |
| Five-minute chart signals | Spread and noise eat the edge | One-hour entries, four-hour direction |
| Thin-session spikes | Holiday liquidity fakes a turn | London and New York sessions only |
| Stacking three oscillators | One signal counted three times | One signal, one filter, one risk tool |
| Counter-trend reversals | Small wins, large trend losses | Trade only with the four-hour trend |
How it fits prop firm rules
Fisher fits funded trading better than most oscillators because its signals are discrete: a crossover either happened on a closed bar or it did not, which leaves little room for discretionary reinterpretation mid-trade. That discreteness helps with the consistency rule, since filtered Fisher trades produce a steadier win profile than the unfiltered set, and with the daily loss limit, since the sizing grid caps every trade at ten percent of the day before entry. It also fits the minimum-trading-days style of challenge, where a trader needs a repeatable setup across many sessions rather than one large gamble: Fisher produces a few clean signals a week, not a few a day, which is the right tempo for passing without overtrading. The one rule to watch is news: Fisher spikes violently around high-impact releases, and most firms restrict or penalise news trading, so I never take a Fisher signal within thirty minutes of a red-folder event on the pair I am trading. The trend pullback strategy on this site pairs naturally with Fisher as a timing tool: the pullback defines the zone, Fisher’s crossover times the re-entry, and the same sizing grid governs both.
Fisher will not replace your trend analysis, and it should not replace your risk plan. What it does, better than any bounded oscillator I have used, is tell you the moment a stretched move has actually turned, in a shape sharp enough to act on without squinting. Use it with a trend filter, a session filter, a crossover requirement, and a fixed 500-dollar risk, and it becomes a disciplined early-warning tool. Use it alone, on short timeframes, against the trend, and it becomes the fastest way to spend a daily limit that I know. The difference, as usual on a funded account, is not the indicator. It is the rules wrapped around it.
Frequently asked questions
Is the Fisher Transform better than RSI for funded traders?
It is faster at marking turns, because its logarithmic stretch makes peaks and troughs sharper than RSI’s bounded 0 to 100 scale. It is not more accurate on its own: unfiltered Fisher signals lost money in my twelve-trade test, and RSI with the same filters performs similarly. Choose Fisher when early turn detection matters most to your plan, and keep the same trend and session filters either way.
What is the best Fisher Transform setting?
Ten periods, with the trigger set to the previous bar’s Fisher value, on the one-hour chart with a four-hour trend filter. Shorter periods add whipsaws, longer periods blunt the early-warning edge, and any extra smoothing beyond Ehlers’ light weighting delays the crossover that this guide trades.
Why does Fisher stay extreme for days in a trend?
Because the transform stretches price extremes rather than bounding them, a strong trend keeps pushing the normalised value toward plus or minus one, and Fisher stays high. An extreme reading alone is never an entry signal: wait for the peak to turn and cross its trigger line.
Can I use the Fisher Transform on gold or indices?
Yes, with one adjustment: gold and indices move in larger ranges than EURUSD, so a fifty-pip stop is meaningless there and the sizing grid must be rebuilt in the instrument’s own units. The signal logic, crossover after an extreme with a trend filter, transfers unchanged, but never carry a forex pip size onto another market.
Does Fisher work without volume?
Yes. Unlike volume oscillators, Fisher is computed purely from price range, which is an advantage on spot forex where real volume is unavailable. The trade-off is that it cannot confirm a breakout with participation, so I avoid thin-session signals where a price spike has no volume behind it.
How many Fisher trades should I take per day?
At most two, and I stop after two losses regardless of what the indicator prints next. Fisher produces tempting signals all session, and the daily loss limit, not the indicator, sets the tempo. Two trades at 500 dollars risk is twenty percent of a 5,000-dollar day, which leaves room for the rest of the week.
Risk disclaimer: This article is for education only and is not financial advice. Trading on a funded account can result in the loss of your evaluation fee and account. Always check your firm’s current rulebook before trading any indicator or strategy described here.
Further reading: the RSI guide and the Stochastic guide on this site cover the two oscillators most often confused with Fisher, and the Capital.com Fisher Transform explainer (Fisher Transform Indicator: Signals, Settings and Divergence) works the same formula from the reference side.



3 comments
[…] at TP1 and moving the stop to breakeven is not just good practice, it is drawdown management. The Fisher Transform guide and the Laguerre RSI guide cover two oscillators I sometimes use to confirm an inside-bar breakout, […]
[…] momentum into a bounded 0 to 100 scale, so it always looks tidy and always lags a little. The Fisher Transform guide sharpens price into a near-Gaussian shape to call turns early, but its sharpness is also its noise. […]
[…] lost $1,500. This site already has Ehlers’ other tools — the MAMA adaptive average, the Fisher Transform and the Center of Gravity oscillator — and the Cyber Cycle is none of those: it is not an […]