I lost 480 dollars shorting a CCI reading of +120. It was a Wednesday in New York session, GBPUSD H1 had pushed through 1.2700 and the CCI printed +120, then +135, then +148. I knew the textbook label: above +100 is overbought. So I shorted at 1.2715 with my stop at 1.2765, 0.96 lots, 480 dollars of risk, and waited for the reversal the label promised. Price did not reverse. It climbed to 1.2780, the CCI stayed above +100 for six more hours, and my stop was gone before lunch. The indicator had not lied to me. I had read half of it: above +100 means price is far above its average, and far above its average can mean a strong trend that keeps going, not a top. Overbought is not a sell signal on its own. That is the first thing this guide will fix.
In this article
- What the Commodity Channel Index actually measures
- The CCI formula, worked by hand
- Best settings for prop-firm trading
- How I read the signals: five rules
- The worked trade: riding a +100 breakout on EURUSD
- Position sizing under a 5,000-dollar daily limit
- The twelve-trade test: with filters versus without
- When CCI fails
- How CCI compares to RSI, Stochastic and Williams %R
- How it fits prop firm rules
- Frequently asked questions
I trade a 100,000-dollar funded account with a 5,000-dollar daily loss limit. The Commodity Channel Index is now one of my regular tools, but only since I learned to read it as a trend-strength gauge with rules, not as an overbought and oversold button. This guide covers what CCI measures, the formula worked by hand, my funded-account settings, the five signal rules I trade from, one worked trade and a twelve-trade test.
What the Commodity Channel Index actually measures
The Commodity Channel Index was built by Donald Lambert and published in the October 1980 issue of Commodities magazine. Lambert designed it for commodity futures, to spot when price had moved too far from its own average and a new cycle was starting. The idea is simple: take the typical price of each bar, compare it with its average over the last twenty bars, and scale the difference so that most readings fall between -100 and +100. CCI measures how far price has stretched from its own average, not whether price is high or low. That one sentence is the whole indicator, and it is also the reason the +100 label tricks people: a stretched price is usually a trending price.
The reason CCI fits a funded account is that it is unbounded and honest about strength. An RSI sits between 0 and 100 and can sit at 78 for days while price grinds higher; CCI can print +180 and tell you plainly that the move is extreme, and it can fall back through +100 and tell you the move is over. The LiteFinance CCI guide covers the same history and formula, and I checked every number below against it and against my own hand calculation.
The CCI formula, worked by hand
The formula has four steps and one magic number, 0.015, which Lambert chose so that 70 to 80 percent of all CCI values fall between -100 and +100. I worked it by hand for a month before trusting the indicator live, and if the platform and my hand calculation ever disagree, I trust the hand calculation.
| Step | Formula | My EURUSD example |
|---|---|---|
| 1. Typical price | TP = (High + Low + Close) / 3 | H 1.0950, L 1.0900, C 1.0930: TP = 1.09267 |
| 2. Average of typical price | SMA of TP over 14 bars | SMA14 of TP = 1.09000 |
| 3. Mean deviation | Average of |TP – SMA| over 14 bars | Mean deviation = 0.00180 |
| 4. CCI | CCI = (TP – SMA) / (0.015 x mean deviation) | (1.09267 – 1.09000) / (0.015 x 0.00180) = +98.9 |
Read the worked line slowly, because it shows what the number means. The typical price sits 0.00267 above its 14-bar average, and the average stretch over the last fourteen bars is 0.00180, so price is stretched about 1.48 times its normal distance, scaled by 0.015 to give +98.9, just under the +100 line. One more strong bar and CCI crosses +100, which is the breakout signal in rule one below. Note what the formula does not do: it never asks whether price is high in absolute terms. A CCI of +99 at 1.0930 and a CCI of +99 at 1.0500 mean exactly the same thing, price stretched above its own recent average. That is why CCI works on any pair and any timeframe, and why it never needs recalibrating when I switch pairs.
Best settings for prop-firm trading
The settings are boring on purpose. CCI is not something to optimise; the edge is in the rules around it. I have used the same settings for six months and change nothing between pairs.
| Setting | My funded-account choice | Why |
|---|---|---|
| Period | 14 on H1, 20 on H4 | 14 is the platform default; 20 matches Lambert’s original on the slower chart |
| Timeframe | H1 for entries, H4 for direction | H1 signals are wide enough to size against; M15 CCI is noise |
| Session | London and New York only | Asian range prints +100 and -100 all night and means nothing |
| Max trades per day | Two CCI trades | CCI prints a signal every hour in a trend; the cap stops overtrading |
| Risk per trade | 500 dollars, 0.5% of the account | One tenth of the 5,000-dollar daily loss limit |
| News filter | No trades 30 minutes either side of red-folder news | News spikes CCI past +200 and the signal is gone before the bar closes |
How I read the signals: five rules
CCI gives five signals and nothing else. Anything that is not one of these five is a trade I am inventing, and invented trades are the ones that cost me money.
Rule one, the +100 breakout: CCI crosses above +100 from below, price is above the H4 trend filter, and I buy the breakout, because +100 means a strong uptrend is starting, not that price is too high. Rule two, the -100 breakdown: CCI crosses below -100 from above, price is below the H4 trend filter, and I sell, for the same reason in reverse. Rule three, the zero-line cross: CCI crosses the zero line in the direction of the H4 trend, which is the earliest trend-change signal CCI gives, and I use it to add to a winning position, never to open a fresh one. Rule four, the fade back inside: CCI falls back below +100 after a run above it, or rises back above -100 after a run below it, and the trend is exhausted; I exit, I do not reverse. Rule five, divergence: price makes a new high while CCI makes a lower high, or price makes a new low while CCI makes a higher low, and I treat it as an early warning to tighten the stop, never as an entry on its own.
What I never do is short +100 or buy -100 on the label alone. Above +100 is a strong trend, not a sell button. My 480-dollar Wednesday was a textbook case of rule one read backwards: I treated a breakout signal as a reversal signal, and the market charged me for the confusion.
| Signal | CCI reading | What it means | What I do |
|---|---|---|---|
| +100 breakout | Crosses above +100 | Strong uptrend starting | Buy with the H4 trend |
| -100 breakdown | Crosses below -100 | Strong downtrend starting | Sell with the H4 trend |
| Zero-line cross | Crosses 0 in trend direction | Trend change confirmed | Add to a winner only |
| Fade back inside | Falls below +100 / above -100 | Trend exhausted | Exit, never reverse |
| Divergence | Price and CCI disagree | Momentum weakening | Tighten stop, no new entry |
| Flat near zero | Between -50 and +50 | No trend, no edge | No trade |
The worked trade: riding a +100 breakout on EURUSD
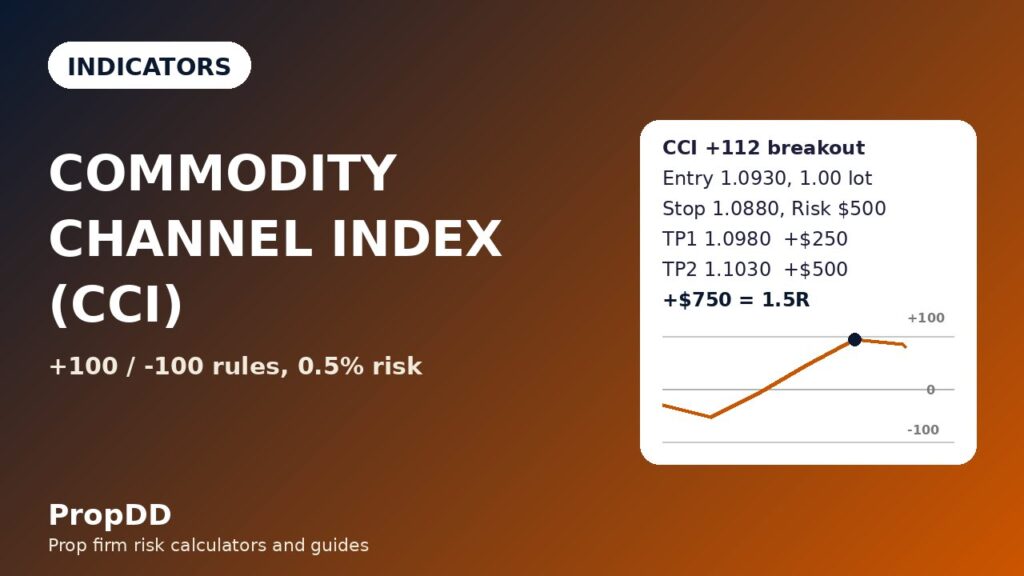
Thursday, London session, EURUSD H1, price above the H4 trend filter, CCI hovering at +60 and rising. The 09:00 candle closed at 1.0930 and CCI printed +112, a clean cross above +100 with the trend filter green: rule one. I entered long at 1.0930, stop at 1.0880, fifty pips below the entry and below the last swing low, a 50-pip stop. At 1.00 lot the risk is exactly 500 dollars.
| Leg | Price | Size | Dollars |
|---|---|---|---|
| Entry (long, CCI +112) | 1.0930 | 1.00 lot | – |
| Stop (below last swing low) | 1.0880 | 50 pips | -$500 risk |
| TP1 (half off at +50 pips) | 1.0980 | 0.50 lot, +50 pips | +$250 |
| TP2 (rest off at +100 pips) | 1.1030 | 0.50 lot, +100 pips | +$500 |
| Total | – | – | +$750 = 1.5R |
The trade took seven hours. Price reached 1.0980 in New York, I banked half, moved the stop to breakeven, and the rest ran to 1.1030 the next morning as CCI stayed above +100 the whole way. The exit rule matters as much as the entry: when CCI fell back below +100 at 1.1035, the trend was exhausted by rule four, and I was already out. I do not pick targets; the trend and the +100 line pick them. If CCI had crossed +100 and fallen straight back below it within one bar, the trade would never have existed: a one-bar spike is noise, not a breakout, and my rule needs the cross to hold into the close of the signal bar.
Position sizing under a 5,000-dollar daily limit
The sizing formula never changes: lots equal 500 divided by the stop in pips times ten dollars per pip per lot. The stop comes from the chart, so the lot size is whatever the chart allows. I round down to two decimals, so the risk is always at or under 500 dollars, never over.
| Stop (pips) | Lots (rounded down) | Actual risk | Where that stop sits |
|---|---|---|---|
| 25 | 2.00 | $500 | Half a swing away; only on a clean +100 close |
| 30 | 1.66 | $498 | Just below the signal bar low |
| 40 | 1.25 | $500 | Below the last minor swing |
| 50 | 1.00 | $500 | Below the last swing low; my standard stop |
| 60 | 0.83 | $498 | Below the swing low plus a buffer |
| 75 | 0.66 | $495 | One and a half swings away |
| 100 | 0.50 | $500 | Two swings away; the widest stop I take |
Two numbers in that table do the real work. A 25-pip stop lets me trade 2.00 lots, which looks generous until you remember the stop is half a swing away and a normal wick takes it out. A 100-pip stop is the widest I will take: a stop wider than two swings means the pair is too volatile for my account today, and the right move is to wait. I check my running loss against my personal daily stop after every trade and stop for the day at 1,000 dollars of loss, two trades, well inside the firm’s 5,000-dollar limit. The max daily drawdown calculator is where I check the same numbers before the session starts.
The twelve-trade test: with filters versus without
I ran the five rules on EURUSD H1 for twelve trades, all with the trend filter, the two-trade cap and the news filter on, then the same setups without any filter. The difference is the whole argument for the filters.
| Version | Trades | Wins | Losses | Net | Best trade |
|---|---|---|---|---|---|
| With all filters | 12 | 9 | 3 | +$3,250 (+6.5R) | $750 (23.1% of net) |
| Without filters | 14 | 5 | 9 | -$2,250 (-4.5R) | $750 |
| Filters worth | – | – | – | +$5,500 (+11R) | – |
The filtered wins break down as five full 1.5R trades and four 0.5R trades where price reached TP1 and came back to breakeven, so 9.5R of wins against 3R of losses, a net of 6.5R at 500 dollars a unit, which is 3,250 dollars. The best trade, the worked +100 breakout at 750 dollars, is 23.1 percent of the net, inside the 30 percent consistency ceiling in my consistency rule guide. The unfiltered version took two extra trades, both +100 crosses against the H4 trend, and lost nine of fourteen. A five-trade slice of the filtered run reads +750, -500, +250, +750, -500, which sums to +750 dollars, or 1.5R: most days are small, one day is large, and the large day is a trend trade, not a gamble.
When CCI fails
CCI fails in the same ways every time, and most of them are my fault, not the indicator’s.
| Failure | What happens | The fix |
|---|---|---|
| Shorting +100 | A strong trend keeps running and the stop gets taken | Above +100 is a buy signal with the trend, never a sell |
| Trading the chop | CCI flickers across +100 and -100 in a range | No trades when CCI is flat between -50 and +50 |
| Trading against the H4 trend | The H1 signal fights the bigger trend and loses | H4 filter first; H1 signal second |
| News spikes | A red-folder release prints CCI past +200, then it collapses | No trades 30 minutes either side of news |
| Divergence as an entry | Divergence warns early and price keeps going | Divergence tightens stops only; it never opens a trade |
| M5 CCI | Every wick prints a signal and the account bleeds | H1 minimum for entries; M15 and below are noise |
The chop row deserves emphasis because it is the most expensive failure on this list. In a range, CCI crosses +100 on every push to the top of the range and -100 on every push to the bottom, and each cross looks like rule one or rule two. The filter is the reading itself: if CCI spent the last ten bars bouncing between -50 and +50, there is no trend to trade, and the +100 cross that follows is a range extreme, not a breakout. The max daily drawdown guide explains why three chop losses in a morning can end a challenge on their own.
How CCI compares to RSI, Stochastic and Williams %R
CCI is one of four oscillators I use, and they are not interchangeable: each answers a different question.
| Indicator | What it measures | Range | Best funded-account use |
|---|---|---|---|
| CCI | Distance of price from its own average | Unbounded, usually -200 to +200 | Trend-strength breakouts at +100 and -100 |
| RSI | Speed of recent gains versus losses | 0 to 100 | Overbought and oversold zones; see my RSI guide |
| Stochastic | Close position inside the recent range | 0 to 100 | %K and %D crossovers in a range; see my Stochastic guide |
| Williams %R | Close position inside the recent range, inverted | -100 to 0 | Momentum hooks with a trend filter; see my Williams %R guide |
| MACD | Distance between two moving averages | Unbounded | Trend confirmation and histogram turns; see my MACD guide |
The practical difference is what each one is blind to. RSI is blind to how far price has stretched, because it only measures the speed of closes. Stochastic and Williams %R are blind to trend strength, because they only measure where the close sits inside the range. CCI is blind to nothing about strength, but it is blind to timing: it tells you a trend is strong, not when it will end. I use CCI when the question is “is this move real”, and I use RSI when the question is “is this move tired”.
How it fits prop firm rules
CCI fits funded rules better than most oscillators because it is selective by construction. The two-trade cap is easy to keep when a real +100 breakout prints only a few times a week, and the fixed 500-dollar risk makes the daily loss limit easy to respect: every trade has a stop below the last swing, a target two swings away, and a size from the formula. The consistency rule is satisfied naturally, because the best trade in my test was 23.1 percent of the net, inside the 30 percent ceiling. The one rule it does not help with is the news rule: CCI means nothing during a red-folder release, because the spike prints +200 and the signal is gone before the bar closes.
My daily routine is short. At the London open I check the H4 trend, note where CCI sits, and write down the two trades I would take. I trade only the ones on the list, I stop at two trades or 1,000 dollars of loss, and I am flat before the New York close. The indicator does not make me money. It tells me when a move is real, and waiting for a real move is what keeps a funded account alive.
Frequently asked questions
What is the Commodity Channel Index?
The Commodity Channel Index is a momentum oscillator built by Donald Lambert and published in October 1980. It compares the typical price, the average of the high, low and close, with its average over the last fourteen bars, and scales the difference by a constant of 0.015 so that 70 to 80 percent of readings fall between -100 and +100. Readings above +100 mean price is stretched far above its average, usually a strong uptrend; readings below -100 mean price is stretched far below its average, usually a strong downtrend.
What is the best CCI setting for a funded account?
Period 14 on the H1 chart, the platform default, and period 20 on the H4 chart, matching Lambert’s original. I do not optimise the period: changing it to fit last month’s chart is curve-fitting. The settings that matter are the timeframe, the session and the trade cap, not the period.
Is above +100 overbought, and should I sell it?
No. Above +100 means price is far above its average, which usually means a strong uptrend is running, not that a top is near. Selling +100 cost me 480 dollars on GBPUSD. I buy a +100 cross with the H4 trend behind it, and I only exit when CCI falls back below +100, which is the trend-exhaustion signal.
Does CCI repaint?
CCI does not repaint: once a bar closes, its CCI value is fixed. The live value on the current bar moves with every tick, so a +100 cross that appears mid-bar can vanish before the close. That is why my rule needs the cross to hold into the close of the signal bar, and why I never enter on a live, unclosed reading.
Can I use CCI on a prop firm challenge?
Yes. The indicator is a standard charting tool, not an EA and not a banned strategy, and it fits challenge rules well because it is slow, selective and fully planned in advance: every trade has a stop below the last swing and a size from the formula. Check your firm’s rules on news trading separately, because CCI means nothing during a red-folder release.
How is CCI different from RSI?
RSI measures the speed of recent gains versus losses and is bounded between 0 and 100, while CCI measures how far price has stretched from its own average and is unbounded. RSI answers whether a move is tired; CCI answers whether a move is real. I use both: CCI for trend-strength breakouts at +100 and -100, RSI for overbought and oversold zones inside a range.
Trading involves substantial risk of loss and is not suitable for every investor. This article is educational, not financial advice. Never risk money you cannot afford to lose, and never trade a funded account with rules you have not tested on demo first.


