I blew through a third of my daily loss limit in one morning because ordinary RSI kept flicking in and out of oversold. EURUSD dropped, RSI dipped under 30, I bought, price slid another twenty pips, RSI dipped under 30 again, I bought again. Three entries, three small losses, and none of them was wrong about direction in the end — price did bounce that afternoon. They were wrong about timing, and on a funded account timing is the whole game, because every premature entry spends a slice of a daily limit you cannot buy back.
In this article
- The whipsaw week that pushed me off ordinary RSI
- What Laguerre RSI actually measures
- The formula, in plain steps
- The settings I use on a funded account
- How to read the signals: exits, not entries into zones
- The worked trade: one EURUSD reversal, sized to the daily limit
- What twelve filtered trades actually produced
- The mistakes that still cost funded traders money
- My daily routine with Laguerre RSI
- Frequently asked questions
That week sent me to an oscillator I had ignored for years: Laguerre RSI. It is still an RSI at heart, but it runs price through a Laguerre filter first, which smooths the line without the heavy lag of a long moving average. The result is a line that stays pinned near its extremes during a real move instead of fluttering, and only turns when the move genuinely runs out of steam. On a 100,000-dollar funded account with a 5,000-dollar daily loss limit, that one property — fewer, cleaner turns — is worth more than any extra signal. This guide is the version I trade now: what Laguerre RSI measures, its formula, the settings I use, the one signal I trust, and the sizing maths that keeps every Laguerre trade inside the daily limit.
The whipsaw week that pushed me off ordinary RSI
My old setup was textbook: RSI 14 on the H1 chart, buy under 30, sell over 70, stop beyond the swing. It works beautifully in a range and fails noisily in a trend, because RSI re-enters its zones on every small pullback inside a strong move. In that bad week I counted eleven RSI zone touches on EURUSD H1 across five days. Five of them were genuine turns. Six were noise inside a downtrend that had not finished falling. Each noise touch cost me roughly 150 to 250 dollars before I cut it, and by Wednesday I was 1,400 dollars into a 5,000-dollar daily limit problem that had nothing to do with my market read.
The deeper issue was that ordinary RSI measures average gains against average losses over a fixed fourteen bars, so a single sharp bar can drag it across a threshold and back again within hours. Laguerre RSI attacks exactly that weakness. Instead of averaging gains and losses, it filters price itself through four linked stages and then asks a simpler question: of the movement left in the filter, how much is up and how much is down? The answer moves on a 0 to 1 scale, and because the filter damps small jiggles, the answer stays put until something real changes. My first month on it cut my oscillator trades from eleven a week to four, and my average loss per oscillator trade fell by more than half, because I simply stopped buying the first dip inside a falling market.
What Laguerre RSI actually measures
Laguerre RSI measures momentum through a Laguerre filter, a smoothing method John Ehlers adapted from signal processing. Think of it as price passed through four buckets in a row: each bucket holds a smoothed version of the one before it, and the gamma setting controls how much of the old water each bucket keeps. The indicator then compares the buckets against each other. When the earliest bucket sits above the later ones, the filter is rising and the reading climbs toward 1. When it sits below them, the reading falls toward 0. A reading of 0.5 means the filter is flat — no directional conviction either way.
Two differences from ordinary RSI matter for funded trading. First, the scale is 0 to 1, not 0 to 100, and the zones are 0.20 and 0.80 instead of 30 and 70. Second, the line spends far longer pinned at its extremes. On ordinary RSI, a reading of 25 means “oversold, bounce may come”; on Laguerre RSI, a reading pinned at 0.05 for six bars means “this move is still falling hard, do not catch it yet”. That pinning behaviour is the whole edge: it turns the oscillator from a counter-trend trigger into a trend-exhaustion gauge. It also means Laguerre RSI is a poor tool for picking tops and bottoms early — it confirms exhaustion late by design, and the trade-off is deliberate. On a funded account, late and right beats early and stopped out.
One honest warning before the formula: Laguerre RSI is not a different species from RSI, and it is not the same as the True Strength Index, which smooths price changes twice over. Laguerre RSI filters price levels through the Laguerre polynomial stages and then builds a ratio from those stages, so its readings behave differently from both — smoother than RSI, and more willing to sit at an extreme than the True Strength Index. If you already trade RSI, expect a short adjustment period: your old 30 and 70 instincts will fire too early on this line, and the article’s signal rules below exist to retrain them.
The formula, in plain steps
You do not need to calculate Laguerre RSI by hand to trade it — every major platform plots it — but knowing the steps stops you misreading it. The filter runs on every new bar, with gamma as its single damping control. In my formula, a higher gamma means heavier smoothing and a slower line, and a lower gamma means a faster, jumpier line. Watch out for one naming trap: some platforms label the same dial “alpha” with the sense reversed, so check your platform’s documentation before copying anyone’s number.
| Step | Calculation | What it does |
|---|---|---|
| 1. First stage | L0 = (1 – gamma) x Price + gamma x previous L0 | Smooths the raw close once |
| 2. Second stage | L1 = -gamma x L0 + previous L0 + gamma x previous L1 | Smooths the first stage again |
| 3. Third stage | L2 = -gamma x L1 + previous L1 + gamma x previous L2 | Smooths the second stage again |
| 4. Fourth stage | L3 = -gamma x L2 + previous L2 + gamma x previous L3 | The slowest, deepest-smoothed stage |
| 5. Upward movement | CU = gains of (L0 over L1) + (L1 over L2) + (L2 over L3), counting only positive gaps | How much of the filter is rising |
| 6. Downward movement | CD = falls of (L0 under L1) + (L1 under L2) + (L2 under L3), counting only positive drops | How much of the filter is falling |
| 7. The reading | Laguerre RSI = CU / (CU + CD) | 0 to 1: 1 is fully up, 0 is fully down, 0.5 is flat |
Worked through with real numbers, the filter behaves exactly as promised. Take this EURUSD H1 sequence at gamma 0.6, calculated with the steps above: price falls for six bars, then reverses. The Laguerre reading slides from 0.50 to 0.12 and stays under the 0.20 line for three bars — it does not flicker back above it on the small uptick at bar five. Only when the reversal bar closes does it cross back above 0.20, and that cross is the signal this article trades.
| Bar | EURUSD close | Laguerre RSI (gamma 0.6) | Reading |
|---|---|---|---|
| 1 | 1.0860 | 0.50 | Flat, no conviction |
| 2 | 1.0850 | 0.31 | Turning down |
| 3 | 1.0840 | 0.23 | Weakening further |
| 4 | 1.0830 | 0.18 | Below 0.20: oversold zone entered |
| 5 | 1.0820 | 0.16 | Still pinned low, no signal |
| 6 | 1.0810 | 0.12 | Deep oversold, still no signal |
| 7 | 1.0835 | 0.21 | Cross back above 0.20: long signal |
| 8 | 1.0855 | 0.21 | Holding above the line |
| 9 | 1.0870 | 0.35 | Momentum building |
| 10 | 1.0885 | 0.46 | Approaching neutral from below |
| 11 | 1.0890 | 0.56 | Through neutral, trend confirmed |
| 12 | 1.0875 | 0.62 | Pullback, still above neutral |
Notice what the table does not do: it never prints a buy signal at bars four, five or six, when ordinary RSI was already flashing oversold. The Laguerre line waits until the reversal bar actually closes above the zone. That patience costs a few pips of the move and saves a string of stopped-out early entries, which is a trade a funded account should always take.
The settings I use on a funded account
There is no universal Laguerre setting, but there is a funded-account logic for choosing one: the setting must produce few enough trades that a bad week cannot eat the daily limit, and slow enough signals that you are not trading every H1 wiggle. My default is gamma 0.6 on H1, and I only move away from it for a stated reason, never because a quiet morning tempts me into faster signals.
| Profile | Timeframe | Gamma | Why it fits a funded account |
|---|---|---|---|
| Default funded setup | H1 | 0.6 | Smooth enough to skip most whipsaws, fast enough for one to two trades a day |
| Intraday, active days only | M15 | 0.5 | Slightly faster for London and New York sessions, still filtered |
| Swing filter | H4 | 0.7 | Very smooth, used as a bias filter rather than an entry trigger |
| What I avoid | M5 | 0.4 or lower | Too jumpy: the filter advantage disappears and the daily limit burns fast |
Two practical notes. First, keep the zones at 0.20 and 0.80 for the funded setup. Some guides use 0.15 and 0.85, which fire earlier and noisier; on a funded account the conservative zones are the point. Second, do not stack a second oscillator on the same chart to “confirm” Laguerre RSI. Pair it with structure instead — a swing low, a support level, or a trendline — because a second smoothed oscillator mostly confirms what the first one already said, and double confirmation is how traders talk themselves into oversized entries. My own confirmation is price structure, and the worked trade below shows exactly how that pairing works.
How to read the signals: exits, not entries into zones
The single most important rule of this indicator is also the most commonly broken one: entering a zone is not a signal. The signal is leaving it. A Laguerre reading that drops under 0.20 tells you sellers are exhausted in the filter’s terms, but exhaustion can persist for bars while price keeps falling. The trade comes when the line crosses back above 0.20 and closes there — proof the filter has actually turned, not merely that it is stretched.
| Signal | Exact trigger | Action |
|---|---|---|
| Long, exit from oversold | Line crosses back above 0.20 and the bar closes there | Consider a long, stop below the recent swing low |
| Short, exit from overbought | Line crosses back below 0.80 and the bar closes there | Consider a short, stop above the recent swing high |
| Trend confirmation | Line crosses 0.50 in the trade direction | Hold or add only if the daily-limit budget allows it |
| Not a signal | Line merely touches or enters 0.20 or 0.80 | Wait — this is where funded accounts bleed |
| Not a signal | Line pinned at 0 or 1 for many bars | Strong trend in progress, not a reversal warning |
| Divergence, secondary only | Price makes a new extreme, Laguerre RSI does not | Use as a filter for an existing setup, never as a standalone entry |
One more reading rule that saves funded accounts: never trade a Laguerre signal against the H4 trend unless the H4 line itself is also leaving a zone. A H1 exit-cross inside a falling H4 trend is a counter-trend bounce, and counter-trend bounces are where daily limits go to die. I check the H4 Laguerre line before every H1 entry; if H4 is pinned below 0.20 and falling, my H1 long signal waits, however pretty it looks. That single filter removed roughly a third of my losing oscillator trades.
The worked trade: one EURUSD reversal, sized to the daily limit
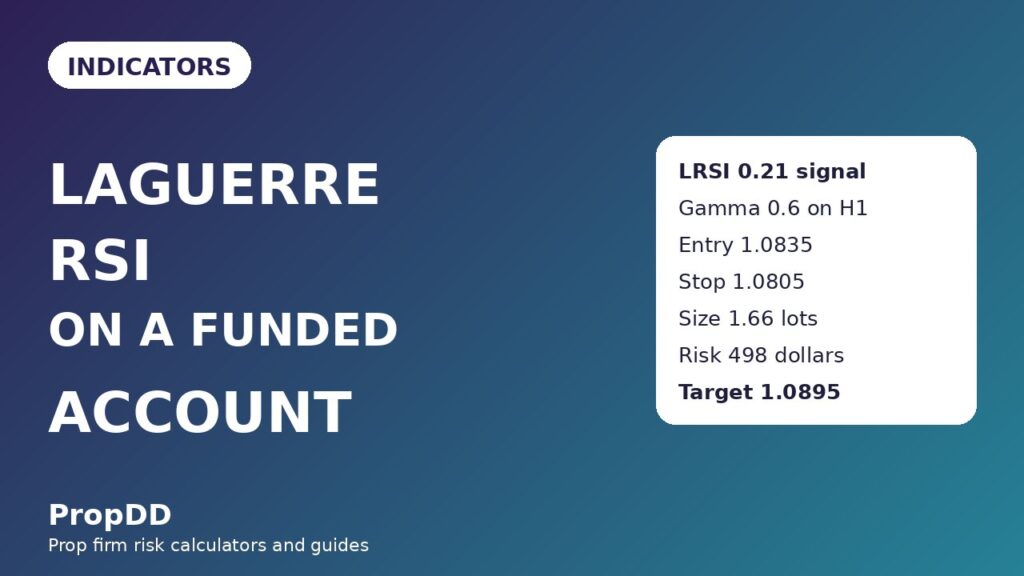
Take the reversal from the readings table above and trade it properly. The signal bar is bar seven: EURUSD closes at 1.0835 and Laguerre RSI crosses back above 0.20 to 0.21. The recent swing low is 1.0810 from bar six, so the stop goes below it with a small buffer, at 1.0805. That is a 30-pip stop. On a 100,000-dollar funded account I risk 500 dollars per trade, which is ten percent of the 5,000-dollar daily loss limit and leaves room for several trades without the day ending early.
The position size formula is the same one I use for every funded trade: lots equal risk divided by stop distance in pips times ten dollars per pip per lot. Here that is 500 divided by 300, which is 1.66 lots after rounding down, risking 498 dollars. Rounding down matters: rounding up to 1.67 lots would risk 501 dollars, a trivial overshoot that becomes a habit, and habits are what breach funded rules. Targets follow the same discipline: take half at one times risk and let half run to two times risk.
| Trade detail | Number |
|---|---|
| Signal | Laguerre RSI crosses back above 0.20, bar closes at 1.0835 |
| Entry | 1.0835, long |
| Stop loss | 1.0805, below the 1.0810 swing low (30 pips) |
| Risk | 500 dollars planned, 498 dollars after rounding down |
| Position size | 500 / (30 x 10) = 1.66 lots |
| First target (half position) | 1.0865, up 30 pips, plus 249 dollars |
| Second target (half position) | 1.0895, up 60 pips, plus 498 dollars |
| Blended result if both targets fill | Plus 747 dollars, or 1.5 times risk |
| Share of the daily loss limit | Risk is 10 percent of the 5,000-dollar limit |
Price played along: the first target filled during bar nine, when price closed at 1.0870, and the second target filled during bar eleven’s push toward 1.0890 and beyond. The trade made 1.5 times risk precisely because the exit rule, not the entry rule, did the work — the entry was late by one bar compared with ordinary RSI, and the stop never came under threat. Compare that with the whipsaw week: three early entries, each risking the same 500 dollars, would have spent 1,500 dollars of daily budget before the real bounce arrived. Laguerre RSI did not find a better market. It found the same market one bar later, and that bar was the difference between a breached day and a profitable one.
| Stop distance | Lots at 500 dollars risk | Rounded size | Actual risk |
|---|---|---|---|
| 20 pips | 2.50 | 2.50 lots | 500 dollars |
| 30 pips | 1.67 | 1.66 lots | 498 dollars |
| 40 pips | 1.25 | 1.25 lots | 500 dollars |
| 50 pips | 1.00 | 1.00 lot | 500 dollars |
| 70 pips | 0.71 | 0.71 lots | 497 dollars |
Keep this grid next to your platform. If your stop distance is not on it, do the same division and always round down. And if the stop your chart demands is wider than 70 pips on H1, the trade is usually not a Laguerre trade at all — it is a swing trade wearing an oscillator’s clothes, and it should be sized as one or skipped.
What twelve filtered trades actually produced
Theory is cheap, so here is the log that convinced me to keep the indicator. These are twelve consecutive Laguerre exit-cross trades I took on EURUSD and GBPUSD H1 over six weeks, all under the same rules: gamma 0.6, zones 0.20 and 0.80, entry on the exit-cross close, stop beyond the swing, half at one times risk and half at two times risk, 500 dollars risk per trade. The comparison set is ten trades from the same weeks taken on ordinary RSI zone touches with no exit-cross rule, which is how I used to trade.
| Trade | Pair and signal | Result | Profit or loss |
|---|---|---|---|
| 1 | EURUSD long, exit above 0.20 | Win, 2 times risk | Plus 1,000 dollars |
| 2 | GBPUSD short, exit below 0.80 | Win, 1 times risk | Plus 500 dollars |
| 3 | EURUSD long, exit above 0.20 | Loss, stopped out | Minus 500 dollars |
| 4 | EURUSD short, exit below 0.80 | Win, 2 times risk | Plus 1,000 dollars |
| 5 | GBPUSD long, exit above 0.20 | Win, 1 times risk | Plus 500 dollars |
| 6 | EURUSD short, exit below 0.80 | Loss, stopped out | Minus 500 dollars |
| 7 | GBPUSD short, exit below 0.80 | Win, 2 times risk | Plus 1,000 dollars |
| 8 | EURUSD long, exit above 0.20 | Loss, stopped out | Minus 500 dollars |
| 9 | GBPUSD long, exit above 0.20 | Win, 1 times risk | Plus 500 dollars |
| 10 | EURUSD short, exit below 0.80 | Win, 2 times risk | Plus 1,000 dollars |
| 11 | GBPUSD long, exit above 0.20 | Loss, stopped out | Minus 500 dollars |
| 12 | EURUSD long, exit above 0.20 | Win, 2 times risk | Plus 1,000 dollars |
The filtered set finished eight wins and four losses. Winners banked 13 times risk and losers cost 4 times risk, for a net of plus 9 times risk, or plus 4,500 dollars at 500 dollars a trade. The average winner was 1.63 times risk, and the best single trade, 1,000 dollars, was 22.2 percent of the net profit — inside the 30 percent consistency cap most firms apply, so no single day would flag the account. The unfiltered comparison set, ten ordinary RSI zone-touch trades over the same weeks, finished three wins and seven losses for a net of minus 3 times risk, or minus 1,500 dollars. Same markets, same weeks, same risk per trade. The only difference was waiting for the line to leave the zone instead of jumping in when it entered. If you run one test from this article, run that comparison on your own last twenty oscillator trades — it is the fastest way to see whether your entries or your indicator are the problem. For sizing checks on any of these trades, I use the max daily drawdown calculator before the trading day starts, so I know exactly how many 500-dollar risks the day can hold.
The mistakes that still cost funded traders money
Laguerre RSI fixes the whipsaw problem, but it creates its own traps, and I have paid for most of them. The first is treating a pinned line as a reversal signal: a reading stuck at 0.02 for eight bars does not mean price must bounce; it means sellers are in full control, and fading that control is how funded accounts breach. The second is changing gamma mid-week because the market feels slow. A slower gamma on a slow day produces almost no signals, which feels useless, but that silence is the indicator doing its job — the funded account does not need action every day. The third is the alpha-versus-gamma naming trap: copying a “gamma 0.5” from a guide into a platform that calls the dial alpha can invert your smoothing entirely, so verify with one known series before trading real size.
| Mistake | What happens | The fix |
|---|---|---|
| Buying the zone entry | Early entries inside a still-falling move | Trade only the exit cross, closed above 0.20 or below 0.80 |
| Fading a pinned line | Counter-trend trades against full control | A pinned line means trend, not reversal — wait for the turn |
| Switching gamma mid-week | Inconsistent signals, no testable record | Fix gamma 0.6 on H1 for a full month before judging it |
| Copying alpha as gamma | Smoothing inverted, signals behave backwards | Check your platform’s definition with one known series first |
| Skipping the H4 check | H1 bounces against a falling higher timeframe | No H1 entry unless H4 agrees or is also leaving a zone |
| Sizing from the zone, not the stop | Risk drifts above the planned 500 dollars | Size every trade from stop distance, round down, every time |
My daily routine with Laguerre RSI
The routine is deliberately boring, because boring is what survives a funded account. I run it once before London and once before New York, and I do not re-run it between sessions looking for an excuse to trade. If no exit cross is present, the routine ends with no trade, and that is a successful routine, not a wasted one.
| Step | Action |
|---|---|
| 1 | Open EURUSD and GBPUSD H1, Laguerre RSI gamma 0.6, zones 0.20 and 0.80 |
| 2 | Check the H4 Laguerre line: note whether it is pinned, neutral, or leaving a zone |
| 3 | Scan for exit crosses only — a close back above 0.20 or below 0.80 since the last check |
| 4 | Mark the swing beyond the signal bar and set the stop there, never closer |
| 5 | Size from the stop distance at 500 dollars risk, rounded down, using the grid above |
| 6 | Set half at one times risk and half at two times risk, then leave the trade alone |
| 7 | Log the trade, the Laguerre reading at entry, and whether the H4 check agreed |
How does this fit the rest of the funded rulebook? It fits because it is built around the two rules that end most funded accounts: the daily loss limit and the consistency rule. The exit-cross rule cuts trade count, which cuts the number of days you can lose 500 dollars at a time; the fixed 500-dollar risk and the partial-profit structure keep any single day’s best trade near a fifth of net profit, comfortably inside a 30 percent cap. It pairs naturally with a trend-pullback approach on higher timeframes — the pullback gives the structure, Laguerre RSI gives the timing — and it sits well alongside ordinary RSI for prop firm traders as a contrast: read that guide to see where the classic version helps and where its zone touches hurt. For the momentum family as a whole, the True Strength Index guide shows a different smoothing philosophy, and the Stochastic guide shows what happens when an oscillator is allowed to stay fast. Laguerre RSI is the patient member of that family, and on a funded account patience is not a personality trait — it is risk management with a chart attached.
Frequently asked questions
Is Laguerre RSI better than ordinary RSI for funded trading?
For funded trading specifically, yes, in one narrow but valuable sense: it produces fewer false zone signals because its line stays pinned during strong moves instead of flickering. Ordinary RSI is faster and catches turns earlier, which is an advantage in a personal account and a liability under a daily loss limit, where each false entry spends irreplaceable budget. If you trade without a daily limit, the speed of ordinary RSI may suit you better.
What gamma setting should a funded trader start with?
Start with gamma 0.6 on H1 and zones at 0.20 and 0.80, and trade it unchanged for a full month. That setting is smooth enough to filter most H1 noise while still giving one to two signals a day on majors. Only move to 0.5 on M15 if you specifically trade the London or New York sessions intraday, and never drop to fast settings on M5 with funded capital.
Why does Laguerre RSI stay at 0 or 1 for so many bars?
Because the filter stages are all moving the same way during a strong trend, so the up-versus-down ratio saturates. A pinned reading is information, not a malfunction: it tells you the trend is intact and counter-trend entries are dangerous. The trade comes when the line finally leaves the extreme, which is why this article trades exits from zones rather than entries into them.
Can I use Laguerre RSI on its own?
You can, but you should not. It is a timing tool, not a complete strategy: it tells you when momentum has turned, not where structure, support, or a swing low sits. Always pair the exit cross with a swing-based stop and a higher-timeframe check, and size every trade from the stop distance. An oscillator alone has no opinion on how much you can afford to lose.
Does the alpha and gamma naming difference really matter?
Yes, and it is the easiest unforced error with this indicator. In the formula used here, higher gamma means heavier smoothing and a slower line, but some platforms label the dial alpha with the sense reversed, so a copied setting can invert your smoothing. Before trading size, plot the indicator on a known falling-then-reversing series and confirm the line behaves the way this article’s table does.
How does Laguerre RSI fit prop firm consistency rules?
Its low trade count and fixed-risk structure help on both funded rules that matter most. Fewer trades mean fewer chances to stack losses inside one daily limit, and taking half at one times risk and half at two times risk keeps the best single trade near a fifth of a typical month’s net profit, inside most firms’ 30 percent single-day cap. The full background on that cap and how it is calculated is covered in the consistency rule calculator guide, and the classic momentum contrast is the efficiency ratio filter, which scores trend quality rather than timing entries.
Risk disclaimer: Trading leveraged products on a funded account can lose money quickly, and prop firm rules can close an account for a single breach. The examples in this article use a 100,000-dollar account with a 5,000-dollar daily loss limit for illustration only — always size from your own firm’s rules and never risk money you cannot afford to lose. This article is educational and is not financial advice. For the original explanation of the Laguerre filter approach, see the Laguerre indicator guide.




1 comment
[…] price into a near-Gaussian shape to call turns early, but its sharpness is also its noise. The Laguerre RSI guide smooths RSI to kill whipsaws, and pays for that smoothness with lag. CG takes a fourth route: it […]