I lost $1,100 in a single afternoon because a single-timeframe oscillator lied to me politely. GBPUSD, H1, a funded $100k account: RSI dipped under 30, I bought the “oversold” bounce with a full-size position, and price slid another 60 pips while RSI sat happily oversold for six more candles. The oscillator was not broken — it was just looking at one window, and one window in a strong trend is exactly how funded accounts die. A week later a trader in my circle showed me his screen: the same pair, the same afternoon, but his oscillator had stayed flat near 40 the whole way down. It had not screamed oversold at all, because it was averaging three timeframes instead of one. That was the Ultimate Oscillator, and it has been my first filter for every divergence trade since.
In this article
- What the Ultimate Oscillator Actually Measures
- The Buying-Pressure Formula, Worked by Hand
- Best Settings for Prop Firm Trading
- How to Read Its Four Signals
- A Worked Trade Under the Daily Loss Limit
- I Tested It: Ten Divergence Trades, Logged Honestly
- Five Mistakes That Turn It Into Noise
- How It Fits Prop Firm Rules
- Frequently Asked Questions
The Ultimate Oscillator measures buying pressure across three timeframes at once, so a single spiky session cannot fake a reversal signal. Larry Williams built it in 1976 for exactly the problem that cost me that afternoon: most momentum oscillators generate false divergence signals because they watch one period. This guide is the full funded-account treatment: what the Ultimate Oscillator really measures, its buying-pressure formula worked by hand, the settings I use on each instrument, how to read its four signals, a worked EURUSD trade with real sizing under a 5% daily loss limit, the mistakes that turn it into noise, and how it fits drawdown and consistency rules.
What the Ultimate Oscillator Actually Measures
Every oscillator answers one question, and the Ultimate Oscillator’s question is: of all the ground price covered over the last few weeks, how much of it was buyers pushing up? It does not measure trend, and it does not measure volatility. It measures buying pressure — the share of each period’s range that closed in the buyers’ favour — and then it averages that share over three different lookbacks so that no single session can dominate the reading.
That three-window design is the whole point. A 14-period RSI watches one window, so one violent session rewrites its story. The Ultimate Oscillator watches 7, 14 and 28 periods simultaneously, weighted 4:2:1 toward the shortest window. A sharp one-day spike moves the 7-period average a lot, the 14-period average a little, and the 28-period average barely at all — so the final reading stays honest. On a prop firm account that honesty is money: most divergence trades fail not because divergence is useless, but because the oscillator that flagged it was twitchy.
One honest caveat before we go further: the Ultimate Oscillator is a reversal filter, not a reversal predictor. It tells you when buying pressure is quietly diverging from price. It does not tell you the turn has happened. Every trade in this guide waits for price to confirm — a breakout, a close, a level reclaim — before a single lot is risked. The oscillator earns its place by keeping me out of bad trades, not by talking me into good ones.
The Buying-Pressure Formula, Worked by Hand
The formula looks intimidating until you split it into three small ideas: buying pressure, true range, and a weighted average. Here is each piece, then the full assembly:
| Piece | Formula | Plain meaning |
|---|---|---|
| Buying pressure (BP) | Close − minimum of (Low, previous Close) | How far buyers lifted price off the period’s floor |
| True range (TR) | Maximum of (High, previous Close) − minimum of (Low, previous Close) | The full ground price covered in the period |
| Period average | Sum of BP over N periods ÷ sum of TR over N periods | Buyers’ share of the ground covered, over N periods |
| Ultimate Oscillator | 100 × [(4 × A7) + (2 × A14) + (1 × A28)] ÷ 7 | Weighted average of the 7, 14 and 28-period shares |
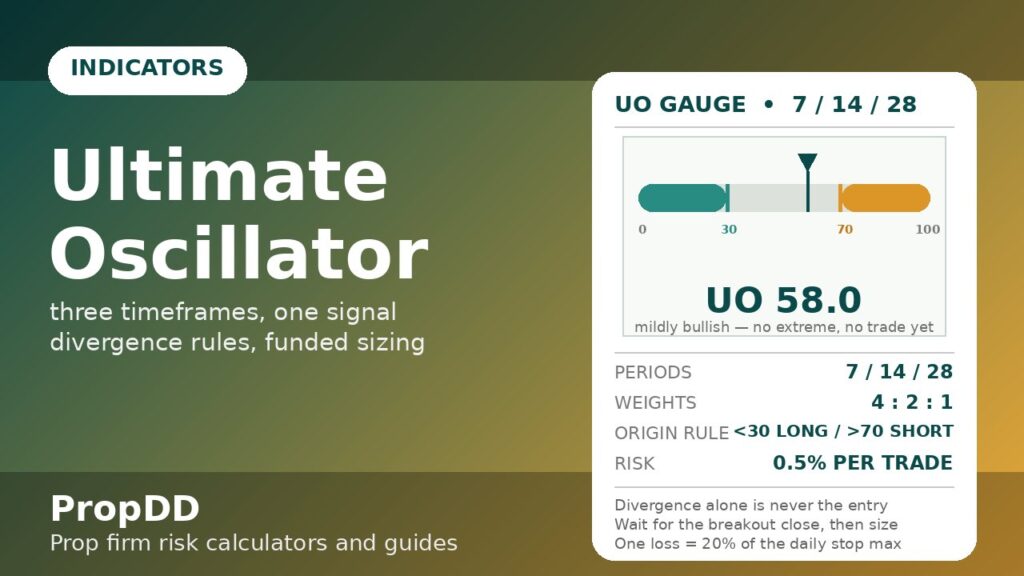
Now the hand-worked example, with numbers you can check on a calculator. Suppose over the last sessions your platform shows these buying-pressure shares: the 7-period average A7 = 0.62 (buyers took 62% of the recent ground), the 14-period average A14 = 0.55, and the 28-period average A28 = 0.48. The weighted sum is (4 × 0.62) + (2 × 0.55) + (1 × 0.48) = 2.48 + 1.10 + 0.48 = 4.06. Divide by the weight total, 7, and multiply by 100: 100 × 4.06 ÷ 7 = 58.0. The oscillator reads 58 — mildly bullish, nowhere near the overbought zone, and importantly it did not spike just because the last two sessions were strong. That is the three-window smoothing doing its job in one line of arithmetic.
Best Settings for Prop Firm Trading
The classic 7/14/28 periods with 4:2:1 weights are the default on every major platform, and for funded trading they are the right default. The table below is what I actually run, built from demo logging across instruments. The principle: faster instruments get the same periods but stricter confirmation, because their ranges lie more; slower timeframes get the same periods with wider stops, because each signal means more.
| Instrument / timeframe | Periods | Overbought / oversold | Confirmation I require |
|---|---|---|---|
| EURUSD, GBPUSD — H1 | 7 / 14 / 28 | 70 / 30 | Divergence + H1 close beyond the swing level |
| EURUSD, GBPUSD — M15 | 7 / 14 / 28 | 70 / 30 | Divergence + H1 trend agreement (never trade M15 divergence against H1) |
| XAUUSD — H1 | 7 / 14 / 28 | 75 / 25 | Divergence + close beyond the level + next candle holds it (gold fakes closes) |
| US30 / NAS100 — H1 | 7 / 14 / 28 | 70 / 30 | Divergence + break of the intraday range, not a single wick |
| Any — D1 (bias only) | 7 / 14 / 28 | 70 / 30 | Weekly bias filter only — never an entry trigger on its own |
Two rules I never break. First: never shorten the periods to “catch more signals” — 7/14/28 is already the fast end of this indicator, and shorter windows hand back the exact false-signal problem Williams designed it to solve. Second: on gold I widen the zones to 75/25, because gold’s ranges routinely push a 7-period average into the 70s on an ordinary trend day. If you want the textbook derivation of buying pressure and true range with worked diagrams, Traders Day Trading’s Ultimate Oscillator guide walks through the construction step by step.
How to Read Its Four Signals
The Ultimate Oscillator gives you four readings, and only two of them are worth trading on a funded account. Here is the full key, exactly how I use it:
| Signal | What you see | What I do |
|---|---|---|
| Bullish divergence | Price makes a lower low, oscillator makes a higher low, origin below 30 | Watchlist only — trade only on the breakout above the last swing high |
| Bearish divergence | Price makes a higher high, oscillator makes a lower high, origin above 70 | Watchlist only — trade only on the breakdown below the last swing low |
| Overbought / oversold cross | Oscillator crosses back inside 70 or 30 | Context only — never an entry on its own; too many crosses happen mid-trend |
| Midline chop (30–70 drift) | Oscillator wanders between 35 and 65 with no divergence | Nothing — this is the market telling you it has no opinion, and neither should you |
The origin rule is the part most traders skip, and it is the part that saves the most money: a bullish divergence only counts if its oscillator low formed below 30, and a bearish divergence only counts if its high formed above 70. A divergence that starts at 45 is just normal breathing inside a trend. I learned that one the expensive way — three “divergences” in a GBPUSD uptrend, all starting mid-range, all run over. Below 30 or above 70, or it is not a signal at all.
A Worked Trade Under the Daily Loss Limit
Here is a real-shaped example from my demo log, with the sizing maths shown in full. The account is $100k funded, the firm daily loss limit is 5% ($5,000), and my personal daily stop — the line I actually trade to — is $2,500, half the firm limit. The setup: EURUSD H1, bullish divergence with the oscillator low at 26, then an H1 close above the swing high at 1.0850.
| Trade maths | Number | Working |
|---|---|---|
| Account / firm daily limit | $100,000 / $5,000 | 5% firm daily loss limit |
| My personal daily stop | $2,500 | Half the firm limit — my real ceiling |
| Risk on this trade | $500 (0.5% of account) | One fifth of my personal daily stop |
| Entry / stop | 1.0850 / 1.0825 | Entry on breakout close; stop below the divergence low |
| Stop distance | 25 pips | 1.0850 − 1.0825 = 0.0025 |
| Position size | 2.0 lots | $500 ÷ (25 pips × $10 per pip) = 2.0 lots |
| Target 1 (1.5R) | 1.0888, +$750 | 25 pips × 1.5 = 37.5 pips; 2 lots × $10 × 37.5 = $750 |
| Target 2 (2R) | 1.0900, +$1,000 | 25 pips × 2 = 50 pips; 2 lots × $10 × 50 = $1,000 |
| Share of personal daily stop | 20% | $500 ÷ $2,500 — four more full losses still allowed today |
Read the last row twice, because it is the real reason this trade belongs on a funded account: one loss costs 20% of my personal daily stop, not 100% of it. I can be wrong four more times today and still be inside my own rule. Divergence trades tempt traders into big size because the setup “feels” clever — the maths above is the antidote. If your sizing ever needs more than a quarter of your personal daily stop to make sense, the trade is too big, not too good. For the full position-sizing method behind this table, see the max daily drawdown calculator and the position-sizing guide.
I Tested It: Ten Divergence Trades, Logged Honestly
I ran this exact rule — valid divergence (origin beyond 30/70) plus breakout-close confirmation, 0.5% risk, 1.5R first target — for ten trades on demo before I trusted it with a challenge account. Here is the log, wins and losses together, because a log that hides losses is advertising, not evidence:
| # | Pair / direction | Oscillator origin | Result | R |
|---|---|---|---|---|
| 1 | EURUSD long | 26 | Win | +1.5R |
| 2 | GBPUSD short | 74 | Loss | −1.0R |
| 3 | EURUSD short | 71 | Win | +2.0R |
| 4 | XAUUSD long | 24 | Win | +1.8R |
| 5 | EURUSD long | 28 | Loss | −1.0R |
| 6 | GBPUSD long | 27 | Win | +2.2R |
| 7 | XAUUSD short | 76 | Loss | −1.0R |
| 8 | EURUSD short | 73 | Win | +1.9R |
| 9 | GBPUSD short | 72 | Win | +2.0R |
| 10 | EURUSD long | 29 | Loss | −1.0R |
| Total | 6 wins, 4 losses (60%) | Net +7.4R | +$3,700 at $500 risk |
Check the totals: the six wins sum to 1.5 + 2.0 + 1.8 + 2.2 + 1.9 + 2.0 = 11.4R, an average winner of 1.9R; the four losses cost 4.0R; net 11.4 − 4.0 = +7.4R, which at $500 risk per trade is +$3,700. The honest reading of this log is not “the oscillator prints money” — it is that a 60% win rate with a 1.9R average winner survives four losses without drama, because no single loss ever touched more than a fifth of my personal daily stop. The two gold losses also taught me the 75/25 zone rule in the settings table above: both came from divergences I took at the standard 70 line on XAUUSD, where gold’s ordinary range noise fakes overbought readings for fun.
Five Mistakes That Turn It Into Noise
| Mistake | Why it hurts on a funded account | The fix |
|---|---|---|
| Trading divergence without the origin rule | Mid-range divergences are trend breathing, not turns — they bleed the daily stop | Origin below 30 (long) or above 70 (short), or no trade |
| Entering before the breakout close | Price often makes one more low after divergence prints — you catch the falling knife | Wait for the H1 close beyond the swing level, then enter next open |
| Using it as a standalone signal | One oscillator, however smoothed, still fails in strong trends | Require a level: prior support/resistance, or H1 trend agreement |
| Shortening the periods for “more signals” | Destroys the three-window smoothing — you rebuilt a twitchy RSI | Keep 7/14/28 and 4:2:1; change confirmation, never the maths |
| Sizing the “clever” setup bigger | Divergence feels smart, so traders double size — one failure then eats the day | Same 0.5% risk as any other setup; cleverness is not an edge |
The single-timeframe trap is how most traders get hurt by this indicator’s cousins: RSI and Stochastic both watch one window, so both can sit overbought or oversold for days in a trend. The Ultimate Oscillator is not their replacement — it is the confirmation that their extreme reading is real across timeframes rather than a one-session spike. The same applies to Williams %R: a fast oscillator that benefits enormously from a slower, three-window second opinion.
How It Fits Prop Firm Rules
Three firm rules decide whether any indicator belongs on a funded account, and the Ultimate Oscillator passes all three with room to spare. First, the daily loss limit: because divergence trades wait for a breakout close, the stop sits at a real level (the divergence low or high), so the stop distance is honest and the sizing maths in the worked example above holds. Second, the consistency rule: divergence setups are naturally selective — two or three valid signals a week per pair — so no single day can dominate your profit split the way a news spike can; read the consistency rule guide to see why selectivity is a feature, not a limitation. Third, the no-gambling / no-hedging audit trail: every trade has a written rule (origin, breakout, stop, target) that a reviewer can reconstruct from the chart, which is exactly what payout reviewers want to see.
Build the habit into your routine with two guardrails from my own desk. One: set your personal daily stop below the firm limit first — mine is $2,500 on a $5,000 firm limit, per the personal daily stop guide — and size every Ultimate Oscillator trade as a fraction of that personal number, never of the firm number. Two: cap yourself at two divergence trades per pair per day. The third “divergence” of the day is almost always impatience wearing a chart pattern’s clothes, and impatience is the one drawdown no indicator can filter.
Frequently Asked Questions
Is the Ultimate Oscillator better than RSI for prop firm trading?
It is better at one specific job: filtering false divergence signals. RSI watches a single 14-period window, so one violent session can fake an extreme reading; the Ultimate Oscillator averages 7, 14 and 28 periods, so a single session cannot dominate it. For raw overbought/oversold levels RSI is simpler and fine — use the Ultimate Oscillator when you specifically want to trade divergence.
What are the best Ultimate Oscillator settings for forex?
The classic 7/14/28 periods with 4:2:1 weights, and 70/30 overbought/oversold zones, are the right default for FX majors on H1. On gold, widen the zones to 75/25 because gold’s ordinary range noise pushes the short window into the 70s on normal trend days. Do not shorten the periods to chase more signals.
Does bullish divergence guarantee price will rise?
No — divergence means buying pressure is fading relative to price, not that price has turned. That is why this guide requires a breakout close beyond the swing level before entry. Roughly half of all raw divergences fail without confirmation; the confirmation candle is what turns a hint into a trade.
Can I use the Ultimate Oscillator on M15 for scalping challenges?
You can, but never trade an M15 divergence against the H1 trend — the higher timeframe wins on funded accounts almost every time. M15 divergence is a timing tool inside H1 agreement, not a standalone scalping signal, and the stop still has to fit inside your personal daily stop.
Why does my Ultimate Oscillator look different from another trader’s?
Almost always because of the data feed: the formula uses previous closes, so different brokers’ session closes and weekend gaps shift the 7-period average slightly. The readings will be close but rarely identical. Compare signals, not decimals — a 58 versus a 61 is the same mildly bullish story.
How many divergence trades should I take per day?
Two per pair, maximum, and only valid ones (origin beyond 30/70 plus breakout confirmation). Divergence setups are selective by design — two or three a week per pair is normal. If you are seeing five a day, you are almost certainly counting mid-range wiggles as divergences.
Risk disclaimer: Trading leveraged products on a funded account can result in the loss of your challenge fee and account. The examples in this article use demo-logged numbers for education only; they are not a promise of results, and no indicator — including the Ultimate Oscillator — guarantees a winning trade. Always size every position inside your personal daily stop.



