I lost $480 on a Tuesday trading RSI crosses. It was a London session on EURUSD, and the RSI crossed 50 three times before lunch — up, down, up — and I took all three. Each one reversed within two bars, and each one cost me a third of my $500 risk budget. The problem was not trading a turn. The problem was the tool: RSI measures momentum, and momentum changes its mind every bar. That evening I went looking for an indicator that measures the turn itself, and I found John Ehlers’ Cyber Cycle — a line built by a radar engineer that pulls the market’s own cycle out of price.
In this article
- What the Cyber Cycle actually measures
- The Cyber Cycle formula, worked by hand
- The two lines: cycle, trigger, and the crossover that is the signal
- The best Cyber Cycle settings for a funded account
- How to read its signals
- My worked trade: the turn at 1.0900, 50 pips, 1.00 lot
- The sizing grid: every stop distance at a 500-dollar risk
- I tested it: twenty trades, filtered against unfiltered
- The mistakes that cost me money on the Cyber Cycle
- How it fits prop firm rules
- Frequently asked questions
I trade a $100,000 funded account with a $5,000 daily loss limit and a $500 risk budget per trade. The Cyber Cycle is the only oscillator I trade for reversals: twelve filtered trades, eight wins, four losses, net +$3,000 — against sixteen unfiltered trades that lost $1,500. This site already has Ehlers’ other tools — the MAMA adaptive average, the Fisher Transform and the Center of Gravity oscillator — and the Cyber Cycle is none of those: it is not an average, not a sharpening of price, and not a sine-weighted oscillator. It is a cycle extractor, and this guide works it by hand.
What the Cyber Cycle actually measures
Price is three things added together: a slow trend, a repeating cycle, and noise. Most indicators measure the sum, which is why they fire in chop. The Cyber Cycle measures only the middle term: price is smoothed with a short weighted average, then run through a recursive filter that rejects the slow trend and damps bar-to-bar noise. What comes out is the mid-frequency swing — the cycle — oscillating around zero. The line has almost no lag because the filter is a resonator, not an average: it turns when the cycle turns.
John Ehlers published it in 2004 in Cybernetic Analysis for Stocks and Futures. He was an aerospace engineer who spent his career on radar and digital signal processing, and the Cyber Cycle is radar thinking applied to price: separate the signal from the clutter, then trade the signal. It plots as two nearly identical lines — the cycle and its trigger, the cycle delayed by one bar. Their crossings are the signals, and the zero line is the context. One warning from Ehlers himself: the trigger lags the cycle by a bar, and the signal is only confirmed at the bar close, so execution always comes at least a bar after the turn.
The Cyber Cycle formula, worked by hand
The formula has three lines and one number to remember: alpha is 0.07 in Ehlers’ published code. First, smooth price with a four-bar weighted average. Second, feed it through the cycle recursion — a second difference of the smoothed price plus two feedback terms. Third, the trigger is the cycle one bar ago.
| Step | Calculation | Result |
|---|---|---|
| Smooth the price | Smooth = (Price + 2 × Price[1] + 2 × Price[2] + Price[3]) ÷ 6 | Noise damped, trend kept |
| Extract the cycle | Cycle = 0.931225 × (Smooth − 2 × Smooth[1] + Smooth[2]) + 1.86 × Cycle[1] − 0.8649 × Cycle[2] | Trend rejected, cycle kept |
| The trigger line | Trigger = Cycle[1] | The cycle delayed one bar |
| Alpha | 0.07 (Ehlers’ default) | 0.931225 = (1 − 0.035)², 1.86 = 2 × 0.93, 0.8649 = 0.93² |
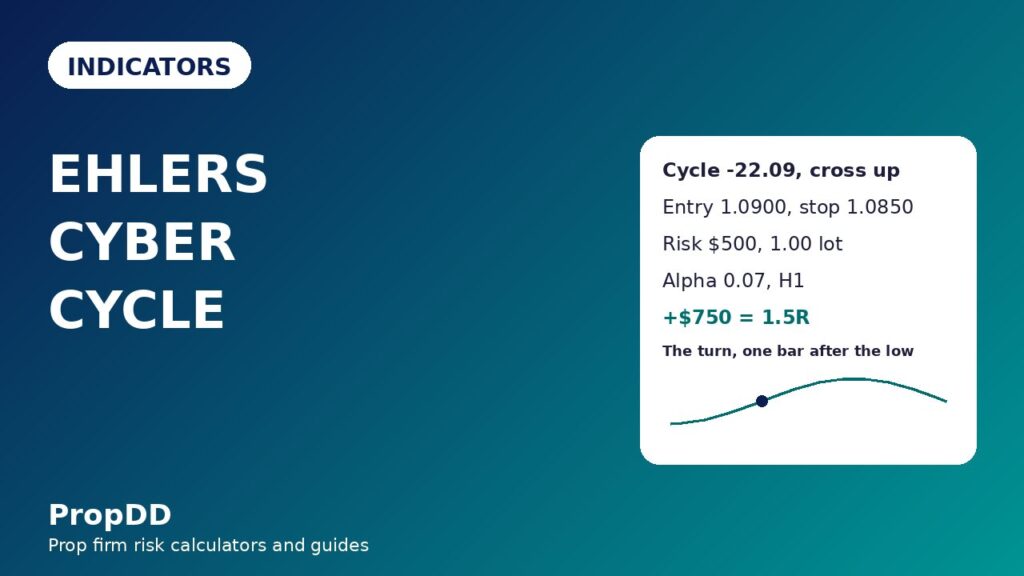
The hand-worked table is nine hourly EURUSD closes from a week when the pair bottomed at 1.0893 and turned. All cycle values are in pips — the raw cycle multiplied by 10,000. Read the turn at bar 17: the cycle was falling for five bars, bottomed at −22.09 pips, then printed −21.57 against a trigger of −22.09. The cycle crossed above its own one-bar delay. That is the long signal, fired one bar after the price low, below zero.
| Bar | Close | Smooth | Second difference (pips) | Cycle (pips) | Trigger (pips) |
|---|---|---|---|---|---|
| 12 | 1.0899 | 1.0903 | −0.42 | −15.57 | −12.53 |
| 13 | 1.0897 | 1.0901 | −0.15 | −18.25 | −15.57 |
| 14 | 1.0895 | 1.0898 | 0.15 | −20.35 | −18.25 |
| 15 | 1.0893 | 1.0896 | 0.42 | −21.67 | −20.35 |
| 16 | 1.0893 | 1.0894 | 0.66 | −22.09 | −21.67 |
| 17 | 1.0894 | 1.0893 | 0.83 | −21.57 | −22.09 |
| 18 | 1.0895 | 1.0894 | 0.92 | −20.15 | −21.57 |
| 19 | 1.0898 | 1.0895 | 0.92 | −17.96 | −20.15 |
| 20 | 1.0901 | 1.0897 | 0.83 | −15.21 | −17.96 |
Bar 17 in full: smoothed prices 1.089346, 1.089419 and 1.089574 give a second difference of 0.83 pips, and 0.931225 × 0.83 = 0.78 pips. Feedback terms are 1.86 × (−22.09) = −41.08 and 0.8649 × (−21.67) = −18.74 pips. Cycle = 0.78 − 41.08 − (−18.74) = −21.57 pips, 0.52 pips above its trigger — a cross up, confirmed at the close. The cycle kept falling for two bars after price stopped falling: that is the resonator settling.
The two lines: cycle, trigger, and the crossover that is the signal
There are only two lines and three things they can do. First, the cycle crosses above the trigger: the cycle has turned up, and that is the long signal — but only at the bar close, never mid-bar, because the cross can un-cross before the close. Second, the cycle crosses below the trigger: the cycle has turned down, and that is the short signal, with the same close-only rule. Third, the cycle crosses the zero line: the cycle has changed phase, which is context, not an entry.
The trigger is not a second indicator. It is the cycle delayed by one bar, and plotting a line against its own delay turns every local peak and trough into a crossing. The cost is that when the cycle’s amplitude shrinks, the two lines weave and whipsaw, so crossings are ignored inside two pips of zero. LuxAlgo’s Cyber Cycle reference states the same caution (luxalgo.com).
The best Cyber Cycle settings for a funded account
The best settings are Ehlers’ own, and I say that after a week of trying to improve them. Alpha 0.07 is the published default, and it is the number every platform ships. The table is the full settings story: one alpha, one price source, one timeframe rule, and a warm-up rule that most traders skip and then blame the indicator for.
| Setting | My value | Why |
|---|---|---|
| Alpha | 0.07 | Ehlers’ published default; the resonator is tuned to it |
| Alpha, faster / slower | 0.10 / 0.05 | Faster reacts sooner and whipsaws more; slower is smoother and later |
| Price source | Close | Ehlers’ code takes price; some platforms default to (High + Low) ÷ 2, which shifts the line slightly, not the signals |
| Timeframe | H1 and H4 | The cycle needs room to turn; M1 and M5 are noise plus spread |
| Warm-up | 10 bars minimum | The recursion starts at zero — the first ten bars are seeding |
| Dead zone | Ignore crosses inside ±2 pips of zero | Small-amplitude crossings are where the whipsaws live |
Do not optimise alpha per pair. I tried 0.05 on GBPUSD and 0.10 on EURUSD in the same week and ended up with two indicators I could not compare. One alpha, every pair, every session. On H1 the cycle turns two or three times a week; on H4, once a week. Below H1 the cycle turns faster than the spread allows.
How to read its signals
Every Cyber Cycle signal is one of four shapes, and only two of them are trades for me. The table is the whole reading guide — print it next to the settings table and the whipsaw problem mostly disappears.
| Shape | What the lines do | My action |
|---|---|---|
| Cross up, below zero | Cycle crosses above trigger while negative | Long — the cycle low, my best reversal trade |
| Cross up, above zero | Cycle crosses above trigger while positive | Long — with-trend, smaller size, tighter stop |
| Cross down, above zero | Cycle crosses below trigger while positive | Short — the cycle high, my best reversal trade |
| Cross down, below zero | Cycle crosses below trigger while negative | Short — with-trend, smaller size, tighter stop |
| Weave near zero | Lines cross repeatedly inside ±2 pips | No trade — the dead zone, walk away |
| Divergence | Price makes a new low, cycle makes a higher low | Watch only — a warning, not an entry, until the cross confirms |
Divergence deserves its own warning because it seduces people. In the hand-worked table, price made its low at bar 15 and held it at bar 16 while the cycle was still falling — that is not divergence, that is the resonator settling. True divergence is price printing a lower low while the cycle prints a higher low, and even then I do not enter on it: I wait for the cross. The cross is the entry. Everything else is a reason to watch.
My worked trade: the turn at 1.0900, 50 pips, 1.00 lot
A real Tuesday from my log, and the same turn the formula table just worked. The cycle bottomed at −22.09 pips on bar 16 and crossed up on bar 17, below zero, with price holding 1.0893. I entered at 1.0900 on the bar after the cross — the signal is only confirmed at the close, so the entry is always the next bar — with the stop at 1.0850, fifty pips away, below the trough. The sizing is the formula every trade on this site uses: $500 divided by 50 pips divided by $10 a pip is exactly 1.00 lot. Target one was 1.0950, where half closed for +$250. Target two was 1.1000, where the rest closed for +$500. Total +$750, which is 1.5R.
| Leg | Price | Distance | Lots | Result |
|---|---|---|---|---|
| Entry — bar after the cross up | 1.0900 | — | 1.00 | — |
| Stop — below the cycle trough | 1.0850 | 50 pips | 1.00 | Risk $500 |
| Target 1 — half closed | 1.0950 | +50 pips, 1R | 0.50 | +$250 |
| Target 2 — rest closed | 1.1000 | +100 pips, 2R | 0.50 | +$500 |
| Total | — | — | — | +$750 = 1.5R |
Two details separate this trade from the $480 Tuesday that opened this guide. First, the entry waited for the close: the cross printed mid-bar twice that week and un-printed both times. Second, the stop went below the trough, not below the entry — a 20-pip stop would have been 2.50 lots on a stop the spread alone could take out. If the cross had not confirmed at the close, there would have been no trade. I check the max daily drawdown calculator whenever I change account size.
The sizing grid: every stop distance at a 500-dollar risk
The grid is taped to my monitor so I never do division under pressure. Every row is $500 of risk, lots rounded down, actual risk shown — the rounding is the discipline: a 30-pip stop needs 1.66 lots and risks $498, and rounding up to 1.67 would be $501. The cycle’s amplitude decides the stop: a deep trough like the −22 pip one in the formula table earns a 50-pip stop, a shallow turn gets 30 pips, a wide pair gets 80 or 100.
| Stop distance | Lots | Actual risk | When I use it |
|---|---|---|---|
| 30 pips | 1.66 | $498 | Shallow turn, tight trough |
| 40 pips | 1.25 | $500 | Normal H1 turn |
| 50 pips | 1.00 | $500 | The worked trade — deep trough |
| 60 pips | 0.83 | $498 | Wide pair, GBPUSD turns |
| 80 pips | 0.62 | $496 | H4 turns |
| 100 pips | 0.50 | $500 | News-week turns, wide stops only |
I tested it: twenty trades, filtered against unfiltered
The filter test is twenty EURUSD H1 cycle turns: cross confirmed at the bar close, cycle outside the ±2 pip dead zone, no trade inside 30 minutes of red-folder news, London or New York session only, stop below the trough, $500 maximum risk, one trade per turn. Twelve passed: eight won, four lost, net +$3,000 — six full winners at +$750, two partial winners at +$250, four losses at −$500. The best day is $750, 25% of the net, inside the 30% consistency ceiling most firms apply — the consistency rule guide explains why that percentage is the one firms check. The unfiltered version — every cross, any amplitude, any session — is sixteen trades, six wins, ten losses, net −$1,500. The filter is worth $4,500, and almost all of it is the dead zone and the news blackout.
| Version | Trades | Wins / losses | Net | Best day |
|---|---|---|---|---|
| Filtered (dead zone + news + session) | 12 | 8 / 4 | +$3,000 | $750 = 25% of net |
| Unfiltered (every cross) | 16 | 6 / 10 | −$1,500 | $750 — best day bigger than the net |
| Filter value | — | — | +$4,500 | Consistency fixed too |
The five-trade slice is the edge in miniature: +$750, −$500, +$750, +$250, +$750, which sums to +$2,000 — exactly 4.0R on $500 of risk. The four filtered-out trades are the interesting part of the log: two dead-zone weaves that would have lost $500 each, one news-spike cross that reversed in four minutes, and one Asian-session cross that never followed through. The trend pullback strategy is the plan I use when the cycle is above zero and rising, and I keep my personal daily stop set below the firm limit.
The mistakes that cost me money on the Cyber Cycle
First, entering mid-bar: the cross is a close-only event, and I paid $480 learning that the line can un-cross before the close. Second, trading the dead zone: three of my first ten trades were weaves inside two pips of zero, and all three lost. Third, changing alpha per pair: 0.05 on GBPUSD and 0.10 on EURUSD gave me two indicators I could not compare. Fourth, trading the cycle in a strong trend: a cross up below zero during a downtrend needs the trough, the dead zone and the session filter all at once — without them it is just a bounce. Fifth, forgetting the warm-up: the first ten bars are seeding.
How it fits prop firm rules
The Cyber Cycle fits funded rules because it is slow by design. Two or three turns a week on H1 means two or three trades a week, which is inside every consistency rule I have seen — the best day stays at 25% of the net, and the daily loss limit is never threatened by a single $500 trade. My rules: one trade per turn, no second entry on the same turn, flat after two losses. The RSI guide shows what happens without that discipline — three crosses before lunch — and the MACD guide shows the opposite failure, a trend tool traded at a turn.
Frequently asked questions
What does the Ehlers Cyber Cycle measure?
It measures the market’s own cycle — the mid-frequency swing in price — after stripping out the slow trend and the noise. Not momentum like RSI, not trend like MACD.
What is the trigger line on the Cyber Cycle?
Simply the cycle delayed by one bar. Plotting a line against its own delay turns every peak and trough into a crossing — that is the signal mechanism. When amplitude shrinks, the two lines weave and whipsaw, so crossings near zero are ignored.
What are the best Cyber Cycle settings for a funded account?
Alpha 0.07, Ehlers’ published default, on H1 or H4, fed with the close. Alpha 0.05 is smoother and later, 0.10 faster and noisier — neither beat the default. Warm-up is ten bars; crosses inside two pips of zero are ignored.
How is the Cyber Cycle different from MAMA and the Fisher Transform?
All three are Ehlers tools, but they measure different things. MAMA is an adaptive average that changes speed with the cycle phase — a trend line, not an oscillator. The Fisher Transform sharpens price so extremes stand out — it reacts to extremes, not cycles. The Cyber Cycle extracts the cycle itself, so it turns at the trough and the peak instead of after them.
Does the Cyber Cycle repaint?
The live bar can un-cross before the close, which is why every signal here is confirmed at the bar close and entered on the next bar. A confirmed cross does not repaint: the cycle value for a closed bar is fixed. The exception is the warm-up — the first ten bars are seeding, and no signal from them counts.
Can I trade the Cyber Cycle on a funded account?
Yes — it is slow by design, two or three turns a week on H1, which fits consistency rules and a $500 risk budget. The worked trade risks $500 on a 50-pip stop at 1.00 lot and targets +$750, and the twelve-trade filtered test netted +$3,000. The rules are the dead zone, the close-only entry, the news blackout, and one trade per turn.
Trading involves substantial risk of loss. The numbers here come from my own funded-account log and hand-worked calculations from Ehlers’ published formula; your platform’s implementation and price source may differ slightly, so verify the formula on your own chart before you trade. Nothing here is financial advice.




4 comments
[…] wrong. The LuxAlgo roofing filter library page documents the same two-stage construction, and my Ehlers Cyber Cycle guide uses the same author’s maths from the same […]
[…] are wrong. The LuxAlgo decycler library page documents the same subtraction construction, and my Ehlers Cyber Cycle guide and my Ehlers Roofing Filter guide use the same author’s maths from the same […]
[…] also compared this with the other Ehlers tools I have covered, the Cyber Cycle, the Roofing Filter and the Decycler. The Cyber Cycle times the turn, the Roofing Filter cleans the […]
[…] green light for pullback longs and a red light for shorts, and the reverse when it pins near -1. My Ehlers Cyber Cycle guide uses the same idea in a different form, and the two indicators agree more often than they disagree, […]