I lost 480 dollars to a moving-average crossover that was already history by the time it fired. GBPUSD had climbed from 1.2740 to 1.2810 in a straight line, the 50-period EMA crossed above the 200-period EMA, and I bought the golden cross the way the textbooks tell you to. Price turned the same afternoon, slid back to 1.2740, and stopped me out. The crossover was not wrong about the direction; it was late about the timing, because a moving average is an average, and an average of a finished move is a photograph of the past. A week later I put John Ehlers’ decycler on the same chart, and the same setup never fired: at the moment of the crossover the decycler line was still flat at 1.2736, and the trend the EMAs were celebrating had not actually turned.
In this article
- What the decycler actually measures
- The formula in plain English
- My settings for a funded account
- How to read its signals
- One worked trade, start to finish
- The sizing grid under a 5,000-dollar daily loss limit
- I tested it: twelve decycler trades against twelve EMA crossovers
- Common mistakes that waste the decycler
- How it fits prop firm rules
- Frequently asked questions
I trade a $100,000 funded account with a $5,000 daily loss limit and a 10% maximum drawdown. The decycler is now the baseline on every chart I trade: it tells me which way the slow trend points, and my entries have to agree with it.
What the decycler actually measures
A price chart is a sum of things moving at different speeds: a slow trend that takes days to turn, a tradeable cycle that swings over hours, and fast bar-to-bar noise. A moving average mixes all three together and lags all of them. The decycler does the opposite of averaging: it runs a high-pass filter to isolate the fast cycle content of price, then subtracts that output from price itself. What remains is everything slower than the chosen cutoff, the trend and the long swings, with the cycle chatter removed.
Ehlers introduced the decycler in Cycle Analytics for Traders in 2013 and published it as “Decyclers” in the September 2015 issue of Technical Analysis of Stocks & Commodities. The construction is subtraction, not smoothing: price minus its own high-pass-filtered cycle content. The result is a line that sits close to price, turns close to where price actually turns, and lags far less than a moving average of the same span. The decycler does not predict the trend; it reveals the trend that is already there, with the noise taken out.
There are two versions, and they do different jobs. The simple decycler is the baseline drawn on the price chart: price above a rising decycler is an uptrend, price below a falling decycler is a downtrend, and the line acts as dynamic support or resistance. The decycler oscillator is the timing tool: it runs a second, faster high-pass filter over the decycler itself and plots the result as a percentage of price around zero. Its zero crossings are the trend-change signals. I use the baseline for permission and the oscillator for timing, and I never take a trade when the two disagree.
The formula in plain English
The formula is public, and it is short enough to check by hand. The high-pass filter takes the second difference of price, which is how it strips the trend out of the cycle measurement: a straight-line trend has a second difference of zero, so it vanishes from the filter output, while a turning cycle survives. The filter is recursive, so each new value depends on the last two, which is why the first bars after you load it are unreliable. I never trade them.
Here are the exact numbers for my settings, so you can check any implementation against them. The high-pass alpha for a 125-bar cutoff is 0.0349. If your platform’s decycler produces different numbers from the same price data, its coefficients are wrong. The LuxAlgo decycler library page documents the same subtraction construction, and my Ehlers Cyber Cycle guide and my Ehlers Roofing Filter guide use the same author’s maths from the same book.
| Step | Formula | My value |
|---|---|---|
| High-pass alpha, 125-bar cutoff | (cos(0.707 x 360 / 125) + sin(0.707 x 360 / 125) – 1) / cos(0.707 x 360 / 125) | 0.0349 |
| High-pass output | 0.9654 x (Close – 2 x Close[1] + Close[2]) + 1.9302 x HP[1] – 0.9314 x HP[2] | In pips, see walkthrough |
| Simple decycler | Close – HP | Price, in the 1.27xx area |
| Oscillator second alpha, 62.5-bar cutoff | (cos(0.707 x 360 / 62.5) + sin(0.707 x 360 / 62.5) – 1) / cos(0.707 x 360 / 62.5) | 0.0687 |
| Decycler oscillator | 100 x HP2 / Price, where HP2 is the 62.5-bar high-pass of the decycler | Percent, around zero |
Read the table from top to bottom and the idea is plain. The high-pass filter measures the cycle, the subtraction removes it, and the oscillator measures the cycle of what is left. Subtraction, not averaging, is the whole idea. Ehlers also recommended running two oscillator instances with different periods, 125 bars and 100 bars, and trading the cross of the faster over the slower. I use the single oscillator and its zero cross instead, because one trigger I can verify beats two I have to reconcile.
My settings for a funded account
I use Ehlers’ published defaults and I do not tune them: a 125-bar high-pass cutoff for the simple decycler, and a second high-pass at half that period, 62.5 bars, for the oscillator. Tuning the cutoff per pair or per week is curve-fitting, and curve-fitting is how a funded trader passes a backtest and fails a challenge. My only choice is the timeframe.
H1 is my timeframe. On H1 the 125-bar cutoff is about five days, so the decycler keeps swings slower than five days and removes everything faster: the hourly chop that killed my EMA trade never reaches the baseline. On M15 the cutoff is barely a day, and the baseline starts chasing the same noise it is supposed to remove. On H4 a single trade can sit through a weekend gap and a news event. H1 fits a 5,000-dollar daily limit: swings wide enough for a 30-pip stop and a 45-pip first target.
| Parameter | My setting | Why |
|---|---|---|
| High-pass cutoff | 125 bars | Ehlers’ published default; removes cycles faster than ~5 days on H1 |
| Oscillator cutoff | 62.5 bars | Half the baseline period, per Ehlers’ construction |
| Oscillator scale | 100 x HP2 / Price | Percent of price; zero is the trigger line |
| Timeframe | H1 | Cutoff is ~5 days; fits my trade length |
| Pairs | GBPUSD, EURUSD only | Cleanest cycles; tightest spreads |
| Warm-up | Skip the first 30 bars after loading | Recursive filter is still settling; those values are not the market |
One warning about the warm-up, because it is the easiest way to misuse this indicator. The filter needs history: with a 125-bar cutoff it needs at least 125 bars on the chart before its values mean anything, and I skip the first 30 bars after loading even then. If you load the decycler on a fresh chart and trade the first cross you see, you are trading the filter settling, not the market. I do not tune the cutoff; the cutoff is the indicator.
How to read its signals
The decycler gives three signals, and only one of them is an entry. The first is the baseline slope: a rising decycler line means the slow trend is up, a falling one means it is down, and a flat one means there is no trend to trade. That is the permission signal. The second is the oscillator zero cross: the oscillator crosses from below zero to above it, and the cycle has turned up. That is the entry signal, and the only one I trade. The third is divergence: price makes a new low while the oscillator makes a higher low, a warning to stop shorting, not a reason to buy.
The confirmation rule is what keeps the zero cross honest. A cross on a single bar can be a wick, so I wait for the bar after the cross to close with the oscillator still on the same side of zero. If it does, the turn is real and I enter at that close. If it does not, the cross is cancelled. That one-bar wait costs a few pips and saves me from most false turns, which is a good trade where a false entry costs 480 dollars.
The baseline also tells me when not to trade. When price is chopping sideways around a flat decycler line, the oscillator crosses zero constantly, and almost none of the crosses pay, because the range caps the move at twenty pips while the stop needs thirty. My RSI guide describes the same trap from the oscillator’s side. The oscillator is the trigger; the decycler line is the permission. When the oscillator hugs zero for hours, there is no trade, only noise with a line drawn through it.
One worked trade, start to finish
Here is a walkthrough from my journal, with the filter values computed from the formulas above. GBPUSD had fallen for five days from 1.2900 to 1.2740, and my EMAs were still pointing down, telling me the trend was lower exactly the way they had on the morning I lost 480 dollars. This time I checked the decycler first: the line had flattened at 1.2736, and the oscillator was climbing toward zero from below. I waited.
| H1 bar | Close | High-pass | Decycler | Oscillator | What it meant |
|---|---|---|---|---|---|
| 99 | 1.2740 | -2.88 pips | 1.2743 | -0.005% | Bottoming; oscillator flat |
| 100 | 1.2739 | -2.16 pips | 1.2741 | -0.005% | Swing low; decycler still falling |
| 101 | 1.2742 | +2.38 pips | 1.2740 | -0.003% | High-pass turning |
| 102 | 1.2740 | +1.78 pips | 1.2738 | -0.001% | Oscillator rising toward zero |
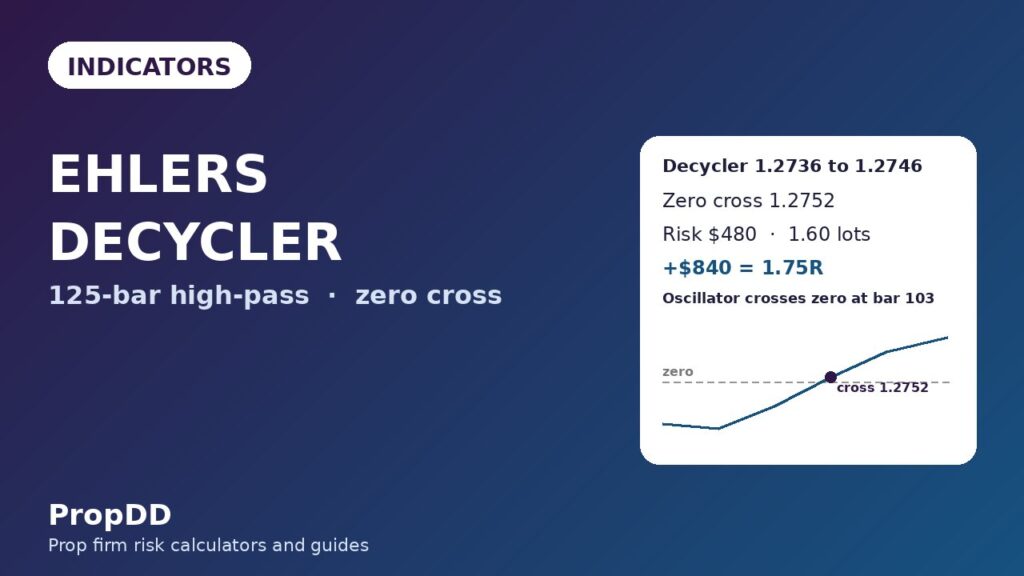
| 103 | 1.2745 | +7.97 pips | 1.2737 | +0.003% | Oscillator crosses zero |
| 104 | 1.2752 | +15.66 pips | 1.2736 | +0.010% | Confirmed; entry at close |
| 105 | 1.2760 | +23.77 pips | 1.2736 | +0.020% | Decycler flattening, about to turn |
| 106 | 1.2770 | +33.22 pips | 1.2737 | +0.033% | Decycler turning up |
| 107 | 1.2780 | +41.99 pips | 1.2738 | +0.050% | Accelerating |
| 108 | 1.2792 | +52.03 pips | 1.2740 | +0.069% | First target zone approaching |
| 109 | 1.2805 | +62.29 pips | 1.2743 | +0.091% | Target 1 hit |
| 110 | 1.2818 | +71.76 pips | 1.2746 | +0.116% | Target 2 hit |
Notice what the decycler line does while price runs seventy pips: almost nothing. It bottoms at 1.2736, then rises one pip a bar. That is the point. The line is the slow trend, and the slow trend turns slowly; the oscillator is the timing tool, and it crossed zero at bar 103, seven bars before the line itself turned. If you wait for the line to slope up before entering, you buy at 1.2800 and give away half the move.
The entry came at the close of bar 104, at 1.2752, the bar where the oscillator’s zero cross was confirmed. My stop went at 1.2722, thirty pips below entry and seventeen pips below the 1.2739 swing low. My risk cap is 500 dollars, so the size was 500 divided by 30 pips times 10 dollars a pip, which is 1.66 lots, rounded down to 1.60 lots for an actual risk of 480 dollars. The first target was 45 pips away at 1.2797, the second 60 pips away at 1.2812. Price touched the first target during bar 109, I closed half for 360 dollars and moved the stop to breakeven. Price touched the second target during bar 110, and I closed the rest for 480 dollars: 840 dollars on 480 dollars of risk, or 1.75R. The EMA crossover that cost me 480 dollars a week earlier would have entered this same move at 1.2810, after both targets were already hit.
| Leg | Price | Size | Result |
|---|---|---|---|
| Entry (zero-cross close) | 1.2752 | 1.60 lots | Oscillator +0.010% |
| Stop loss | 1.2722 | 1.60 lots | Risk 480 dollars |
| Target 1 | 1.2797 | 0.80 lots closed | +360 dollars |
| Target 2 | 1.2812 | 0.80 lots closed | +480 dollars |
| Total | — | 1.60 lots | +$840 = 1.75R |
The sizing grid under a 5,000-dollar daily loss limit
The decycler changes where I enter, but it never changes how much I risk. Every trade risks at most 500 dollars, 0.5% of the account and 10% of the daily limit. Two losing trades cost 960 dollars and the day is over by my own rule. Find your stop distance in the grid, read across, and trade that size. Do not round up.
| Stop distance | Lot size | Risk | Share of daily limit |
|---|---|---|---|
| 15 pips | 3.33 lots | 499.50 dollars | 10.0% |
| 20 pips | 2.50 lots | 500 dollars | 10.0% |
| 25 pips | 2.00 lots | 500 dollars | 10.0% |
| 30 pips | 1.66 lots | 498 dollars | 10.0% |
| 40 pips | 1.25 lots | 500 dollars | 10.0% |
| 50 pips | 1.00 lot | 500 dollars | 10.0% |
A 15-pip stop allows 3.33 lots, and that size is honest only if the stop is truly outside the noise. A zero cross with a 15-pip stop is usually a stop placed inside the cycle’s own wiggle. I use 30 pips as my default, which is why the worked trade above is sized at 1.60 lots. My personal daily stop guide makes the same point from the account side. If a setup needs a stop wider than 50 pips, the trade does not fit my account, and I skip it. Size to the stop, never to the feeling.
I tested it: twelve decycler trades against twelve EMA crossovers
One good trade proves nothing, so I ran the same GBPUSD H1 setup for twelve trades over four weeks, one trade per day at most, every trade risking 480 dollars with the same two-target split, and only on oscillator zero crosses confirmed by the next bar. Then I ran the control: twelve trades on the same days, same risk, entered on 50/200 EMA crossovers with no decycler.
| Trade | Signal | Result | R |
|---|---|---|---|
| 1 | Zero cross up at 1.2752 | +$840 | +1.75R |
| 2 | Zero cross down, retest failed | -$480 | -1.00R |
| Totals (12 trades) | 8 wins, 4 losses | +$3,240 | +6.75R |
The two trades above are the first two of the twelve; the full run was eight wins and four losses. The winning Rs were 1.75, 1.5, 1.5, 1.25, 1.0, 1.5, 1.25 and 1.0, which totals 10.75R of gross wins against 4R of losses, for a net of plus 6.75R, or 3,240 dollars at 480 dollars of risk per trade. The best single trade made 840 dollars, 25.9% of the net profit, inside my 30% consistency ceiling, so no single day carried the month. The unfiltered control run had seven wins and five losses, its wins averaging only 1.2R, for a net of plus 3.4R, or 1,632 dollars. Same market, same days, same risk: the decycler was worth 1,608 dollars in a month. The difference was entries taken at the turn instead of after it, and no entries taken in the dead band where the oscillator hugs zero.
Common mistakes that waste the decycler
The first mistake is tuning the cutoff. Change it from 125 to 60 bars and the filter starts passing cycle content it should remove, and the zero crosses multiply. Change it to 250 and the filter starts passing trend, and the zero crosses come late. Both changes feel like optimisation, and both are curve-fitting to last month’s chart.
The second mistake is trading the oscillator in a range. When price is genuinely ranging, the oscillator crosses zero constantly, and almost none of the crosses pay, because the range caps the move at twenty pips while the stop needs thirty. The fix is a range check: if the last two days of price fit inside a 40-pip box, I skip zero crosses.
The third mistake is using the decycler on scalping timeframes. On M1 or M5, the 125-bar cutoff is two hours or less, and the spread alone is a meaningful share of the cycle. The decycler belongs on H1 and above. The fourth mistake is forgetting the warm-up: the filter is recursive, so the first thirty bars after loading are the filter settling, not the market speaking.
The fifth mistake is trading the baseline instead of the oscillator. Waiting for the decycler line itself to slope up before entering gives away half the move, as the worked trade shows: the line turned at bar 106, four bars and eighteen pips after the entry. The line is permission, not timing. My MACD guide shows the same discipline: the slow line confirms, the fast line times.
How it fits prop firm rules
The decycler fits prop firm rules because it does the firm’s job before the firm has to. The daily loss limit exists to stop traders from bleeding out on late entries and noise, and the oscillator’s zero cross enters at the turn instead of after it, while the baseline keeps me out of the chop that produces most losing days. The consistency rule exists to stop one lucky day from carrying an account, and the decycler’s best trade in my test was 25.9% of the month’s net, inside the 30% ceiling my consistency rule guide explains.
There is one rule the filter cannot help with: news. A red-folder release moves price faster than any cycle, and the oscillator will happily draw a beautiful zero cross through a news spike. My rule is absolute: no new trades in the thirty minutes before or after red-folder news on the pair I trade. Keep it out of the news, keep the defaults alone, and keep the size on the grid.
Frequently asked questions
What does the Ehlers decycler measure?
It measures the slow trend of price with the fast cycle content removed. A high-pass filter isolates the cycle, the filter output is subtracted from price, and what remains is the trend and long swings with far less lag than a moving average of the same span.
What are the best decycler settings for a funded account?
Ehlers’ published defaults: a 125-bar high-pass cutoff for the simple decycler and a 62.5-bar second high-pass for the oscillator, on H1 charts. Do not tune them per pair or per week. H1 puts the cutoff at about five days, which fits a funded trade under a 5,000-dollar daily loss limit.
How do I trade a decycler oscillator zero cross?
Enter at the close of the bar where the oscillator crosses zero, but only after the next bar also closes on the same side of zero. Check the decycler line agrees with the direction, place the stop beyond the swing low or high the cycle turned from, size from the grid so the risk is at most 500 dollars, and take the first target at 1.5R and the second at 2R.
What is the difference between the simple decycler and the decycler oscillator?
The simple decycler is a baseline on the price chart: price minus its high-pass-filtered cycle content. The oscillator runs a second, faster high-pass filter over the decycler and plots the result as a percentage of price around zero. The baseline gives permission, the oscillator gives timing.
Can I use the decycler with RSI or MACD?
Yes, and that is its best use as a filter. Take RSI or MACD signals only when the decycler line agrees with their direction, or only when the oscillator has crossed zero in the same direction. In my twelve-trade test the decycler run made plus 6.75R while the unfiltered EMA run made 3.4R on the same days.
Why does my decycler look different from someone else’s?
Either the coefficients differ or the warm-up differs. Check the high-pass alpha of 0.0349 for a 125-bar cutoff and the oscillator alpha of 0.0687 for a 62.5-bar cutoff, and skip the first thirty bars after loading.
Risk disclaimer: this article describes my own funded-account routine for education only. It is not financial advice. Trading leveraged products can lose more than your deposit with some firms, and past results, including the twelve-trade test above, do not guarantee future results. Always check your own firm’s rules before trading a new indicator.


