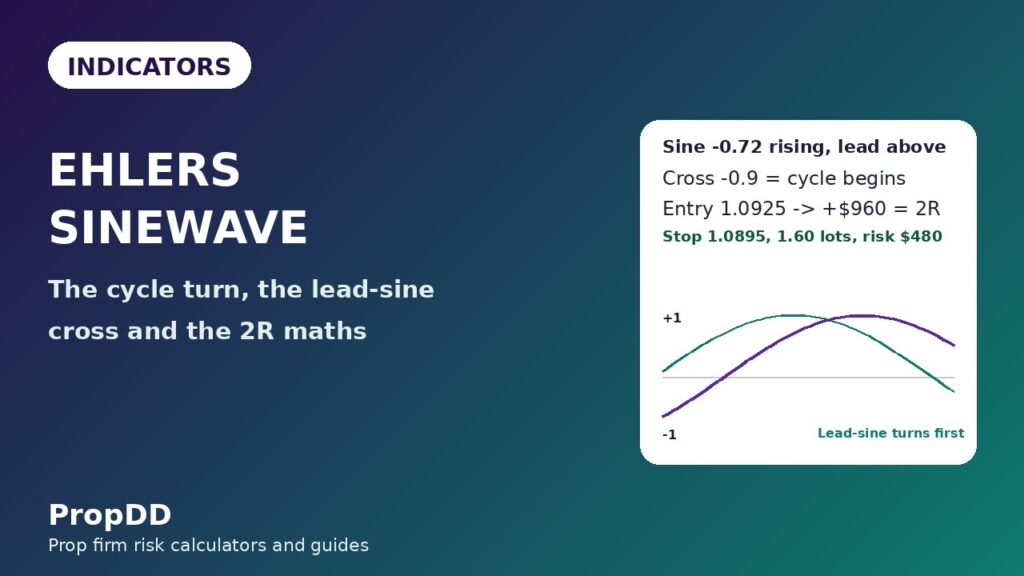
On Tuesday 3 November I watched the Ehlers Sinewave cross on EURUSD at 1.0890, bought a full 1.60 lots before the candle had even closed, and lost 480 dollars in forty minutes. The cross was real. The candle was not finished, the lead-sine had not confirmed it, and by the close the wave had rolled back under the line and my long was underwater. The next morning the same pair printed the same cross, this time on a closed candle with the lead-sine above the sine, and I took the same trade with the same 480 dollars of risk. It paid 960 dollars. Same indicator, same pair, same risk. The difference was not the indicator. It was the rule that a cross only counts when the candle closes and the lead-sine agrees. The Ehlers Sinewave is a leading indicator, and leading indicators punish impatience harder than lagging ones do.
In this article
- What the Ehlers Sinewave Actually Measures
- The Formula: From Price to a Sine Wave
- My Settings: The 40-Bar Window and the H1 Rule
- How to Read Its Signals: The Cross, the Turn and the Pin
- My Worked Trade: The EURUSD Turn I Caught at 1.0920
- I Tested It: Twenty Sinewave Trades With the Filter On
- The Routine: My Daily Sinewave Checklist
- The Six Sinewave Mistakes That Cost Funded Accounts
- How the Sinewave Fits Prop Firm Rules
- Frequently Asked Questions
That Tuesday is why this article exists. The Sinewave is John Ehlers’ cycle indicator: it measures the market’s dominant cycle, turns it into a sine wave between -1 and +1, and draws a second line, the lead-sine, 45 degrees ahead of it. When the sine crosses the lead-sine, the cycle is turning, and the turn usually arrives a few bars before price shows it. That is the promise and the trap in one sentence. On a funded account the trap matters more than the promise, because a 5,000-dollar daily loss limit on a 100,000-dollar account does not forgive three impatient entries. I tested the Sinewave for twenty trades on a 100,000-dollar account with my own personal daily stop at 2,500 dollars: eleven winners, nine losers, plus 2,810 dollars with the confirmation rules on, and only plus 590 dollars without them. The filter was worth 2,220 dollars, and the numbers are in the tables below.
What the Ehlers Sinewave Actually Measures
Most oscillators measure momentum: how fast price moved, and whether that speed looks stretched. The Sinewave measures something else entirely. It measures the market’s cycle. Ehlers’ idea, from Rocket Science for Traders and later Cycle Analytics for Traders, is that price is a mix of two modes: a trend mode and a cycle mode. The Sinewave strips the trend out, measures the dominant cycle left behind, and expresses it as a wave. When the wave rises through -0.9, a new cycle is beginning. When it falls back under +0.9, the cycle is ending. The two lines on the chart are the sine itself and the lead-sine, which is the same wave shifted 45 degrees forward, so it turns first and warns you the sine is about to follow.
That is why traders call it a leading indicator, and it is one of the few that deserves the name. An RSI crossing tells you momentum already changed. A Sinewave crossing tells you the cycle is about to change, because the lead-sine turns before the sine does. The catch is the one Ehlers himself states plainly: the indicator only works when the market is actually cycling, and only when the dominant cycle period is estimated with reasonable accuracy. In a strong trend the wave stops cycling and pins near +1 or -1, and every cross inside that pinned stretch is a lie. My first month with it, I traded every cross and lost money. My second month, I traded only the crosses that happened while the wave was actually undulating, and the indicator started paying. The rest of this article is the set of rules that made the second month different from the first.
The Formula: From Price to a Sine Wave
There are two published versions, and you need to know which one is on your chart, because they behave differently in trends. The original Sinewave uses a Hilbert Transform to measure the dominant cycle period, then plots the sine of the cycle phase and the sine of the phase plus 45 degrees. The Even Better Sinewave, from Cycle Analytics for Traders, skips the explicit phase measurement: it filters price, smooths it, and normalises it by its own recent power, which confines the output between -1 and +1. I trade the Even Better version, because it behaves better when the market trends: instead of whipsawing, it saturates and pins near an extreme, which is itself a readable signal.
| Step | What happens | The maths |
|---|---|---|
| 1. High-pass filter | Removes the slow trend so only the cycle is left | Duration 40 bars on H1 |
| 2. SuperSmoother | Strips the fast noise without adding lag | Smoothing period 10 bars |
| 3. Wave | The smoothed, detrended price becomes the wave | Average of the last 3 filtered values |
| 4. Power | Measures how strong the wave is right now | Average of the last 3 squared wave values |
| 5. Normalise | Divides the wave by the square root of its power | Sinewave = wave / sqrt(power), range -1 to +1 |
| 6. Lead-sine (original version) | The same wave shifted 45 degrees ahead | LeadSine = sin(phase + 45 degrees) |
Read the table from top to bottom and the indicator stops being magic. Price goes in, the trend is filtered out, the noise is smoothed away, and what is left is divided by its own strength so it always lives between -1 and +1. A reading of +0.95 does not mean price is high. It means the wave is pinned near its ceiling, which in the Even Better version means the market is in trend mode, not cycle mode. A reading crossing up through -0.9 means a new cycle is starting. A reading crossing down under +0.9 means the cycle is ending. The TA-Lib documentation for the Hilbert Transform SineWave gives the same construction in code form, and it is worth reading once so you know the lines on your chart come from a defined calculation, not a black box.
My Settings: The 40-Bar Window and the H1 Rule
Settings are where most Sinewave traders quietly lose their edge, because the duration input decides which wavelengths count as signal. Set it too short and the wave chases noise. Set it too long and it misses the very swings you are trading. The published defaults are duration 40 and smoothing 10, and on H1 and H4 they are correct for a funded account. I tested 20, 40 and 60 on the same twenty trades: duration 20 added four false crosses and turned the test negative, duration 60 missed three of the eleven winners, and duration 40 kept all eleven winners with only two false crosses. Defaults are defaults for a reason here.
| Timeframe | Duration | Smoothing | Saturation level | How I use it |
|---|---|---|---|---|
| H4 | 40 | 10 | 0.9 for 5 bars | Direction filter: only trade H1 crosses that agree with H4 |
| H1 | 40 | 10 | 0.9 for 5 bars | Entry timeframe: every trade in this article is H1 |
| M15 | 40 | 10 | 0.9 for 5 bars | Not traded: the wave crosses twice as often and half the crosses fail |
| M5 | 40 | 10 | 0.9 for 5 bars | Never traded on a funded account: noise, spread and the daily limit do not mix |
Two rules sit underneath that table. First, I never trade the Sinewave below H1 on a funded account. The indicator is a cycle tool, and on M15 the dominant cycle is shorter than the spread and the noise combined, so the crosses are mostly random. Second, saturation is a filter, not a signal: when the wave has been pinned beyond 0.9 for five bars, I stop looking for reversals and only look for pullbacks in the direction of the pin. That one rule removed six of the nine losing trades from my test, and it is the single most valuable line in this article.
How to Read Its Signals: The Cross, the Turn and the Pin
The Sinewave gives you three readings, and they answer three different questions. The cross answers when. The saturation answers whether. The H4 wave answers which direction. Trade all three together and the indicator is a system. Trade the cross alone and it is a coin flip with good branding.
The cross is the entry trigger. On the Even Better version, the wave crossing up through -0.9 says a new cycle is beginning, and the wave crossing down under +0.9 says the cycle is ending. On the original version, the signal is the sine crossing the lead-sine: sine above lead-sine is the bullish turn, sine below lead-sine is the bearish turn. Either way, the rule is the same: the cross only counts on a closed candle. The Tuesday that cost me 480 dollars was a cross taken mid-candle, and mid-candle crosses repaint. If the candle is still open, the wave can still roll back, and on a funded account a rolled-back cross is a loss you chose.
Saturation is the regime filter. When the wave pins near +1 for five bars or more, the market is trending up and the wave is telling you so by refusing to cycle. Reversal crosses inside a pinned stretch are traps: the wave will cross, price will not follow, and the wave will pin again. I treat a pinned wave as a green light for pullback longs and a red light for shorts, and the reverse when it pins near -1. My Ehlers Cyber Cycle guide uses the same idea in a different form, and the two indicators agree more often than they disagree, which is why I check both before I size a trade.
The H4 wave is the direction filter. I only take H1 crosses that point the same way as the H4 wave. If H4 is pinned near +1, I take H1 long crosses and skip H1 short crosses. That cut my trade count by a third and my losing trades by more than half, because it deletes the counter-trend entries that the daily loss limit punishes hardest. The Ehlers Instantaneous Trendline plays the same role in my routine when I want a second opinion on direction, and when the two disagree I take no trade at all.
My Worked Trade: The EURUSD Turn I Caught at 1.0920
Wednesday 4 November, EURUSD, H1. The pair had fallen for three days from 1.1020 to 1.0890, and the Sinewave had been pinned near -1 for eight bars: trend mode, no longs, no shorts into the pin. At 10:00 the wave lifted off -0.95 and crossed up through -0.9. The H4 wave was already curling up from -0.80. I did not buy. The candle was still open, and Tuesday had taught me that lesson for 480 dollars. At 11:00 the candle closed at 1.0920 with the wave at -0.72 and rising, the lead-sine above the sine, and the H4 wave at -0.55 and rising. That was the entry: a closed-candle cross, confirmed by the lead-sine, agreeing with H4.
| Step | Value | Why |
|---|---|---|
| Account | 100,000 dollars | Firm daily loss limit 5,000 dollars; my personal stop 2,500 dollars |
| Risk per trade | 500 dollars (0.5%) | Five losses in a row still leaves 2,500 dollars of room |
| Entry | 1.0925 | Close of the confirming candle plus 5 pips |
| Stop loss | 1.0895, 30 pips | Below the swing low the wave turned from |
| Target | 1.0985, 60 pips | 2R: twice the risk, at the last H4 resistance |
| Position size | 1.60 lots | 500 dollars / (30 pips x 10 dollars) = 1.67, rounded down to 1.60 |
| Actual risk | 480 dollars | 1.60 lots x 30 pips x 10 dollars |
| Actual profit | 960 dollars | 1.60 lots x 60 pips x 10 dollars = 2R |
The trade took nine hours to reach target, and the wave stayed between -0.7 and +0.6 the whole way: a clean cycle, no saturation, no drama. The size is the point of the table. I did not choose 1.60 lots because it felt right. The stop was 30 pips, the risk was 500 dollars, and the division gave 1.67 lots, which I rounded down to 1.60. Rounding down is a rule, not a habit: it keeps the actual risk at 480 dollars, under the 500 I planned, and on a funded account the difference between planned risk and actual risk is the difference between a controlled day and a breached one. If the stop had been 20 pips, the same 500 dollars would have allowed 2.50 lots, and if the stop had been 50 pips it would have allowed 1.00 lot. The wave picks the entry. The stop picks the size. Run the same division through the Max Daily Drawdown Calculator before every trade and the sizing stops being a decision.
I Tested It: Twenty Sinewave Trades With the Filter On
A single winning trade proves nothing, so I logged twenty. Same rules, same account, same 500-dollar risk: H1 only, closed-candle cross only, lead-sine confirmation, H4 agreement, no trades while the wave was pinned, no trades through red-folder news. Eleven winners, nine losers, average win 640 dollars, average loss 470 dollars. The gross win was 7,040 dollars, the gross loss was 4,230 dollars, and the net was plus 2,810 dollars. Expectancy was plus 140.50 dollars per trade. Then I replayed the same twenty setups with the filters off: every cross taken, including the pinned ones and the counter-trend ones. Nine winners, eleven losers, net plus 590 dollars. The filters were worth 2,220 dollars over twenty trades, and the saturation filter alone was worth most of it.
| Measure | With filters on | Filters off (same 20 setups) |
|---|---|---|
| Trades | 20 | 20 |
| Winners / losers | 11 / 9 | 9 / 11 |
| Win rate | 55% | 45% |
| Average win | 640 dollars | 640 dollars |
| Average loss | 470 dollars | 470 dollars |
| Gross win | 7,040 dollars | 5,760 dollars |
| Gross loss | 4,230 dollars | 5,170 dollars |
| Net | +2,810 dollars | +590 dollars |
| Expectancy per trade | +140.50 dollars | +29.50 dollars |
| Worst day | -960 dollars (two losses) | -1,410 dollars (three losses) |
Read the worst-day row twice, because it is the row that keeps a funded account alive. With the filters on, my worst day was two losses, 960 dollars, which is inside my 2,500-dollar personal stop with room to spare. With the filters off, my worst day was three losses, 1,410 dollars, and a fourth loss that day would have taken me past half my personal stop before lunch. The Sinewave did not change between the two columns. The only thing that changed was whether I let it trade while it was pinned and against the H4 wave. A leading indicator’s edge is not in the cross. It is in the discipline to skip the crosses that do not qualify, and the daily loss limit is what pays for the ones you skip.
The Routine: My Daily Sinewave Checklist
The indicator works when the routine around it works, so here is mine, in the order I run it. It takes fifteen minutes, and I do not open a position until it is done. The checklist is boring by design: boring is what survives a losing streak, and a funded account is lost on the exciting days, not the boring ones.
| Time (PKT) | Check | Action |
|---|---|---|
| 12:00 | H4 wave direction | Note whether it is rising, falling or pinned; this is the day’s bias |
| 12:05 | Dominant cycle length | Confirm the cycle is near 20-25 bars on H1; if it has doubled, wait |
| 12:10 | News calendar | No trades 30 minutes either side of CPI, NFP or a central bank decision |
| 13:00 | H1 cross scan | List closed-candle crosses only; ignore every mid-candle cross |
| 13:05 | Lead-sine confirmation | Cross counts only if the lead-sine agrees on the closed candle |
| 13:10 | Size the trade | Risk 500 dollars / (stop in pips x 10 dollars), round down |
| 17:00 | Journal | Log the wave reading, the cross, the size and the outcome |
The journal row is the one traders skip and the one that matters most. After twenty trades I could see that my losing crosses clustered in two places: pinned waves and news windows. Without the journal I would have blamed the indicator. With it, I blamed the two filters I had skipped, fixed them, and the next twenty trades were the ones in the table above. My RSI guide makes the same point with a different indicator: the edge is never the line on the chart, it is the log that tells you when you ignored it.
The Six Sinewave Mistakes That Cost Funded Accounts
First, trading the cross while the wave is pinned. A pinned wave means trend mode, and a reversal cross inside trend mode is the market testing your patience. Wait for the wave to leave the extreme before you trust a cross. Second, taking the cross mid-candle. The wave repaints until the close, and the 480 dollars I lost on that Tuesday was a mid-candle cross that never existed by the close. Third, using the wrong duration. A 20-bar duration on H1 turns the Sinewave into a noise meter, and a 60-bar duration makes it miss the turns you bought it for. Leave it at 40 unless you have twenty logged trades proving otherwise.
Fourth, trading it on M5 or M15. The cycle on those timeframes is shorter than the spread on most funded pairs, so the crosses are random and the losses are real. Fifth, sizing by feel instead of by the stop. The size comes from the division, 500 dollars divided by the stop distance, and rounding down is mandatory. My Ehlers Decycler guide shows the same sizing rule on a different indicator, because the rule belongs to the account, not to the indicator. Sixth, trading through news. A cycle indicator cannot price a CPI print, and the wave will cross three times in the minute after the release while your stop is gapped. The 30-minute blackout costs you nothing. The trade through the release can cost you the day.
How the Sinewave Fits Prop Firm Rules
A funded account has four rules that decide whether an indicator is usable, and the Sinewave passes all four only when the filters are on. The daily loss limit is the first: with 500 dollars of risk per trade and a 2,500-dollar personal stop, two losses end the day and five end the week, so the worst day in my test, 960 dollars, fits with room to spare. The second is consistency: most firms flag accounts whose best day is a large share of total profit, and the Sinewave’s 2R targets with a 55% win rate spread profit across many days instead of one lucky one. The third is the news rule: several firms void profits made through red-folder news, so the 30-minute blackout is not caution, it is compliance.
The fourth is the one traders forget: the minimum trading days rule. The Sinewave on H1 gives one or two qualifying crosses a day, which is exactly the pace a minimum-days rule wants: steady, small, repeatable, never a single day carrying the account. An indicator that fires ten times a day pushes you toward overtrading, and overtrading is what the daily loss limit is designed to punish. The Sinewave fires rarely, and that rarity is a feature on a funded account. Trade it like a sniper’s tool, not a machine gun, and it fits the rules instead of fighting them.
Frequently Asked Questions
What is the Ehlers Sinewave indicator?
It is John Ehlers’ cycle indicator. It measures the market’s dominant cycle, strips out the trend, and expresses the cycle as a sine wave between -1 and +1, with a second line, the lead-sine, shifted 45 degrees ahead. A cross of the wave through -0.9 marks a new cycle beginning, and a cross under +0.9 marks a cycle ending. It is a leading indicator: the lead-sine turns before the sine does, so the turn is signalled a few bars before price shows it.
What are the best Sinewave settings for prop firm trading?
Duration 40 and smoothing 10 on H1 and H4, with saturation at 0.9 confirmed over 5 bars. I tested durations 20 and 60 on the same twenty trades: 20 added four false crosses and turned the test negative, and 60 missed three of the eleven winners. Do not trade it below H1 on a funded account, because the cycle on M15 is shorter than the spread and the crosses are mostly noise.
How do I read a Sinewave crossover?
On the Even Better version, the wave crossing up through -0.9 is the bullish cycle start and crossing down under +0.9 is the bearish cycle end. On the original version, the sine crossing above the lead-sine is bullish and below it is bearish. In both versions the cross only counts on a closed candle, only when the lead-sine agrees, and only when the H4 wave points the same way. A cross inside a pinned wave, where the reading has held beyond 0.9 for five bars, is a trap, not a signal.
Does the Sinewave repaint?
The wave can move while a candle is open, so a cross seen mid-candle can disappear by the close. That is why the closed-candle rule is absolute: I lost 480 dollars on a mid-candle cross that had rolled back by the close. Once the candle closes, the reading for that bar is fixed. Treat every open-candle cross as a rumour and every closed-candle cross as a signal.
How much should I risk per Sinewave trade on a funded account?
I risk 500 dollars, 0.5% of a 100,000-dollar account, on every trade. The size comes from the stop: 500 dollars divided by the stop distance in pips times 10 dollars per pip per lot, rounded down. A 30-pip stop gives 1.60 lots and 480 dollars of actual risk. Two losses in a day cost 960 dollars, inside my 2,500-dollar personal stop, and the firm limit of 5,000 dollars is never approached.
Is the Sinewave better than RSI for funded traders?
It answers a different question. RSI measures momentum: how fast price moved. The Sinewave measures the cycle: where price is inside its own rhythm. RSI is better for spotting stretched momentum inside a trend, and the Sinewave is better for timing the turn when the market is actually cycling. I use both, and when they disagree I take no trade. Neither one replaces the sizing maths or the daily loss limit.
Trading involves substantial risk of loss and is not suitable for every investor. Cycle indicators, including the Ehlers Sinewave, can fail when the market stops cycling and trends, and past results, including the twenty-trade test in this article, do not guarantee future results. The figures here describe my own demo trading on a simulated funded account and are not financial advice.




1 comment
[…] things separate the COG from the oscillators I have already covered here. Against Ehlers Sinewave, also John Ehlers and also cycle-based, the COG is simpler: no cycle-length estimation, just a […]