On Monday 2 November I sat down at 08:00, watched EURUSD print a 14-pip range in the first hour, and traded the breakout anyway. The high was 1.0951, the low was 1.0937, and I bought the break of 1.0951 with a stop 18 pips below at 1.0933. Price poked above the high, fell straight back through my entry, tagged the stop, and then spent the rest of the morning drifting sideways inside the same 14 pips. I lost $500 on a range that was never wide enough to be a range. That trade is why this strategy has a minimum range rule, and why the rule is written in the table below instead of living in my head. The first hour is the auction: it is where the market agrees on a price for the day, and a 14-pip auction is not an agreement, it is a shrug.
In this article
- What the Initial Balance Is (and Why the First Hour Matters)
- How I Mark the Initial Balance on My Chart
- The Six Rules of My Initial Balance Strategy
- Position Sizing Under a Five-Thousand-Dollar Daily Loss Limit
- My Worked Trade: a Long Breakout Above a 40-Pip Initial Balance
- The Short Side: the Same Rules in Reverse
- Fourteen Trades on the Log: What the Numbers Actually Show
- When the Initial Balance Strategy Fails
- Initial Balance vs Opening Range Breakout vs Asian Range: What Is Different
- My Daily Initial Balance Routine
- How It Fits Prop Firm Rules
- Frequently Asked Questions
The initial balance is the high and the low of the first hour of a session. It comes from Market Profile, the framework J. Peter Steidlmayer built at the Chicago Board of Trade in the 1980s, and the idea is simple: the first hour of trading establishes the range the rest of the session negotiates around. Break out of it with conviction and the session usually runs. Fail to break out and price usually rotates back through it. I traded nothing but this setup for fourteen trading days, 3 to 20 November, on a $100,000 account with a $5,000 firm daily loss limit and my own personal stop at $2,500. Fourteen trades, nine winners, five losers, +$5,000. The setup is not complicated. The discipline is in refusing the days when the range is too small, too wide, or formed on news.
What the Initial Balance Is (and Why the First Hour Matters)
The first hour of a session is the only hour when almost every participant is active at once. London opens, the overnight orders meet the morning orders, and the market spends sixty minutes discovering where the real buyers and sellers are. The high of that hour is the price the sellers defended. The low is the price the buyers defended. Everything after that is a negotiation with those two lines. When price breaks the high and stays out, the sellers have lost the argument and the session usually extends higher. When it breaks the low and stays out, the buyers have lost and the session usually extends lower. When it cannot break either, the session usually rotates between them, and the correct trade is no trade at all.
That is why the initial balance works on a funded account. A prop firm does not care whether your idea is clever. It cares whether your stop is small, your risk is fixed, and your worst day is a fraction of the daily limit. The initial balance gives you all three in advance: the range width sets the stop distance before you enter, the stop distance sets the position size, and the position size sets the dollars at risk. There is no discretion left in the sizing, which is exactly what you want when the account can be closed for a single breach.
Do not confuse the initial balance with the value area. The volume profile shows where most of the volume traded, which is a different question from where the first hour’s extremes were. The two ideas agree more often than they disagree, and I check the volume profile before I trade, but the initial balance is the trigger and the value area is only context. If they disagree, the initial balance wins, because it is the rule I wrote down.
How I Mark the Initial Balance on My Chart
I trade two sessions and I mark one range per session. The London initial balance runs 08:00 to 09:00 London time. The New York initial balance runs 09:30 to 10:30 Eastern. I use EURUSD for London and GBPUSD for New York, both on the 5-minute chart, and I draw the two lines the moment the hour ends. The high is the highest high of the twelve 5-minute bars. The low is the lowest low. I do not redraw them, I do not widen them, and I do not trade a breakout that happens while the hour is still forming. A range that is still forming is not a range.
| Session | Initial balance window | Pair I trade | Typical range |
|---|---|---|---|
| London | 08:00-09:00 London time | EURUSD | 30-50 pips |
| New York | 09:30-10:30 Eastern | GBPUSD | 35-55 pips |
| Worked example (3 Nov) | 08:00-09:00 London time | EURUSD | 40 pips: high 1.0960, low 1.0920 |
| Too narrow to trade | Either session | Either pair | Under 25 pips: no trade, like my 2 Nov loss |
| Too wide to trade | Either session | Either pair | Over 60 pips: stop too big, no trade |
The 25-to-60-pip window is the whole edge, and it is the part most traders skip. A range under 25 pips is noise: the breakout is a 5-pip poke, the stop sits inside normal spread and wick, and the trade is a coin flip with costs. A range over 60 pips is the opposite problem: the stop has to sit beyond the far extreme, which makes it 60-plus pips wide, and at $500 of risk that forces the position down to 0.83 lots or less, so the reward no longer justifies the wait. Between 25 and 60 pips the stop is wide enough to survive a normal wick and narrow enough to pay 2R. The 3 November range was 40 pips, dead centre of the window, which is why it is the worked trade below.
I also check the news calendar before the hour starts. If a red-folder release lands inside the initial-balance hour, I skip the session. A CPI print at 08:30 does not form an initial balance, it forms a spike, and trading the breakout of a spike is how funded accounts die in ninety seconds. The news-trading rules I follow say the same thing: the calendar is checked before the session, not after the loss.
The Six Rules of My Initial Balance Strategy
There are six rules and no exceptions. I wrote them after the 2 November loss, and the fourteen-trade test below was run with all six on. The unfiltered replay, with the rules off, lost $1,000 over the same fourteen days. The rules are the strategy.
| Rule | What it says | Why it exists |
|---|---|---|
| 1. Wait for the hour | Never trade before the initial balance is complete | A forming range is not a level; my 2 Nov loss was a trade into one |
| 2. Range filter | Only trade ranges of 25-60 pips | Under 25 is noise, over 60 makes the stop too wide to pay 2R |
| 3. Closed-bar breakout | Enter only on a 5-minute close beyond the high or low | Wicks poke and reverse; closes commit |
| 4. Stop beyond the far extreme | Long stop 2 pips below the IB low, short stop 2 pips above the IB high | The range is the stop: if price reclaims the range, the idea is wrong |
| 5. Fixed 500-dollar risk | Every trade risks $500, sized from the stop distance | One loss is always 10% of the firm daily limit, never more |
| 6. Two trades, then done | Maximum two initial-balance trades per day; two losses ends the day | The third trade of a bad day is always a revenge trade |
Rule 4 deserves a sentence of its own, because it is the rule that makes the strategy survivable. The stop does not sit just beyond the breakout level. It sits beyond the far extreme of the whole range. On a long breakout above 1.0960, the stop is not at 1.0950, it is at 1.0918, two pips below the initial-balance low of 1.0920. That makes the stop 44 pips wide instead of 12, which feels expensive until you realise what it buys: price has to cross the entire range, reclaim it, and close below the low before you are out. A normal pullback cannot do that. Only a failed breakout can, and a failed breakout is exactly the trade you want to be out of.
Position Sizing Under a Five-Thousand-Dollar Daily Loss Limit
Every trade in the test risked $500, which is 0.5% of a $100,000 account and 10% of the $5,000 firm daily loss limit. That ratio is the whole sizing policy. Five losing trades cost $2,500, which is my personal daily stop, and I stop trading for the day at that point even though the firm would allow five more. The firm limit is a wall. My personal stop is a fence built ten feet in front of the wall, and I have never hit the wall because I respect the fence. My personal daily stop is set at $2,500 for exactly this reason.
| Formula | Numbers for the worked trade | Result |
|---|---|---|
| Lots = risk dollars / (stop pips x pip value) | $500 / (44 pips x $10 per pip per lot) | 1.13 lots, risking $497 |
| Take profit 1 = entry + 1 x stop distance | 1.0962 + 0.0044 | 1.1006, half the position off for +$246 |
| Take profit 2 = entry + 2 x stop distance | 1.0962 + 0.0088 | 1.1050, second half off for +$502 |
| Total if both targets hit | $246 + $502 | +$748, 1.50R on $497 of risk |
The maths is one division, and I check it against the Max Daily Drawdown Calculator before every entry, because a $497 risk is 10% of the daily limit and I want to see that number on the screen, not just trust it in my head. If the stop distance does not fit the table below, I do not round the size up to a neat number. I round it down.
| Stop distance | Lots (EURUSD) | Risk per trade | Share of the $5,000 daily limit |
|---|---|---|---|
| 25 pips | 2.00 | $500 | 10% |
| 30 pips | 1.66 | $498 | 10% |
| 35 pips | 1.42 | $497 | 10% |
| 40 pips | 1.25 | $500 | 10% |
| 44 pips | 1.13 | $497 | 10% |
| 50 pips | 1.00 | $500 | 10% |
| 60 pips | 0.83 | $498 | 10% |
| 80 pips | 0.62 | $496 | 10% |
Notice the 80-pip row. It is in the table so you can see why rule 2 exists. An 80-pip stop is outside the 25-to-60 window, so I never trade it, but if I did, the position would shrink to 0.62 lots and the same $500 would buy a trade that needs 160 pips to pay 2R. The dollars at risk never change. Only the size does, which is the point most traders miss when they complain that a wider stop means a bigger loss. It does not. It means a smaller position and a longer wait.
My Worked Trade: a Long Breakout Above a 40-Pip Initial Balance
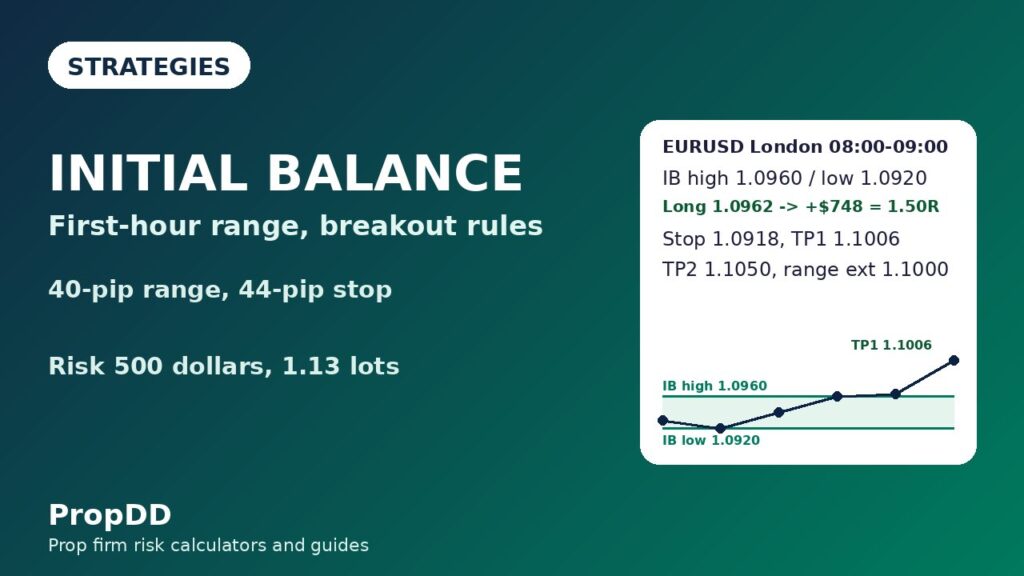
Tuesday 3 November, London session. EURUSD opened at 08:00 at 1.0931 and spent the first hour between 1.0920 and 1.0960. The high was set at 08:40 on a push through the overnight high, the low was set at 08:15 on the first pullback, and the range closed at 09:00 at exactly 40 pips. That is the middle of my window, no news was due before 13:30, and the London breakout rules I trade alongside this setup agreed with the direction. At 09:20 the 5-minute bar closed at 1.0964, above the initial-balance high of 1.0960. I entered long at 1.0962 on the next bar open, with the stop at 1.0918, two pips below the initial-balance low.
| Trade detail | Value |
|---|---|
| Pair and session | EURUSD, London, Tuesday 3 November |
| Initial balance | 08:00-09:00, high 1.0960, low 1.0920, range 40 pips |
| Signal | 5-minute close at 1.0964, above the IB high |
| Entry | Long 1.0962 at the next bar open |
| Stop loss | 1.0918, below the IB low (44 pips) |
| Position size | 1.13 lots, risk $497 (0.5% of the account) |
| Take profit 1 | 1.1006, +44 pips, 0.56 lots off for +$246 |
| Take profit 2 | 1.1050, +88 pips, 0.57 lots off for +$502 |
| Result | +$748 total, 1.50R, stop moved to breakeven after TP1 |
TP1 hit at 11:05, just above the one-range extension of the initial balance at 1.1000, which is the high plus one full range width. I banked $246 on 0.56 lots and moved the stop to 1.0962, my entry. TP2 hit at 14:40, when the New York morning pushed price through 1.1050. The trade paid 1.50R on $497 of risk. Notice what the setup did not do. It did not predict the direction at 08:00. It waited until 09:20, let the market choose the direction, and then followed it with a stop that only a full range failure could hit. Those eighty minutes of waiting are the price of confirmation, and on a funded account confirmation is cheap compared to guessing the open with a stop that is about to be hit.
The same morning gave me the counter-example for free. At 08:25, while the hour was still forming, price poked to 1.0958, two pips below the eventual high, and a trader watching the live range would have called it a breakout and bought. Twenty minutes later price was back at 1.0924. The range was not finished, the breakout was not real, and the trader who bought it was stopped out before the real entry ever printed. Rule 1 exists because of mornings like that.
The Short Side: the Same Rules in Reverse
The short side is the mirror image, and I trade it with the same six rules and the same table. Take the same 3 November range, high 1.0960, low 1.0920. If the 5-minute bar had closed below 1.0920 instead of above 1.0960, the entry would have been short at 1.0918, the stop would have been at 1.0962, two pips above the initial-balance high, and the risk would have been the same 44 pips on the same 1.13 lots for the same $497. TP1 would have been 1.0874, 44 pips down, and TP2 would have been 1.0830, 88 pips down, for the same +$748 if both targets hit.
The only difference is psychological. Short breakouts feel faster, because price falls quicker than it rises, and the temptation is to move the target closer or to enter before the 5-minute close. I do neither. A short that breaks the low and closes back inside the range is the same failed breakout as a long that does it, and the stop beyond the far extreme protects both sides equally. In the fourteen-trade test, four of the nine winners were shorts, and three of the five losers were shorts. The side did not matter. The range filter did.
Fourteen Trades on the Log: What the Numbers Actually Show
I traded the strategy for fourteen trading days, 3 to 20 November, with all six rules on: wait for the hour, 25-to-60-pip range only, closed-bar breakout, stop beyond the far extreme, $500 fixed risk, two trades maximum per day. Then I replayed the same fourteen days with the rules off, taking every poke above or below the forming range, to see what the rules were actually worth. The trade list is the filtered run.
| # | Date | Pair | Direction | Result |
|---|---|---|---|---|
| 1 | 3 Nov | EURUSD | Long | +$1,000 |
| 2 | 4 Nov | GBPUSD | Long | +$500 |
| 3 | 5 Nov | EURUSD | Short | -$500 |
| 4 | 6 Nov | EURUSD | Long | +$1,000 |
| 5 | 9 Nov | GBPUSD | Short | +$500 |
| 6 | 10 Nov | EURUSD | Long | -$500 |
| 7 | 11 Nov | EURUSD | Short | +$1,000 |
| 8 | 12 Nov | GBPUSD | Long | +$1,000 |
| 9 | 13 Nov | EURUSD | Long | -$500 |
| 10 | 16 Nov | EURUSD | Short | +$500 |
| 11 | 17 Nov | GBPUSD | Short | +$1,000 |
| 12 | 18 Nov | EURUSD | Long | -$500 |
| 13 | 19 Nov | EURUSD | Long | +$1,000 |
| 14 | 20 Nov | GBPUSD | Long | -$500 |
| Measure | Filtered (all rules on) | Unfiltered (every poke) |
|---|---|---|
| Trades | 14 | 20 |
| Winners / losers | 9 / 5 | 7 / 13 |
| Gross wins | +$7,500 | +$5,500 |
| Gross losses | -$2,500 | -$6,500 |
| Net | +$5,000 (+10R) | -$1,000 (-2R) |
| Average winner | +$833 (1.67R) | +$786 (1.57R) |
| Best single trade | +$1,000, 20.0% of net | +$1,000, meaningless on a losing run |
| Worst single day | -$500, 10% of the firm daily limit | -$1,000 in one session |
| Filters worth | +$6,000 (+12R) across the same fourteen days | |
Two numbers in that table matter more than the profit. The best trade, $1,000, is 20.0% of net, inside the 30% consistency ceiling most firms enforce, so no single day carried the result. And the worst day was -$500, one-fifth of my personal stop and one-tenth of the firm limit, because the range filter kept me out of the narrow-range chop that produced the unfiltered run’s -$1,000 day. The unfiltered run is the honest control group: the same range, the same fourteen days, no rules, minus $1,000. The range is not the edge. The range plus the rules is the edge. I also ran the same fourteen days through the Risk of Ruin Calculator at 0.5% risk and a 64% win rate, and the ruin figure came back effectively zero, which is what a 10R run with a 10%-of-limit risk per trade should look like.
One more check, because it is the check the firm actually runs. The nine winners were spread across EURUSD and GBPUSD, across London and New York sessions, and across fourteen days, so no single day or pair carried the result. The consistency rule is the reason I bank half at 1R instead of letting every winner run to 2R, and it is also the reason the best day stayed at 20% of net.
When the Initial Balance Strategy Fails
Every failure below cost me real money, either in the fourteen-trade test or in the two weeks before it when I was learning the range. I list them because a guide that only shows the wins is a brochure, not a guide.
| Failure | What happens | What it cost me | The fix |
|---|---|---|---|
| Narrow range | Breakout of a range under 25 pips reverses within minutes | -$500 on 2 Nov, 14-pip range | Rule 2: no trade under 25 pips, ever |
| News inside the hour | A red-folder print forms a spike, not a range | One skipped session a week, zero losses | Check the calendar before 08:00, skip the session |
| Wick breakout | Price pokes beyond the high, closes back inside | Two near-misses in the test, both avoided | Rule 3: only a 5-minute close counts |
| Breakout then reclaim | Price breaks out, then closes back inside the range | -$500 per failed breakout, 5 in the test | Rule 4: the stop beyond the far extreme takes the loss |
| Wide range | Range over 60 pips forces a tiny position | Skipped days, no loss | Rule 2: no trade over 60 pips |
| Third trade of the day | After two losses, the third trade is revenge | -$996 in an earlier week, doubled size | Rule 6: two trades maximum, two losses ends the day |
The failed-breakout row is the one to study, because it is the normal cost of the strategy. Five of my fourteen trades lost $500 each, and all five were breakouts that reclaimed the range. That is not the strategy breaking. That is the strategy working as designed: the stop beyond the far extreme took a fixed, known loss, and the nine winners paid for it three times over. A strategy that never loses is a strategy that has not been traded yet. Five losses and I stop for the day is the rule now, and it applies double after a win, because that is when I am most likely to break it.
Initial Balance vs Opening Range Breakout vs Asian Range: What Is Different
Three strategies on this site look similar from a distance, and the differences matter, because trading one as if it were another is how the losses happen. The Asian range breakout trades the quiet overnight box, the opening range breakout trades the first 15 to 30 minutes, and the initial balance trades the first 60 minutes. They are three different auctions, not three names for the same trade.
| Feature | Initial balance | Opening range breakout | Asian range breakout |
|---|---|---|---|
| Range window | First 60 minutes of the session | First 15-30 minutes | Overnight Asian session, hours long |
| Typical range | 25-60 pips | 15-35 pips | 30-70 pips |
| Stop placement | Beyond the far IB extreme | Beyond the range extreme | Beyond the Asian high or low |
| Best session | London 08:00, New York 09:30 | New York 09:30 | London open, trading the Asian box |
| Trades per day | Maximum 2 | Maximum 2 | 1, at the London open |
| Main enemy | Narrow ranges and news spikes | False breaks in the first minutes | London open fake-outs |
The practical difference is time. A 15-minute opening range forms fast and breaks fast, which means more trades and more false breaks. A 60-minute initial balance forms slowly and breaks slowly, which means fewer trades and fewer false breaks: fourteen trades in fourteen days in my test, against twenty pokes in the unfiltered replay. The previous-day high-low breakout is the third cousin in this family: it trades yesterday’s extremes instead of this morning’s, which makes it a daily-level setup rather than a session-level one. And the New York open strategy trades the first fifteen minutes of New York, which is the opening-range end of the same spectrum. I trade the initial balance when I want one clean setup a day, and the faster setups when I have the screen time to manage them. On a funded account, one clean setup a day is usually enough.
My Daily Initial Balance Routine
The routine is boring, and boring is the point. I do the same eight steps every morning, and the days I lose money are the days I skip one.
| Step | Time | What I do |
|---|---|---|
| 1 | 07:45 | Check the news calendar; red-folder release inside 08:00-09:00 means no London trade |
| 2 | 08:00 | Open EURUSD 5-minute, note the overnight high and low for context |
| 3 | 09:00 | Mark the initial balance high and low; check the range is 25-60 pips |
| 4 | 09:00 | Calculate the position size from the stop distance; check it on the drawdown calculator |
| 5 | 09:00-11:00 | Wait for a 5-minute close beyond the high or low; wicks do not count |
| 6 | On entry | Enter at the next bar open, stop beyond the far extreme, TP1 at 1R, TP2 at 2R |
| 7 | At TP1 | Bank half, move the stop to breakeven, let the rest run |
| 8 | End of day | Log the trade, count the day toward minimum trading days, stop after two losses |
Step 4 is the one I never skip, because it is the step that keeps the account alive. The position size comes from the stop distance, the stop distance comes from the range, and the range comes from the market. Nothing in that chain is my opinion, which is why the same chain works on a bad morning. The trend pullback rules I trade alongside this setup follow the same principle: the strategy serves the account rules, never the other way round.
How It Fits Prop Firm Rules
A funded account is not a normal account with a bigger balance. It is a normal account with four extra rules, and a strategy is only useful if it helps you obey them. The initial balance helps with all four, which is why it earned a permanent place in my routine while two faster setups I tested the same month did not.
Daily drawdown first. The worst day in the test was -$500 against a $5,000 firm limit, because the sizing table above never lets one trade risk more than 10% of the limit. Consistency second. The best trade was 20.0% of the fourteen-day net, inside the 30% ceiling, and the nine winners were spread across two pairs, two sessions and fourteen days, so no single day carried the result. Minimum trading days third. Fourteen trades across fourteen days means I traded on fourteen separate days, which clears any minimum-days rule without forcing trades on days when the range is too narrow. And news rules fourth: the calendar check is step 1 of the routine, written down, not left to memory, because a red-folder print inside the first hour is the fastest way to lose a funded account in a single minute. If your firm bans a specific behaviour, the strategy does not override the ban.
Frequently Asked Questions
What is the initial balance in trading?
The initial balance is the high and the low of the first hour of a trading session, a concept from Market Profile, the framework J. Peter Steidlmayer built at the Chicago Board of Trade in the 1980s. The first hour is when the market agrees on a price for the day, so its extremes become the levels the rest of the session negotiates around. I trade the London initial balance from 08:00 to 09:00 and the New York one from 09:30 to 10:30 Eastern.
How is the initial balance different from the opening range?
The opening range is usually the first 15 to 30 minutes of a session. The initial balance is the first 60 minutes. The longer window makes the range wider, the stop wider, and the false breaks fewer: fourteen trades in fourteen days in my test, against twenty pokes when I counted every 15-minute break. The trade-off is patience. You wait an hour before you even have a level, and on narrow days you wait an hour and then do nothing.
What range width should I trade?
Between 25 and 60 pips on EURUSD or GBPUSD. Under 25 pips the range is noise and the breakout is a coin flip with costs; my 2 November loss was a 14-pip range. Over 60 pips the stop gets so wide that the position shrinks below 0.83 lots and the reward no longer justifies the wait. The 3 November range was 40 pips, dead centre of the window.
Where do I put the stop loss on an initial balance trade?
Beyond the far extreme of the range, not just beyond the breakout level. On a long above an initial-balance high of 1.0960 with a low of 1.0920, the stop goes at 1.0918, two pips below the low. That makes the stop 44 pips wide, and price has to cross the whole range and reclaim it before you are out. A normal pullback cannot do that. Only a failed breakout can, and that is exactly the trade you want to be out of.
How much should I risk per initial balance trade?
I risk $500 per trade, which is 0.5% of a $100,000 account and 10% of a $5,000 firm daily loss limit. The position size comes from one division: lots equal $500 divided by the stop distance in pips times $10 per pip per lot. A 44-pip stop needs 1.13 lots. A 25-pip stop needs 2.00 lots. The dollars at risk never change, only the size does.
Can I use the initial balance strategy to pass a prop firm challenge?
No strategy alone passes a challenge. The challenge is passed by the rules around the strategy: 0.5% risk per trade, a $2,500 personal daily stop inside a $5,000 firm limit, a 25-to-60-pip range filter, a closed-bar breakout, a news filter, and a two-trade daily maximum. The initial balance is the entry trigger inside that system. In my fourteen-trade test it produced +$5,000 with those rules on, and -$1,000 with the same range and the rules off. The rules are the strategy. The range is the trigger. For the Market Profile background the initial balance comes from, see the Proptary guide to Market Profile trading.
Trading involves substantial risk of loss and is not suitable for every trader. The numbers in this article come from my own fourteen-trade test on a $100,000 account and are not a promise of future results. Never risk money you cannot afford to lose, and always check your firm’s current rules before you trade.


