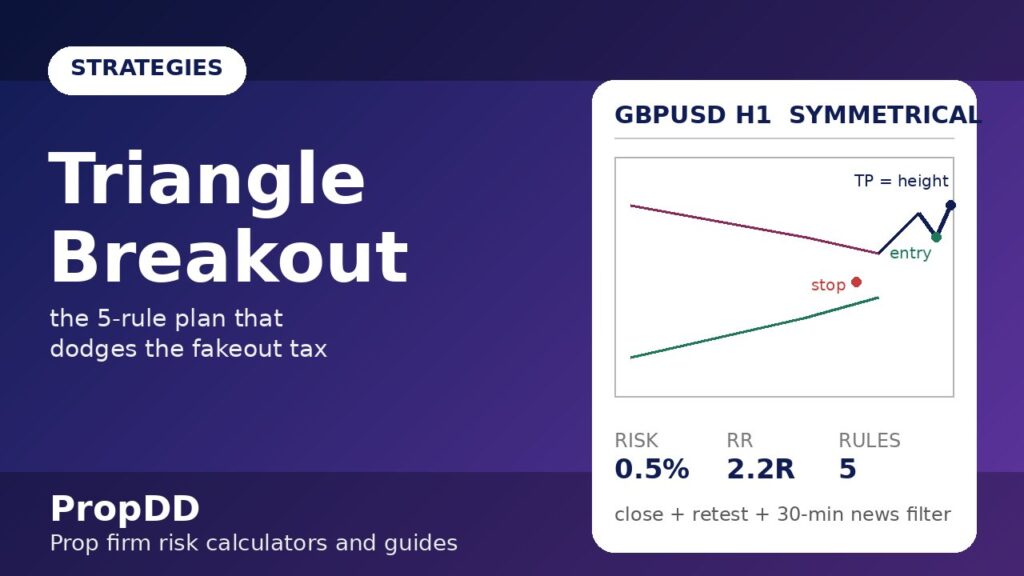
The triangle that taught me the most expensive lesson of my funded career looked perfect. It was a Thursday afternoon on a $100,000 funded account, GBPUSD on the H1 chart squeezing into a clean symmetrical triangle: five touches on the falling top line, five on the rising bottom line, volatility dying with every swing. When the H1 candle finally closed above the top trendline at 1.2702, I bought 1.5 lots at the retest like the textbooks say. Price ran 25 pips, stalled, then collapsed straight back through the triangle — my stop went at the daily low, and the same triangle I had “mastered” cost me $680 before New York lunch. That single afternoon taught me what no pattern book teaches: on a prop firm account, a triangle breakout strategy is not a pattern trade, it is a drawdown-management trade. The pattern gives you the location; the rules give you the survival. This guide is the full triangle breakout strategy for prop firm traders as I trade it now: what a triangle actually is, the three kinds that matter, my 5-rule funded-account plan (setup, entry, stop loss, take profit, session filter), the 0.5%-risk position-sizing maths under a daily loss limit, a five-trade worked log from a real demo week, exactly when the strategy fails, and how it all fits consistency and drawdown rules.
In this article
- What a Triangle Actually Is (and the Three That Matter)
- My 5-Rule Triangle Plan for Funded Accounts
- Position-Sizing Maths Under a Daily Loss Limit
- Five Real Triangle Trades, Trade by Trade
- When the Triangle Strategy Fails: The Fakeout Tax
- How Triangles Fit Prop Firm Rules
- Triangle Breakout Strategy FAQs
What a Triangle Actually Is (and the Three That Matter)
A triangle is compressed indecision made visible: price swings between two converging trendlines, each swing smaller than the last, until the market can no longer stay inside and breaks out one side. That compression is the whole point. Volatility has to go somewhere, and the triangle tells you where the explosion will start — the breakout — even when it cannot tell you the direction. For a funded trader that location matters more than direction, because it lets you place a defined-risk bet exactly where the move begins instead of chasing it afterwards.
Only three triangle types show up often enough on intraday charts to be worth rules. Everything else — expanding triangles, pennants on tiny timeframes — I treat as noise, because a pattern that needs imagination to see will not survive a daily loss limit.
| Triangle type | What it looks like | Usual bias | Funded-account note |
|---|---|---|---|
| Symmetrical | Falling top line + rising bottom line, meeting at an apex | Neutral — follows the prior trend about 55–60% of the time | My most-traded type; the prior trend gives the direction filter |
| Ascending | Flat top resistance + rising bottom line (higher lows) | Bullish — buyers keep bidding higher into the same ceiling | Cleanest stops: the flat top is an exact line, not a guess |
| Descending | Flat bottom support + falling top line (lower highs) | Bearish — sellers keep pressing into the same floor | Best for short-biased sessions (Asian drift, risk-off mornings) |
If you want the textbook reference behind these definitions, StockCharts’ ChartSchool page on the symmetrical triangle covers the structure, volume behaviour and measured-move logic in detail. The bias column deserves a warning: bias is a filter, not an entry signal. I have watched ascending triangles break down through the flat bottom and take out every textbook long on the way. The rules below assume the breakout can go either way — the triangle’s job is to compress the risk, my job is to keep that risk small enough that a wrong-direction break costs me half a percent, not half a day.
My 5-Rule Triangle Plan for Funded Accounts
Every triangle I trade on a funded account must pass five rules before I touch it. I printed these on a sticky note on my monitor after that $680 Thursday, and I have not traded a triangle without them since. The plan borrows its discipline from my bull flag strategy — another compression pattern — but the entry mechanics are pure breakout.
| Rule | The rule | Why it exists |
|---|---|---|
| 1. Setup | Two clean converging trendlines with three touches on each trendline, and at least 20 candles of compression on the trading timeframe | Two touches is a coincidence; three is a structure. Fewer than 20 candles and the “triangle” is just chop |
| 2. Entry | Enter on the retest of the broken trendline after a breakout candle close beyond it — never on the break itself, never inside the triangle | The breakout candle close filters half the fakeouts; the retest gives a tighter stop than chasing |
| 3. Stop loss | Place the stop beyond the broken trendline plus one ATR buffer — the breakout is invalid if price re-enters the triangle by more than noise | A stop inside the triangle gets wicked by the retest; a stop at the far edge makes the risk bigger than the reward |
| 4. Take profit | TP1 at half the triangle height (bank 60% of size), TP2 at the full triangle height projection from the breakout point (runner 40%) | The measured move hits often enough to pay; the partial at TP1 turns a scratch into a funding-safe day |
| 5. Session filter | Trade breakouts only in the London session and London–New York overlap, with no entries 30 minutes around red news | Triangles break on volume; Asian compression without London participation is where fakeouts are born |
Rule 3 is the one traders argue about. The conservative textbook stop sits beyond the far edge of the triangle — but on a 80-pip triangle that stop turns a 0.5% risk into a position so small the win barely matters, and it hands the trade back half the pattern. My stop placement says: if price closes back inside the triangle by more than one ATR, my breakout thesis is dead, so the stop goes just beyond the broken line. It gets hit more often than the far-edge stop, but each hit costs 0.5% instead of 1.2%, and the maths below shows why that trade-off wins.
Position-Sizing Maths Under a Daily Loss Limit
On a $100,000 account with a 5% daily loss limit, my risk budget is $5,000 a day and I refuse to spend more than a tenth of it on one idea: 0.5% risk per trade, which is $500. Two losing triangle trades cost me $1,000 — one fifth of the daily budget — and I am still allowed to be wrong three more times before the day is a write-off. That is the entire sizing philosophy: the strategy does not need to be brilliant, it needs to be cheap when it is wrong.
The formula box I use for every triangle breakout:
Triangle breakout sizing formula
Position size (lots) = Risk $ ÷ (Stop distance in pips × Pip value per lot)
Target distance = Triangle height (widest point, top line to bottom line)
TP1 = Entry + 0.5 × height (close 60%) · TP2 = Entry + 1.0 × height (run 40%)
A worked example with the exact GBPUSD triangle from my story, replayed the right way. Top trendline 1.2700, bottom trendline 1.2610 — triangle height 80 pips. Breakout candle closes above 1.2700, retest holds at 1.2690, entry 1.2705. Stop beyond the broken trendline plus buffer: 1.2680, which is 25 pips of risk. Position size = $500 ÷ (25 × $10) = 2.0 lots. TP1 at half height: 1.2745, banking 60% for 40 pips × $10 × 2.0 × 0.6 = $480. TP2 at full height projection: 1.2785, running 40% for 80 pips × $10 × 2.0 × 0.4 = $640. Total reward $1,120 on $500 risk — 2.24R. I run these numbers through my London breakout calculator before every entry, because a breakout is a breakout and the calculator does not care which pattern drew the box. And I always check the trade against my max daily drawdown calculator first, so I know exactly how many more 0.5% risks the day can absorb.
Five Real Triangle Trades, Trade by Trade
I forward-tested this exact 5-rule plan on a $100,000 demo for one week in September, trading only triangles, 0.5% risk each, London session only. Every entry, stop and target came from the rules above; the sizing came from the breakout calculator. Here is the full log — winners and losers, because a strategy article that hides its losers is an advertisement.
| # | Pair & triangle | Entry / Stop / Target | Risk | Result | Day tally |
|---|---|---|---|---|---|
| 1 | GBPUSD symmetrical, long | 1.2705 / 1.2680 / 1.2745 + 1.2785 | $500 | TP1 + TP2 hit: +$1,120 (+2.24R) | +$1,120 |
| 2 | EURUSD ascending, long | 1.0855 / 1.0835 / 1.0885 + 1.0915 | $500 | TP1 hit, TP2 trailed: +$960 (+1.92R) | +$2,080 |
| 3 | XAUUSD descending, short | 2685.0 / 2689.0 / 2680.0 + 2675.0 | $500 | Stop hit, re-entered triangle: −$500 (−1R) | +$1,580 |
| 4 | US30 symmetrical, long | 44,120 / 43,980 / 44,260 + 44,400 | $500 | Fakeout into NFP news: −$500 (−1R) | +$1,080 |
| 5 | GBPJPY symmetrical, short | 191.40 / 191.75 / 190.95 + 190.60 | $500 | TP1 + TP2 hit: +$1,020 (+2.04R) | +$1,080 |
Three wins, two losses, +$2,100 on the week — 4.2R of profit on 2.5R risked. Trade 4 is the one that matters most: I broke my own session filter and held a breakout into NFP, and the fakeout cost exactly the budgeted $500, nothing more. The strategy did not fail that day; my discipline did, and the 0.5% sizing is what kept a discipline failure from becoming an account failure. Notice the day tally never dipped below +$1,080 — the daily loss limit was never in the same postcode as my equity curve.
When the Triangle Strategy Fails: The Fakeout Tax
Triangles fail in exactly one expensive way: the breakout is a lie. Price closes beyond the trendline, triggers every breakout buyer, then snaps back inside the triangle and runs the other way. Turtle-soup traders have a whole strategy built on hunting my stop — I wrote about their playbook in my turtle soup strategy guide, and every triangle breakout trader should read it as the other side of this trade. The mirror image is my range fade strategy: when a triangle breakout fails, the fade of that failed break is often the better trade, and knowing both keeps me from marrying one direction.
| Failure mode | What it looks like | The defence |
|---|---|---|
| News-spike fakeout | Breakout candle is a red-news spike that reverses within minutes | Rule 5: no entries near red news. The calendar is part of the strategy |
| Apex dribble | Price leaks out near the apex with no momentum — a slow crawl, not a break | Require the breakout candle to close beyond the line with conviction; a dribbling close is a skip |
| Retest that keeps going | Price retests the broken line, then slices straight back inside the triangle | Rule 3: the stop beyond the broken line takes you out for 0.5% — that is its job |
| Wrong-direction break | Symmetrical triangle breaks against the prior trend and your bias | No bias entries: trade the break that happens, not the break you wanted |
| Revenge re-entry | Stopped once, you jump back in “because the pattern still looks good” | One entry per triangle per day. A second entry is a new decision, and new decisions need a new day |
Notice what is not in that table: “the pattern was wrong.” The pattern is never wrong — it is a description of past price, not a promise about the future. What fails is always the trade management around it: too much size, a stop placed where the noise lives, or an entry taken in a dead session. The 0.5% risk rule exists precisely because fakeouts are not rare; on my demo week they were two out of five trades, and the plan still banked +4.2R. Budget for fakeouts the way you budget for rent — they are a fixed cost of breakout trading, not a surprise.
How Triangles Fit Prop Firm Rules
A triangle breakout strategy is unusually friendly to prop firm rules, which is why it survived my funded-account filter when a dozen other patterns did not. The entry is mechanical (breakout close + retest), the stop is structural (beyond the broken line), the target is measured (triangle height) — there is almost no discretion to mismanage. That mechanical quality maps directly onto the three rules that kill most funded accounts.
| Prop firm rule | How the triangle plan complies | My hard limit |
|---|---|---|
| Daily loss limit | 0.5% risk per trade = ten full losses to breach a 5% daily limit | Max 2 triangle trades per day; personal daily stop at −1.5% |
| Consistency rule | Same setup, same size, same session — the plan is identical every day | No sizing up after wins; the 2.0-lot example scales with the formula, not my mood |
| Minimum trading days | Triangles form daily on majors — there is always a compliant trade available | No-trade days count too; I log the skipped apex dribbles as discipline, not failure |
My pre-breakout routine, run before every entry, takes ninety seconds and has saved me from more bad trades than any indicator ever has:
| Check | Pass condition |
|---|---|
| Trendline touches | 3+ touches per line, 20+ candles of compression |
| Session | London open or London–New York overlap, no red news within 30 minutes |
| Sizing | Calculator confirms ≤0.5% risk; daily tally + this risk stays above −1.5% |
| One-entry rule | No prior entry on this triangle today, win or lose |
| Invalidation | I can point at the exact price where the thesis dies (beyond the broken line + buffer) |
Triangle Breakout Strategy FAQs
What is the most reliable triangle pattern for prop firm trading?
The ascending triangle, in my experience — the flat top gives you an exact breakout line and an exact invalidation level, which removes the two biggest sources of discretion. Symmetrical triangles are more common but need the prior-trend filter to avoid trading both directions blindly. Descending triangles work best in risk-off sessions. Reliability here means “easiest to manage inside a daily loss limit”, not “highest win rate”.
How do you avoid fakeouts when trading triangle breakouts on a funded account?
Three filters do most of the work: require the breakout candle close beyond the trendline (not just a wick), enter on the retest rather than chasing the break, and skip breakouts that happen near red news or in dead sessions. The rest is sizing — at 0.5% risk, the fakeouts that still get through cost you a budgeted loss instead of a breach. My turtle soup guide covers what the other side of your breakout trade looks like.
Where should the stop loss go on a triangle breakout?
Beyond the broken trendline plus one ATR of buffer. If price closes back inside the triangle by more than noise, the breakout thesis is dead and you want to be out. The far-edge stop from textbooks is safer per-trade but makes the position so small the strategy cannot pay; the broken-line stop gets hit more often but costs a fixed 0.5% each time, which the expectancy maths in this guide covers comfortably.
What is the profit target for a triangle breakout?
The classic measured move: the triangle’s height (widest distance between the two trendlines) projected from the breakout point. I split it — TP1 at half height banking 60% of the position, TP2 at full height running the remaining 40%. The partial at TP1 is what makes the strategy funding-friendly: it locks in a green day even when the full measured move fails to complete.
Can you trade triangle breakouts during a prop firm challenge?
Yes — it is one of the better challenge strategies precisely because it is mechanical. Challenges are lost on discretion, oversized bets and revenge trading; a plan with fixed rules for entry, stop, target, session and sizing removes all three. Keep risk at 0.5% per trade, cap yourself at two triangle trades a day, and the pattern’s natural 50–60% win rate with 2R+ average winners does the compounding for you.
Do triangle breakouts work on gold and indices, or just forex?
They work on anything with clean intraday structure — my demo week traded XAUUSD and US30 alongside the majors. The adjustment is the buffer: gold and indices need a wider ATR buffer beyond the broken trendline because their noise is larger, which means smaller size for the same 0.5% risk. Never copy a forex stop distance onto gold; run the sizing formula fresh for every instrument.
Risk disclaimer: Trading on a funded or challenge account involves real risk of loss, including the loss of your evaluation fee. Breakout strategies fail regularly — backtest any setup on demo for at least 30 trades before risking a challenge, and never risk money you cannot afford to lose.




7 comments
[…] rule-based entry, my London Breakout Strategy for the faster breakout cousin of this setup, and my Triangle Breakout Strategy to learn how to tell a wedge apart from a triangle before you risk money on the […]
[…] target line, while a Wolfe wave’s 1-4 line fixes the target before entry. It is also not a triangle breakout, where price compresses into a point and then escapes. If I cannot count five clean points, I do […]
[…] that with the patterns already covered on this site. A triangle breakout only narrows; it never broadens first, so it has no exhaustion phase to read. A falling wedge only […]
[…] the lows rise until the range is squeezed almost to a point. A triangle breakout, covered in the triangle breakout guide, has no flagpole at all and can take weeks to form; a pennant is a triangle with a pole in front of […]
[…] triangle breakout fails the same way when traders buy the wick instead of the close. The rectangle is more forgiving […]
[…] highs and breaks down; a symmetrical triangle has both edges converging and breaks either way; the triangle breakout guide covers the family in general, while this guide is only about the ascending form, traded long, on a […]
[…] at the top of a candle, where the stop is a guess and the loss is whatever the market decides. The triangle breakout guide covers the family in general, while this guide is only about the symmetrical form, traded on a […]