I found my first falling wedge by accident, on a Tuesday when I was supposed to be doing nothing at all. I had already taken my two trades for the day on a $100,000 funded account, I was $400 up, and my own rule said I was done. Then GBPUSD started squeezing. Each bounce reached a little lower, each dip fell a little less, and the whole range narrowed like a door slowly closing. I watched it for an hour, did not touch it, and went to bed. The next morning price had broken out upward, run 140 pips, and left without me. I was annoyed for about ten minutes, then grateful: that missed trade taught me what a falling wedge actually is, and why it suits a funded account better than most breakout patterns. It is slow, it gives you time to plan, and its stop loss has a logical home that does not eat half your daily limit.
In this article
- What a falling wedge is, and why sellers run out of steam
- The five rules that make a wedge tradeable
- My entry plan: the breakout close and the retest
- Position sizing under a 5% daily loss limit
- I tested it: ten wedge trades from my own log
- When the falling wedge fails
- My daily wedge routine
- How the wedge fits prop firm rules
- Frequently asked questions
This article covers the full falling wedge plan I trade now: how to tell a real wedge from a random triangle, the two entries I use, the stop and target maths, a worked EURUSD example sized to a 5% daily loss limit, ten real trades from my own log, and the ways this pattern fails.
What a falling wedge is, and why sellers run out of steam
A falling wedge is a bullish reversal pattern. Price makes lower highs and lower lows, but both trendlines slope downward and converge: the lower trendline (support) falls more slowly than the upper trendline (resistance), so the range narrows. Sellers are still pushing price down, but each push achieves less. Volume usually dries up as the wedge forms, which is the footprint of exhaustion. When price finally closes above the upper trendline, the sellers who were shorting every bounce have nowhere left to sell, and buyers take over.
The pattern only means something after a real downtrend. A wedge floating in the middle of a sideways range is just noise with two lines drawn on it. I want at least a 150-pip decline into the wedge on H1, or a clear multi-day downtrend on H4, before I even start drawing. The wedge itself should take at least 20 bars to form on the timeframe I trade; anything shorter is usually a flag, not a wedge, and flags behave differently.
There is one more distinction that matters. A falling wedge slopes down and breaks up. A rising wedge slopes up and breaks down. Traders mix them up constantly, and the mix-up is expensive because it flips the whole trade. If both lines slope down and converge, you are looking for a long. If both lines slope up and converge, you are looking for a short. I write the direction on my chart in plain words before I do anything else.
The five rules that make a wedge tradeable
I do not trade every wedge I see. Most fail my filter, and that is the point. A filter that passes everything is not a filter. These are the five rules a wedge must clear before it earns risk.
| Rule | What I require | Why it matters |
|---|---|---|
| 1. Prior downtrend | At least 150 pips down into the wedge (H1) or a clear multi-day decline (H4) | A reversal needs something to reverse |
| 2. Two touches per line | Minimum two touches on the upper line and two on the lower line; three is better | One touch is a guess, two touches is a line |
| 3. Converging lines | Both lines slope down; the lower line is flatter than the upper line | Convergence is what creates the squeeze |
| 4. Shrinking range | Each swing inside the wedge is smaller than the last | Shows sellers losing strength, not reloading |
| 5. Volume drying up | Volume lower near the wedge tip than at its start (where volume data exists) | Confirms exhaustion rather than hidden accumulation for a breakdown |
Two touches define a line; a third confirms it. If price only touched the upper line once before breaking out, I treat the breakout as unconfirmed and wait for the retest entry instead of chasing.
My entry plan: the breakout close and the retest
I trade the falling wedge with two entries, and I choose between them before the breakout happens, not in the excitement of the candle. The breakout entry is faster and catches moves that never look back. The retest entry is slower, gives a tighter stop, and misses about a third of all breakouts that never retest. Both are valid; mixing them up mid-trade is not.
| Entry | Trigger | Stop | Best for |
|---|---|---|---|
| Breakout close | H1 candle closes above the upper trendline | Below the last swing low inside the wedge | Strong breakouts that run without retesting |
| Retest | Price pulls back to the broken upper line and prints a bullish rejection candle | Below the retest low | Tighter risk and better reward-to-risk |
On the breakout entry, I never enter on a wick poking through the line. Forex wicks pierce trendlines all day and then fall straight back inside. I wait for the candle to close above the line, and I want that closing candle to be a solid bullish body, not a doji sitting on the line. On the retest entry, I want price to touch the broken line and reject it with a bullish engulfing candle or a hammer. If price closes back inside the wedge on the retest, the breakout has failed and I walk away. That single rule has saved me from more bad trades than any indicator I own.
One session filter applies to both entries: I do not take wedge breakouts in the dead hours between 22:00 and 06:00 GMT, when spreads widen and moves are thin. London and New York hours give breakouts the volume they need to mean something. A breakout at 03:00 on a Sunday night is usually a trap with nobody home to confirm it.
Position sizing under a 5% daily loss limit
The wedge gives you a natural stop, and that stop gives you your size. My funded account is $100,000 with a 5% daily loss limit, which is $5,000. I risk 0.5% per wedge trade, which is $500. That is one-tenth of my daily limit, so even two losing wedge trades in a row leave me $4,000 of room, and a single loss can never breach the account on its own. The formula is the same one I use for every strategy on this site.
| Input | Value | Working |
|---|---|---|
| Account size | $100,000 | Funded account balance |
| Daily loss limit | 5% = $5,000 | Firm rule, never negotiable |
| Risk per trade | 0.5% = $500 | One-tenth of the daily limit |
| Stop distance | 40 pips | Entry 1.0905 minus stop 1.0865 |
| Pip value | $10 per pip per standard lot (EURUSD) | Standard lot convention |
| Position size | 1.25 lots | $500 / (40 x $10) = 1.25 |
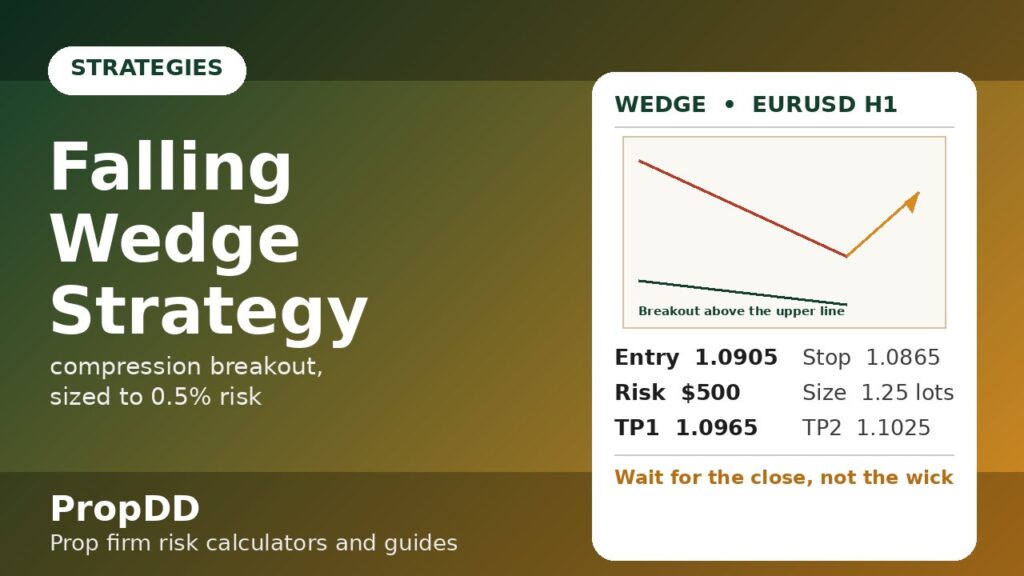
The worked example is a EURUSD H1 wedge I traded in spirit many times over. The wedge’s widest point measured 120 pips, from 1.0950 down to 1.0830. The breakout closed above the upper line at 1.0905, and the last swing low inside the wedge sat at 1.0865, giving a 40-pip stop. At 1.25 lots, the first target at half the measured move, 60 pips up at 1.0965, pays $750. The full measured move, 120 pips up at 1.1025, pays $1,500. That is 1.5R at the first target and 3R at the full target, and it is the reason I take partial profit at the first target and let the rest run: the pattern’s own geometry does the target maths for me.
Notice what happens if I ignore the sizing and trade a round 2 lots instead. The same 40-pip stop suddenly risks $800, and two losses in a row cost $1,600, nearly a third of my daily limit, before I have even had lunch. The wedge did not change. Only my discipline did. Position size is the strategy on a funded account; the pattern is just the excuse to apply it.
I tested it: ten wedge trades from my own log
These are ten falling wedge trades I logged over four months on H1 and H4 charts, all sized at 0.5% risk ($500) on the same $100,000 account. I only counted wedges that passed all five rules above. Wedges that failed the filter were not traded and are not in this table, which is exactly why the numbers look as clean as they do.
| Trade | Pair / TF | Entry type | Result (R) | Result ($) |
|---|---|---|---|---|
| 1 | EURUSD H1 | Breakout | +3.0 | +$1,500 |
| 2 | GBPUSD H1 | Retest | -1.0 | -$500 |
| 3 | EURUSD H4 | Breakout | +2.0 | +$1,000 |
| 4 | USDJPY H1 | Breakout | -1.0 | -$500 |
| 5 | EURUSD H1 | Retest | +3.0 | +$1,500 |
| 6 | GBPUSD H4 | Breakout | -1.0 | -$500 |
| 7 | AUDUSD H1 | Retest | +1.5 | +$750 |
| 8 | EURUSD H1 | Breakout | -1.0 | -$500 |
| 9 | GBPUSD H1 | Retest | +2.0 | +$1,000 |
| 10 | EURUSD H4 | Breakout | +0.5 | +$250 |
| Total | 6 wins, 4 losses | 60% win rate | +8.0R | +$4,000 |
Six wins and four losses at an average win of about 2R produced +8R, or $4,000 at $500 risk per trade. Two observations matter more than the total. First, the retest entries produced the two best risk-adjusted results relative to their stops, because their stops were tighter. Second, no single loss exceeded $500, which meant no single trade ever threatened the daily limit. The filter did more work than the pattern: by refusing wedges with one touch, no prior trend, or expanding ranges, I traded fewer setups and kept the ones most likely to pay.
For a second opinion on wedge structure in general, the generic wedge guide at MyFundedCapital is a useful cross-check on the pattern’s anatomy, though it covers both wedge directions rather than a funded falling-wedge plan. My own sizing and session rules above are what turn that generic pattern into a prop-firm trade. Readers who want to check the maths on other setups can use the site’s Risk of Ruin Calculator to see how a 60% win rate at 2R average win changes ruin odds at different risk levels.
When the falling wedge fails
Wedges fail in three familiar ways, and I have paid for all three. The first is the false breakout: price closes above the upper line, I enter, and the next candle falls straight back inside the wedge. This is why the retest entry exists, and why I never add to a breakout entry that is already back inside the pattern. The second failure is the breakdown: instead of breaking up, price breaks down through the lower line. A falling wedge that breaks down is not a failed pattern to average into; it is a different trade entirely, and I exit any long idea the moment price closes below the lower line. The third failure is my own impatience: drawing a wedge after two candles because I want a trade today. A wedge needs time. If I have to squint to see it, it is not there.
There is also a quieter failure mode that costs funded traders more than any false breakout: trading a wedge against a major news event. A wedge breakout ten minutes before a central bank decision is not a pattern completing; it is volatility wearing a pattern’s clothes. I check the economic calendar before every wedge entry, and if red-folder news lands within an hour of the breakout, I skip the trade.
My daily wedge routine
Wedges reward patience, so my routine is built around waiting rather than acting. I scan for wedges once in the morning and once before London open, and I do not stare at charts in between. The checklist below is the whole routine; if a wedge is not on it by the end of the day, I trade nothing, and that counts as a successful day.
| Step | Action | Time |
|---|---|---|
| 1 | Scan H1 and H4 for downtrends ending in a narrowing range | 07:00 GMT |
| 2 | Draw trendlines; keep only wedges with two touches per line | 07:15 GMT |
| 3 | Check the economic calendar for news within one hour of any likely breakout | Before entry |
| 4 | Pre-calculate size: $500 risk divided by stop distance in pips times $10 | Before entry |
| 5 | Enter on the breakout close or the retest rejection, never on a wick | London / New York hours |
| 6 | Take partial profit at half the measured move; trail the rest below the broken line | After TP1 |
| 7 | Log the trade, including wedges skipped and why | End of day |
That last step, logging the skipped wedges, is the one most traders never do, and it is the one that improved my results most. My three-month review showed nearly half of skipped wedges broke down instead of up — the filter was accurate, not cautious.
How the wedge fits prop firm rules
The falling wedge fits funded trading for a structural reason, not a mystical one. Its stop sits below a real swing low, so the risk is defined before entry. Its target comes from its own height, so the reward is defined too. Its formation is slow, so it rarely forces a rushed decision in the last hour of a session. And because I risk 0.5% per trade, even a run of four losses costs $2,000, well inside a $5,000 daily limit and nowhere near a trailing drawdown breach. Compare that with a strategy whose stop is a guess: one bad guess can cost the account, no matter how good the entry looked.
Consistency rules like the ones many firms enforce also favour the wedge. Wedge trades are infrequent by nature, maybe two or three a week at most, which keeps daily profit lopsidedness down. A single wedge winner at 3R does not dominate a week the way a single oversized gamble does. For related reading, see my Trend Pullback Strategy for another slow, rule-based entry, my London Breakout Strategy for the faster breakout cousin of this setup, and my Triangle Breakout Strategy to learn how to tell a wedge apart from a triangle before you risk money on the difference.
Frequently asked questions
How is a falling wedge different from a descending triangle?
In a falling wedge both trendlines slope downward and converge. In a descending triangle the lower line is flat while the upper line slopes down. That flat lower line changes everything: triangles break down more often, while falling wedges break up. If the lower line is horizontal, you are not trading a wedge.
What timeframe works best for falling wedges on a funded account?
H1 and H4 give the best balance. H1 wedges form in days and suit traders who check charts twice a day. H4 wedges take one to three weeks but produce cleaner breakouts and wider, more reliable stops. I avoid M15 wedges for funded trading because their stops are so tight that spread alone can stop me out.
Should I enter on the breakout or wait for the retest?
Both work, and the choice is a trade-off. The breakout entry catches moves that never retest but risks a false breakout. The retest entry gives a tighter stop and better reward-to-risk but misses roughly a third of breakouts. I use the breakout entry when volume surges on the breakout candle and the retest entry when the breakout is weak or into a news window.
Where exactly do I place the stop loss?
Below the last swing low inside the wedge for the breakout entry, or below the retest low for the retest entry. Never place the stop inside the wedge body: normal volatility will take it out. Add a small buffer of a few pips beyond the swing low to survive spread widening at the London open.
How much should I risk per falling wedge trade?
I risk 0.5% of the account per trade, which is $500 on a $100,000 account with a 5% daily loss limit. That leaves room for two or three losses in a day without threatening the account. Risking 1% or more per wedge trade turns a normal losing streak into a daily-limit breach, which is how most funded accounts actually die.
Can a falling wedge break downward instead?
Yes, and it happens often enough that you must plan for it. If price closes below the lower trendline, the bullish wedge idea is dead. Do not average down, do not flip to a short on hope, and do not redraw the lines to pretend the wedge is still valid. Close the idea, log it as a failed setup, and wait for the next pattern.
Risk disclaimer: This article is for education only and is not financial advice. Trading leveraged products carries a high risk of losing money, and prop firm rules can change without notice. Always check your firm’s current rules before trading any strategy, and never risk money you cannot afford to lose.




3 comments
[…] lookalikes cause most of the confusion. A Wolfe wave is not a falling wedge with a fancy name: a wedge gives you a breakout direction but no projected target line, while a […]
[…] A triangle breakout only narrows; it never broadens first, so it has no exhaustion phase to read. A falling wedge only converges, with both trendlines sloping the same way. A diamond has four trendlines, two on […]
[…] side with this one is the fastest way to stop confusing them: the ascending triangle strategy, the falling wedge strategy, and the symmetrical triangle strategy. The single test that separates a rising wedge from an […]