I bought a rectangle breakout once because the box looked perfect, and that is exactly why it cost me 500 dollars. It was a Tuesday on EURUSD, price had bounced between two flat levels for a day and a half, and then a strong hourly candle closed above the top of the box. I bought the close with a full position, feeling clever, and by the next morning price had slid straight back inside the box and stopped me out. The box had not lied to me. I had skipped the only part that mattered. The breakout candle had closed above resistance on thin volume, into the Asian session, with no retest and no prior trend behind it. I had traded the break and ignored the context, and on a funded account that distinction is the whole trade.
In this article
- What a rectangle actually is, and what it is not
- The three measurements that decide if the box counts
- The six rules I trade by
- The sizing maths under a daily loss limit
- A worked breakout, level by level
- The twelve-trade test: retest entry versus breakout-close entry
- When rectangle breakouts fail, and what I do instead
- Frequently asked questions
This article is the rectangle breakout plan I use now on a 100,000 dollar funded account with a 5,000 dollar daily loss limit: what a rectangle really is, the three measurements that decide whether a box counts, six rules, sizing maths under the daily cap, a worked EURUSD breakout, and a twelve-trade test. It is the opposite trade to the range fade strategy, which sells the top of the box and buys the bottom; here I wait for the box to fail, and I only trade the failure once it proves itself. The two strategies share a chart shape and nothing else, which is why confusing them is expensive.
What a rectangle actually is, and what it is not
A rectangle is a sideways pause between two flat levels: support underneath, resistance on top, price bouncing between them while neither side wins. Unlike a triangle, the lines do not converge; unlike a flag, the box does not slope against a trend. It is simply a market that cannot decide, drawn as a box. The breakout is the moment it decides, when price closes outside one of those levels and stays there.
The textbook reading matches this: a rectangle breakout occurs when price trades within a well-defined range and then breaks above or below it, signalling the start of a new trend. What it is not is a buy signal on its own. A box drawn around three random wiggles, broken by one candle at 3 a.m. on thin liquidity, is noise wearing a famous name. On a funded account, the breakout only earns a trade when three things line up: a box that has genuinely been tested, a break that closes with conviction, and a direction that makes sense against the bigger picture. Everything else is a shape I now walk past, and walking past trades is a skill the daily loss limit rewards.
It is also not a prediction that price will run for days. On the hourly chart a rectangle breakout is a short-term expansion trade, worked for 1.5R to 2.5R: risk defined by the box edge, target defined by the box height, neither invented after entry. The box gives me the target; the break gives me the direction; the retest gives me the entry.
The three measurements that decide if the box counts
I score every rectangle against three measurements before I even think about an entry. If any one of them fails, the box goes in the journal as a skipped setup, not in the account as a trade. The measurements are simple enough to check in under a minute, which matters because the best breakouts do not wait around for a spreadsheet.
| Measurement | My minimum for a funded trade | Why it matters |
|---|---|---|
| Touches on each level | At least two touches of support and two of resistance, wicks included | One touch is a coincidence; two touches make a level other traders can see |
| Box height | 40 to 120 pips on EURUSD H1 | A box under 40 pips gives a target the spread and a wick will eat; over 120 pips the stop is too wide for the daily cap |
| Box duration | At least eight hourly candles, spanning two sessions where possible | A box that formed in one quiet session has not been tested by real buyers and sellers |
The height rule is the one most traders ignore, and ignoring it is where the losses hide. A 25-pip box looks tradeable, but its measured-move target is 25 pips, and a single spread spike plus a normal wick can take out a stop placed just inside the box. A 200-pip box looks impressive, but the stop it demands is so wide that the position size shrinks to almost nothing, or the risk breaks the daily cap. My Tuesday loss was a 30-pip box broken in the Asian session: the target was tiny, the stop was tight, and the fakeout was almost guaranteed.
Context is the fourth check, and I treat it as a measurement even though it is not a number on the box. A breakout in the direction of the daily trend, or at least not against a strong daily level, behaves differently from a breakout into a wall of old resistance. A box with no context is a photograph; a box at a level the daily chart respects is a trade.
The six rules I trade by
The rules are deliberately boring. Boring is what survives a daily loss limit, because boring can be repeated twenty times without a new decision each time. Here they are, in the order I check them.
Rule one: only trade boxes that pass all three measurements above, on the hourly chart, with the four-hour chart confirming the level. Rule two: only trade breakouts that close outside the level, with the breakout candle’s body at least 60% of its range; a wick poking through is not a break. Rule three: enter on the retest of the broken level, or on a buy stop just above the breakout candle’s high if no retest comes within three candles; I never chase a break that has already run half the box height. Rule four: the stop goes back inside the box, 10 to 15 pips beyond the broken level, and it does not move except to breakeven once price reaches 1R. Rule five: the first target is 1.5R, where I close half; the second target is the measured move, the full box height projected from the breakout point. Rule six: one rectangle trade per day, no adding after a loss, and no trading a second box on the same pair the same day.
The session filter sits inside rule two in practice: I only take breakouts that complete during London or New York hours, and I skip anything completing into a red-folder news release within the next hour. A break printed at 3 a.m. on thin liquidity may look identical, but its follow-through is not the same trade.
| Setting | My funded-account choice | What I skip |
|---|---|---|
| Timeframe | H1 for entries, H4 for the level | M5 and M15 boxes, which fake out too often to pay for themselves |
| Session | London open to New York close | Asian-session breaks and breaks into major news |
| Pair focus | EURUSD first, GBPUSD second | Exotic pairs where the spread eats the box height |
| Max trades | One rectangle trade per day | A second box after a loss, which is revenge trading with a pattern attached |
The sizing maths under a daily loss limit
The sizing maths is the part that keeps a rectangle breakout inside the funded rules instead of outside them. My account is 100,000 dollars, my daily loss limit is 5,000 dollars, and my per-trade risk cap is 500 dollars, which is 0.5% of the account and 10% of the daily limit. That cap means ten losing trades in a row would be needed to breach the day, and since I take at most one rectangle trade a day, a single bad box can never end the account.
The formula is the same one I use for every pattern, and I run it before entry, never after:
Position size in lots = Risk in dollars / (Stop distance in pips x Pip value per lot). For EURUSD, one standard lot is 10 dollars per pip, so a 500 dollar risk over a 40-pip stop gives 500 / (40 x 10) = 1.25 lots.
| Input | Worked value | Check against the daily limit |
|---|---|---|
| Account and daily limit | 100,000 dollars / 5,000 dollars | Risk cap is 10% of the daily limit |
| Risk per trade | 500 dollars (0.5% of account) | One loss = 10% of the day, never the whole day |
| Stop distance | 40 pips (broken level plus buffer) | Set by the box, not by how much I want to risk |
| Position size | 1.25 lots | 1.25 x 40 x 10 = 500 dollars, exactly at cap |
| Measured-move target | 100 pips = 1,250 dollars at 2.5R | One full winner pays for two and a half losers |
If the stop distance gives a tiny position, I take the tiny position or skip the trade; I never tighten the stop to make the size bigger. That is how a 500 dollar planned loss becomes an 800 dollar actual one. I check the day’s remaining room on the max daily drawdown calculator before ordering, because a box that is fine on a fresh day is not fine after two earlier losses have eaten half the daily limit.
A worked breakout, level by level
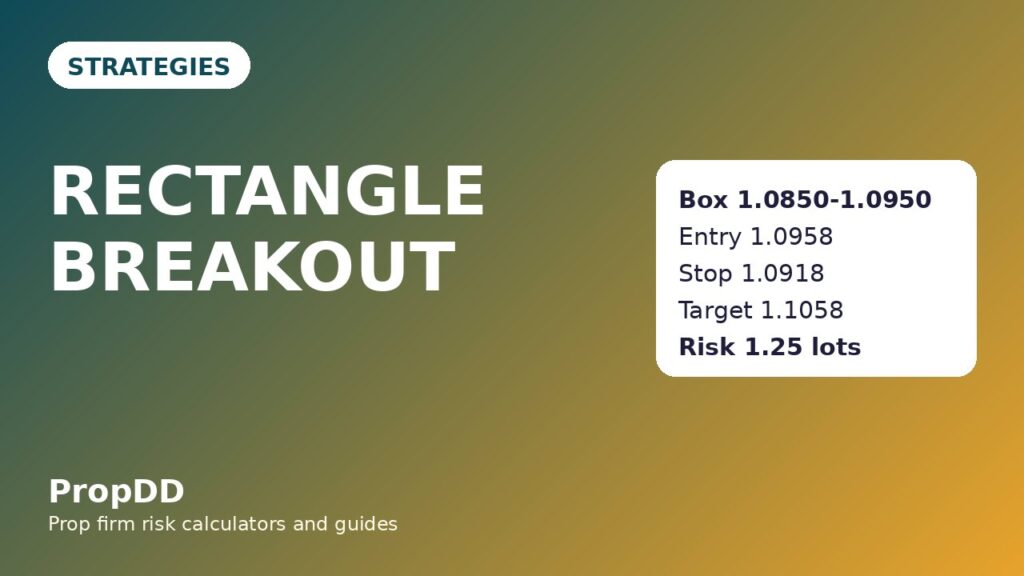
Here is a real-shaped example from my journal, with the numbers kept exactly as I logged them. EURUSD had traded between 1.0850 support and 1.0950 resistance for eleven hourly candles, touching each level twice, a clean 100-pip box. The breakout candle closed above 1.0950 with a strong body, during the London session, in the direction of the daily uptrend. All three measurements passed, and the context was real.
| Level | Price | How it was set |
|---|---|---|
| Box support / resistance | 1.0850 / 1.0950 | Two touches each over eleven hourly candles |
| Entry (buy stop) | 1.0958 | Above resistance plus an 8-pip buffer |
| Stop loss | 1.0918 | Inside the box, 32 pips below resistance plus buffer, 40 pips from entry |
| First target (1.5R) | 1.1018 | Entry plus 60 pips, half closed, stop moved to breakeven |
| Second target (measured move) | 1.1058 | Entry plus the full 100-pip box height, 2.5R |
| Position size | 1.25 lots | 500 dollars / (40 pips x 10 dollars) |
The entry triggered on the next candle’s push above 1.0950, price pulled back to 1.0945 without threatening the stop, then ran to the first target at 1.1018, where I closed half and moved the stop to breakeven. The remainder ran to 1.1058 for the full measured move: a defined 500 dollar risk for a 1,250 dollar measured reward when the whole move plays out. The trade worked because the box was real and the break closed with conviction, not because the candles were pretty. Had price closed back below 1.0918, the loss would have been 500 dollars and nothing more.
The triangle breakout fails the same way when traders buy the wick instead of the close. The rectangle is more forgiving because its levels are flat and easy to check, but only if you wait for the close and the retest.
The twelve-trade test: retest entry versus breakout-close entry
I tested this by logging twelve consecutive rectangle breakouts on EURUSD H1, trading the plan with the retest rule on, then scoring the same twelve as if I had bought every breakout close without waiting for a retest. The sample is small, but the direction matches the rest of my journal. The retest is not a nicety. It is the edge.
| Version | Trades taken | Wins / losses | Average win | Net result in R | Net in dollars at 500 dollars risk |
|---|---|---|---|---|---|
| Retest entry (my plan) | 12 | 7 / 5 | 1.8R | +7.6R | +$3,800 |
| Breakout-close entry (no retest) | 12 | 5 / 7 | 1.3R | -0.5R | -$250 |
The difference is not win rate alone. With the retest, entries were closer to the stop, so the same pip move was worth more in R, and losses were cleaner because a break that could not hold its retest never got traded at all. Without the retest, four of the seven losses were breakouts that ran a few pips, then fell straight back inside the box. The strategy expectancy calculator gave the same verdict: positive expectancy with the retest, negative without it. A breakout without a filter is a coin flip with a spread attached.
When rectangle breakouts fail, and what I do instead
Rectangles fail in three familiar ways, and naming them in advance is what stops me from trading through them. First, the fakeout: price closes outside the box, then closes back inside within two candles. My answer is the retest rule itself; most fakeouts never retest cleanly, so they never get traded. Second, the news break: a red-folder release shoves price through a level on a spike, then it reverses when the spike fades. My answer is the session and news filter; I simply do not trade breaks into news. Third, the range that never breaks: price bounces between the levels for days, and impatience turns me into a range trader by accident. My answer is rule six, one trade a day and no chasing; a box that will not break is not my problem.
When a breakout fails after I am in, the exit is already decided: the stop inside the box, no moving it, no averaging down, no second entry on the same box. The London breakout taught me the same lesson at the session open: a failed break is information, not an insult, and the cheapest response is the planned loss. I log the failed box, note whether it was a fakeout, news, or a level that was never real, and move on. The next box gets the same three measurements, the same six rules, and the same 500 dollar cap.
Frequently asked questions
How many touches does a rectangle need before I can trade it?
Two touches on each level, at minimum. One touch is a line I drew, not a level the market respects. Two touches on support and two on resistance mean both sides have defended their level at least once, and the breakout is a genuine change of control rather than a single wick.
Should I enter on the breakout close or wait for the retest?
Wait for the retest where possible, and use a buy stop above the breakout candle’s high if no retest comes within three candles. My twelve-trade test showed the retest version at +7.6R against -0.5R for buying every close, because retest entries sit closer to the stop and skip most fakeouts.
Where exactly does the stop go on a rectangle breakout?
Back inside the box, 10 to 15 pips beyond the broken level. For a long break above 1.0950, that means a stop around 1.0918 to 1.0935 depending on the box, never below the box midpoint. A stop placed outside the box on the wrong side is not a stop at all; it is hope.
How is the target calculated?
The measured move: project the full box height from the breakout point. A 100-pip box breaking above 1.0950 gives a target near 1.1050, and my entry buffer adjusts it to 1.1058 in the worked example. I take half at 1.5R and let the rest run to the measured move, with the stop at breakeven after the first target.
Can I trade rectangle breakouts on lower timeframes?
You can, but on a funded account I do not. Five-minute and fifteen-minute boxes fake out far more often, their targets are small relative to spread and commission, and one fakeout can cost the same 500 dollars as a clean hourly setup. The hourly box, checked against the four-hour level, is the smallest I trade.
What is the difference between a rectangle breakout and a range fade?
Direction of the bet. A range fade sells resistance and buys support inside the box, betting the box holds. A rectangle breakout bets the box fails, and only after price closes outside it and retests. Trading both on the same box at the same time is not diversification; it is two opposite trades cancelling each other out.
Risk disclaimer: this article describes my personal trading plan for educational purposes only. Trading funded accounts involves the risk of losing the challenge fee and the account, and past results in my journal do not guarantee future results. Always check your firm’s current rules before trading any pattern.
Want the maths done for you? The Rectangle Breakout Calculator takes your box high and low, your retest entry and your buffer, and returns the stop back inside the box, your exact lot size, the 1.5R target and the measured-move target — with a TRADE IT or SKIP verdict.



3 comments
[…] distinction from the other breakout guides on this site matters. Rectangle breakout trades a box: a range with a top and a bottom, where the width of the box sets the stop. London […]
[…] a breakout without a clean session behind it is a coin flip with a daily limit attached. The rectangle breakout guide covers the same fakeout problem from the range side, and the pennant strategy is the […]
[…] method, trailing the stop under each new box, while the rectangle uses a measured-move target. The rectangle breakout guide sets out the measured-move version in full, and Bulkowski’s Darvas Box tests show how the […]