I lost 500 dollars on my first turtle trade in forty minutes. GBPUSD had closed above its 20-day high, so I bought 1.0950 with 2.00 lots, stop 25 pips below. My risk was 500 dollars, 10 percent of my 5,000 dollar daily loss limit. The breakout failed, my stop was gone before lunch, and two days later the pair ran 120 pips higher without me.
In this article
- What turtle trading actually is
- System 1 vs System 2: the two breakout systems
- N: the volatility number that sizes every trade
- The six funded-account rules
- My worked trade: the 20-day breakout I actually took
- Turtle trading vs turtle soup vs Donchian: same name, three different trades
- Twelve trades with the skip rule: what the numbers say
- When turtle trading fails on a funded account
- My daily turtle routine
- Frequently asked questions
The entry is the least original part of turtle trading. The Turtles got rich because every trade was sized by volatility, stopped at a fixed multiple of it, added to only in profit, and exited by a pre-written rule. I had copied the entry and ignored the rest. This guide covers the system on a 100,000 dollar funded account: 5,000 dollar daily limit, 10,000 dollar maximum drawdown, 500 dollar risk per trade.
What turtle trading actually is
In 1983 the Chicago trader Richard Dennis bet his partner William Eckhardt that great traders are made, not born. Dennis hired about twenty ordinary people, trained them for two weeks, gave them real capital, and set them loose on the futures markets. The group became known as the Turtles. They reportedly earned over 100 million dollars in four years. That figure is unaudited, and several trainees were dropped early, so treat it as legend rather than promise.
What matters is the document, not the legend. One of the original Turtles, Curtis Faith, later published the complete rules for free. The system has only five decisions: markets, size, entry, exit and stop. Every decision is mechanical. The catch is that the original rules risked 2 percent per trade, which is 2,000 dollars on a 100,000 dollar account, or 40 percent of the daily loss limit on one trade. This article keeps the logic and rebuilds the size. The Pattern Wizard turtle traders guide covers the same published rules and the experiment.
System 1 vs System 2: the two breakout systems
The Turtles ran two breakout systems at once, differing only in lookback length. System 1 buys a break above the highest high of the past 20 days, sells a break below the lowest low, and exits on the opposite 10-day extreme. System 2 does the same on a 55-day high and low, exiting on the opposite 20-day extreme. System 1 trades more often; System 2 holds longer and misses the whipsaws that kill System 1 in a range. A funded trader cannot run both: two systems on one market means double risk on the same idea. My rule: one system, one market, one direction at a time.
| Rule | System 1 (short term) | System 2 (long term) |
|---|---|---|
| Entry long | Break above the 20-day high | Break above the 55-day high |
| Entry short | Break below the 20-day low | Break below the 55-day low |
| Exit long | Touch of the 10-day low | Touch of the 20-day low |
| Exit short | Touch of the 10-day high | Touch of the 20-day high |
| Skip rule | Skip if the last System 1 breakout won | No skip rule |
| Funded use | Default system on EURUSD daily | When System 1 is flat two weeks |
The skip rule makes System 1 work. If the last System 1 breakout on a market was a winner, skip the next one there. If the last one was a loser, take the next one. Breakouts cluster: after a winner the trend is already running, so the next breakout is late; after a loser the range is still intact, so the next breakout is the one that escapes. My test shows its worth: four losing trades removed, 2,000 dollars saved.
N: the volatility number that sizes every trade
N is the whole system in one number: the 20-day exponential moving average of the true range, close to what traders now call the average true range. One Unit is sized so a move of 1 N equals 1 percent of account equity, the stop sits 2N from the entry, and a new Unit is added for every half N move in your favour. When volatility doubles, N doubles, the Unit halves and the stop doubles, so the dollar risk stays the same.
| Step | Formula | Worked number |
|---|---|---|
| True range | Highest of high minus low, high minus prior close, prior close minus low | Day 1: 38 pips |
| N update | Old N plus 2 divided by 21 times true range minus old N | 41.62 |
| Five days on | Same update, true ranges 45, 52, 41, 48 pips | 41.94, 42.90, 42.72, then 43.22 pips |
| Original Unit | 1 percent of equity divided by N times dollars per pip per lot | 2.50 lots |
| Original risk | Unit times 2N stop | 2,000 dollars |
| Funded Unit | 500 dollars risk divided by 2N stop times dollars per pip per lot | 0.62 lots, risk 496 dollars |
Read the last two rows together: they are the funded adaptation. The original Unit risks 2,000 dollars, 40 percent of a 5,000 dollar daily loss limit, on one trade. My funded Unit risks 496 dollars, 10 percent of the daily limit and 0.5 percent of the account. Same system, same N, same 2N stop, a quarter of the original dollar risk.
The six funded-account rules
A funded account adds three constraints the Turtles never had: a daily loss limit, a trailing drawdown, and a consistency rule. So my funded version has six rules, and I do not trade unless all six are true at entry. The first four are the original system, the last two are the funded wrapper, and the wrapper is not optional.
| Number | Rule | Funded number |
|---|---|---|
| 1 | Trade only a 20-day or 55-day breakout on the daily chart | 08:00 London, after the daily close |
| 2 | Size one Unit from N, stop 2N from entry | 0.62 lots at N 40 pips, stop 80 pips, risk 496 dollars |
| 3 | Add one Unit per half N move in your favour, never add to a loser | Maximum 2 Units per market |
| 4 | Exit on the opposite 10-day or 20-day extreme, no profit target | 10-day low (S1), 20-day low (S2) |
| 5 | Skip System 1 after a winning System 1 breakout on the same market | Four losers removed in my test |
| 6 | Hard exit if open drawdown reaches the personal daily stop | Exit everything at 2,500 dollars |
Rule 6 saves funded accounts. The Turtle exit is slow by design, and a trend that reverses hard can give back most of the profit before the 10-day exit triggers. On a funded account, giving back 3,000 dollars of open profit can breach the trailing floor and end the account while the trade is still winning. My rule is a hard exit at a 2,500 dollar open drawdown from the day’s peak.
My worked trade: the 20-day breakout I actually took
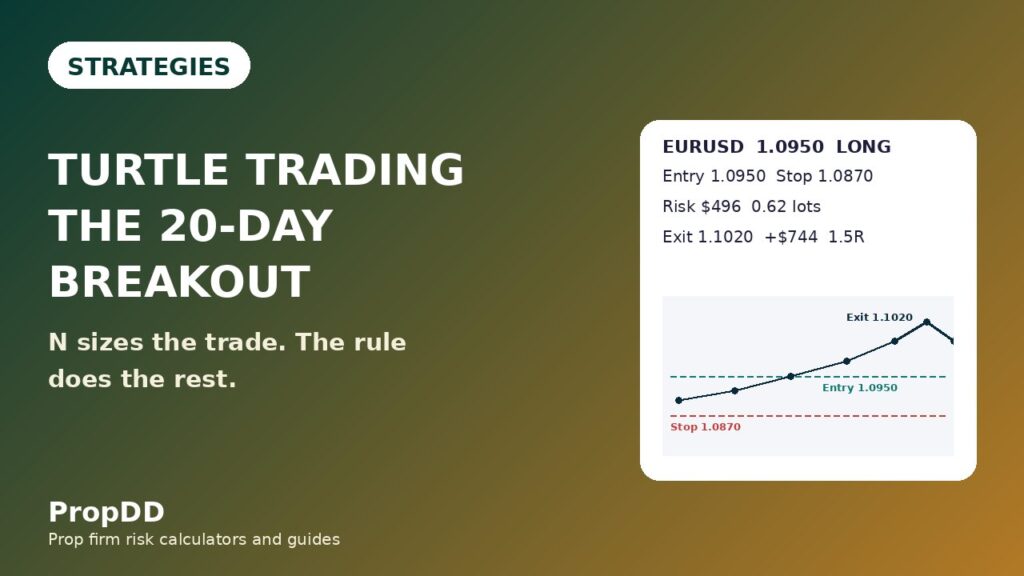
That week N sat at 40 pips and the 20-day high was 1.0950, and the skip rule said trade, because my last System 1 breakout had been a loser. I placed a buy stop at 1.0950 for 0.62 lots, stop 80 pips below at 1.0870, risk 496 dollars. Price broke out on Tuesday, ran to 1.0970, half N above my entry, and I added a second Unit, stop at 1.0890. The worst case after the add was 868 dollars, inside my 1,000 dollar cap. Price ran to 1.1060, pulled back, and broke the 10-day low at 1.1020. I closed both Units there.
| Leg | Price | Size | Result |
|---|---|---|---|
| Unit 1 entry | 1.0950, 20-day high break | 0.62 lots | Risk 496 dollars, stop 1.0870 |
| Unit 2 add | 1.0970, half N above entry | 0.62 lots | Risk 496 dollars, stop 1.0890 |
| Position stop | 1.0890 after the add | 1.24 lots | Worst case 868 dollars, inside the 1,000 cap |
| Exit | 1.1020, 10-day low break | Both Units | Unit 1 plus 434, Unit 2 plus 310, total plus 744 dollars |
The total was plus 744 dollars, 1.5 times my 496 dollar risk: Unit 1 gained 70 pips, 434 dollars; Unit 2 gained 50 pips, 310 dollars. The add added 310 dollars of profit, but it would also have added 372 dollars of loss on a reversal to the trailed stop. Pyramiding multiplies both directions, which is why the funded cap is two Units. I test every turtle trade against the max daily drawdown calculator before I place it.
Turtle trading vs turtle soup vs Donchian: same name, three different trades
Three articles on this site carry the word turtle, and they describe three different trades. Turtle trading is the original Dennis system: buy the 20-day breakout and ride the trend, sized by N, stopped at 2N, exited on the 10-day extreme. Turtle soup is Linda Raschke’s fade: wait for the same 20-day breakout, watch it fail by a few pips, and short the reversal back inside the range. The Donchian channel is the indicator underneath both: a 20-bar band that marks the breakout level, with no rules for size, stops or exits.
| Question | Turtle trading | Turtle soup | Donchian channel |
|---|---|---|---|
| What is it | A complete trend system | A false-breakout fade | An indicator, a price band |
| Entry | Buy the 20-day high break | Short the failed 20-day break | None |
| Stop | 2N, about 80 pips at N 40 | Above the failed high, about 15 pips | None |
| Size | N Unit, 0.62 lots funded | Fixed risk, 2.00 lots in my test | None |
| Exit | Opposite 10-day extreme | Back inside the range, 2R target | Opposite band touch |
| Hold time | Days to weeks | Minutes to hours | Band holds |
If you trade the turtle soup strategy, do not run both systems on the same market on the same day. A breakout that fails is a soup trade, and a breakout that holds is a turtle trade, and you cannot know which one it is until price decides. Running both means paying two spreads and two commissions on one idea. The Donchian channel guide shows the 20-bar entry and 10-bar exit the Turtles adapted.
Twelve trades with the skip rule: what the numbers say
I ran System 1 on EURUSD daily for twelve trades with the skip rule on, and the same twelve plus the four skipped signals with it off, all at 0.62 lots and a 496 dollar risk. One R is 496 dollars, rounded to 500 in the log.
| Trade | Date | Direction | Result in R | Dollars |
|---|---|---|---|---|
| 1 | 3 Nov | Long | +1.5 | +750 |
| 2 | 4 Nov | Long | +2.0 | +1,000 |
| 3 | 5 Nov | Short | -1.0 | -500 |
| 4 | 6 Nov | Long | +1.0 | +500 |
| 5 | 9 Nov | Long | +1.5 | +750 |
| 6 | 10 Nov | Short | -1.0 | -500 |
| 7 | 11 Nov | Long | +2.0 | +1,000 |
| 8 | 12 Nov | Long | +1.5 | +750 |
| 9 | 13 Nov | Short | -1.0 | -500 |
| 10 | 16 Nov | Long | +1.0 | +500 |
| 11 | 17 Nov | Short | +1.5 | +750 |
| 12 | 18 Nov | Long | -1.0 | -500 |
| Version | Trades | Wins | Net | Best day share |
|---|---|---|---|---|
| Skip rule on | 12 | 8 of 12, 66.7 percent | +8.0R, +4,000 dollars | 1,000 of 4,000, 25.0 percent, pass |
| Skip rule off | 16 | 8 of 16, 50.0 percent | +4.0R, +2,000 dollars | 1,000 of 2,000, 50.0 percent, fail |
| Filter worth | 4 trades removed | All four were losers | +4.0R, +2,000 dollars | Consistency fixed by the filter |
The filtered test made 4,000 dollars at a 66.7 percent win rate and 0.67R expectancy, and the best day was 1,000 dollars, 25.0 percent of the net, inside the 30 percent ceiling. The unfiltered test made the same eight winners but kept four extra losers, netting 2,000 dollars, and the same best day became 50.0 percent of the net, which fails the consistency rule outright. The skip rule did not find better trades; it removed bad ones.
When turtle trading fails on a funded account
Turtle trading fails in exactly the market it was never built for, and a funded account makes every failure more expensive. The system is a trend system, so a ranging market feeds it 20-day breaks that fail the next day, each costing a full 2N stop. The second failure is volatility: a news spike can double the true range for a day. The third is the trailing drawdown: a slow exit can give back a winner’s profit past the firm’s trailing floor. The fourth is the trader, adding a third Unit or moving the stop.
| Failure | What happens | Funded cost | Fix |
|---|---|---|---|
| Range whipsaw | Repeated 20-day breaks fail next day | Four stops, 2,000 dollars | Skip rule on |
| N spike after entry | True range doubles on news, stop too tight | Stopped at 496 dollars | No entries on NFP, CPI or rate days |
| Slow exit | 10-day exit gives back open profit | Trailing floor breach, account lost | Hard exit at 2,500 dollars open drawdown |
| Third Unit | Pyramiding past the funded cap | Worst case past 1,000 dollars | Two Units maximum, no exceptions |
| Moving the stop | Stop widened to avoid a loss | One loss becomes a daily limit breach | Stop set at entry, never moved except by the rule |
My daily turtle routine
The system takes ten minutes a day. I check the daily chart at 08:00 London, after the daily close has set the 20-day high and low, and I write down N, the breakout level, the Unit size and the stop before I look at price. If there is no breakout, there is no trade. If there is one, I check the skip rule, the news calendar and the open-risk total first. I check the position once at the New York open and once at the close. I never watch the trade tick by tick.
| Time | Action | Number checked |
|---|---|---|
| 08:00 London | Read N, breakout level, Unit size, stop | N 40 pips, Unit 0.62 lots, risk 496 dollars |
| 08:05 London | Check skip rule and news calendar | Last System 1 result, no NFP or CPI |
| 08:10 London | Place buy stop, set 2N stop, log the trade | Entry 1.0950, stop 1.0870, open risk 496 dollars |
| 13:30 London | New York open check, trail stop after an add | Position stop 1.0890, worst case 868 dollars |
| 21:00 London | Close check, log exit or hold, no new entries | 10-day low 1.1020, exit if touched |
Every Friday I re-read the log and check three numbers: the best day’s share of the net, under 30 percent; the open risk, under 1,000 dollars per market; and the signals skipped, because a week with no signals is normal for a 20-day system. The pyramiding guide covers the adding rules, the position sizing guide covers the Unit maths, the consistency rule guide explains the 30 percent ceiling, and my personal daily stop guide explains the 2,500 dollar exit.
Frequently asked questions
Is turtle trading the same as turtle soup?
No, they are opposite trades on the same level. Turtle trading buys the 20-day breakout and rides the trend with N-sized Units and a 2N stop. Turtle soup waits for the same breakout to fail by a few pips and shorts the reversal back inside the range. My turtle trade bought 1.0950 and exited at 1.1020 for plus 744 dollars.
Can I trade turtle rules on a 50,000 dollar account?
Yes, with the same maths at half the numbers. Risk 0.5 percent, 250 dollars, and the Unit at an 80 pip 2N stop is 0.31 lots, risking 248 dollars. The daily loss limit on a 50,000 dollar account is usually 2,500 dollars, so one Unit is still 10 percent of the limit.
Why does System 1 skip a breakout after a winner?
Because breakouts cluster. A winning breakout means the trend is already running, so the next breakout is chasing it. A losing breakout means the range is still intact, so the next breakout is the one that finally escapes. My test removed four trades, all losers, worth 2,000 dollars. System 2 has no skip rule.
What happens when N doubles overnight?
The Unit halves and the stop doubles, and the dollar risk stays the same. If N jumps from 40 to 80 pips, the funded Unit falls from 0.62 lots to 0.31 lots and the 2N stop widens from 80 to 160 pips, risking 496 dollars.
Does turtle trading work on gold and indices?
Yes. The original system traded commodities, bonds and currencies, not just forex. The maths is identical, only the point value changes: gold moves 10 dollars a pip per lot, and the DAX moves 1 euro a point per lot. Size from N first, then check the daily limit.
How many markets can I trade at once on a funded account?
Two, and only if they are not closely correlated. My funded rule is two Units in one market and two markets at once, with a 1,000 dollar open-risk cap per market. EURUSD and GBPUSD together count as one market, because they move together.
Risk disclaimer: Trading leveraged products on a funded account can lead to the loss of your challenge fee and your funded account. The turtle system is a trend-following method with long losing streaks in ranging markets, and past results, including the Turtles’ reported 80 percent annual returns, do not guarantee future results. This article is educational only and is not financial advice.



