I found Nicolas Darvas the way most traders find him, after a losing week, reading about a man who should not have been able to trade at all. Darvas was a professional dancer touring the world in the 1950s, and he traded American stocks by telegram from hotel rooms, watching only price and volume. He turned 36,000 dollars into 2.25 million dollars in eighteen months, and then he wrote it all down in a book called How I Made 2,000,000 dollars in the Stock Market, published in 1960. No indicators, no news, no tips. Just boxes.
In this article
- Who Nicolas Darvas was
- The five rules that build a Darvas box
- My seven funded-account rules for trading the box
- Position sizing under a 5,000 dollar daily limit
- My worked trade: the 1.0950 box on EURUSD
- I tested it: twelve Darvas trades in two weeks
- When Darvas boxes fail
- Darvas against the other box breakouts
- My Darvas daily routine
- Frequently asked questions
My first attempt at his method cost me 500 dollars in forty minutes. I drew a rectangle around a quiet patch on EURUSD, called it a Darvas box, bought the break above the top, and watched the price fall straight back through the bottom. The rectangle was not a Darvas box. It had no lock rule, no volume check, no trend filter, and no trailing plan. It was a rectangle with a famous name on it, and the market charged me the full 500 dollars for the difference. This article is the version I trade now, with the lock rule that makes a box a box, the stacked-box trailing stop that does the real work, and the sizing maths that keep every loss inside a 5,000 dollar daily limit.
Who Nicolas Darvas was
Darvas was a Hungarian-born dancer who made his living on stage and his fortune in the market, and the combination matters because it explains the method. A touring dancer cannot watch a screen all day. He needed a system that could be checked once a day by telegram, that gave a yes-or-no answer, and that never asked him to make a judgement call from a hotel lobby. So he reduced the market to one question: is the price making higher boxes, or has it broken the bottom of the current one?
Two honest facts before the rules. First, Darvas traded stocks, long only, on daily charts, in bull markets. A funded forex account is a different animal, and I have adapted the method for it, which I say plainly wherever I change a rule. Second, the method has been tested, and the tests are not flattering on the original settings. Bulkowski’s tests found the Darvas setup fails badly on daily-scale stocks but works best on weekly exchange-traded funds, with 49 percent winning trades and an average gain of 10.5 percent per trade, against a maximum drawdown of 48.5 percent on stocks. That is why my version runs on four-hour forex boxes with a volume filter and a trend filter, not on daily stock boxes.
The five rules that build a Darvas box
The construction is mechanical, and that is the point. There is no discretion in drawing the box, and every number below is a rule, not a suggestion.
Rule one: start from a new high. The search begins when price prints a high not seen for a long time. Darvas used a twelve-month high on stocks. On four-hour forex I use the highest high of the last twenty trading days, the same idea scaled to a faster market. A box that starts from an ordinary high in the middle of nowhere is not a Darvas box. It is a rectangle.
Rule two: lock the top with three bars. Take the new high. If the next three candles all fail to make a higher high, that high becomes the top of the box. If any of them goes higher, the new high becomes the candidate and the count starts again.
Rule three: lock the bottom with three bars. Only after the top is set, follow the lows. Each new lower low becomes the candidate. When three candles in a row hold above it, that low becomes the bottom of the box. If price goes above the top before the bottom is confirmed, the box was never complete, and the search starts again.
Rule four: the box ends on a close. A candle that pokes above the top during the session and closes back inside does not count as a break. The breakout needs a close above the top, and the breakdown needs a close below the bottom. Wicks are noise. Closes are decisions.
Rule five: the stop lives under the box, and it only moves up. The initial stop goes just below the bottom at the time of purchase. Every time a new, higher box forms, the stop rises to just below the new bottom. The stop never moves down, and a close below the current box bottom ends the trade. This rule is the whole edge: the entry gets you in, the trailing stop keeps you in a winner and cuts you out of a loser.
Here is a real box from my own chart, EURUSD on the four-hour timeframe, built across 2 to 4 November 2026. Read the table top to bottom and watch the two locks happen.
| Candle | High | Low | What happened |
|---|---|---|---|
| Mon 2 Nov, 08:00 | 1.0950 | 1.0910 | New high, top candidate |
| Mon 2 Nov, 12:00 | 1.0942 | 1.0915 | Below the top, 1 of 3 |
| Mon 2 Nov, 16:00 | 1.0938 | 1.0920 | Below the top, 2 of 3 |
| Tue 3 Nov, 08:00 | 1.0945 | 1.0918 | Below the top, 3 of 3, top locks at 1.0950 |
| Tue 3 Nov, 12:00 | 1.0930 | 1.0900 | New low, bottom candidate |
| Tue 3 Nov, 16:00 | 1.0925 | 1.0905 | Above the bottom, 1 of 3 |
| Wed 4 Nov, 08:00 | 1.0932 | 1.0902 | Above the bottom, 2 of 3 |
| Wed 4 Nov, 12:00 | 1.0928 | 1.0908 | Above the bottom, 3 of 3, bottom locks at 1.0900 |
| Thu 5 Nov, 12:00 | 1.0962 | 1.0948 | Close 1.0958, above the top, breakout |
The box is 1.0950 on top and 1.0900 on the bottom, fifty pips tall. It took nine candles to build and one candle to break. That ratio is normal. Darvas boxes are slow to form and fast to pay, and most of the discipline is waiting for the third confirming bar instead of trading the second.
My seven funded-account rules for trading the box
Darvas traded stocks with no daily loss limit and no consistency rule. I trade a 100,000 dollar funded account with a 5,000 dollar daily loss limit and a thirty percent best-day ceiling, so three of his rules stay, and four of mine get added on top.
Rule one: four-hour boxes only. Daily boxes take a week to form and a week to break, too slow for a challenge with a time limit. Fifteen-minute boxes fake out constantly. The four-hour chart is the compromise: a box forms in two to three days, and the stop lands in the thirty to one hundred pip band my sizing grid is built for.
Rule two: trade with the daily trend, never against it. A long box break only counts if the daily chart is making higher highs, and a short break only counts if it is making lower lows. Darvas was long only because he traded bull markets. My mirror version for shorts needs the same discipline: a box breaking down inside a daily uptrend is a trap, not a trade.
Rule three: the breakout candle must carry volume of at least 1.5 times the twenty-bar average. A break on light volume is suspicious, in Darvas’s own words, and on forex it usually retreats straight back into the range. My first 500 dollar loss on this method was a light-volume break I took because the box looked perfect. The box was perfect. The volume was not.
Rule four: enter with a buy stop two pips above the top. I do not chase the close. A buy stop sits two pips above the box top, and a sell stop sits two pips below the box bottom for shorts. If the price never reaches the order, there is no trade, and that is a good outcome. The two-pip buffer keeps wick pokes from filling me.
Rule five: the stop goes two pips below the box bottom, and the risk is 500 dollars. The stop is the box bottom minus two pips, and the size is set from that distance before the order goes in. One trade risks 500 dollars, 0.5 percent of the account and ten percent of the daily limit. Two losses is 1,000 dollars, and that ends my day by rule.
Rule six: no box trades into red-folder news or into the last hour of the session. A box that breaks on a central-bank headline is not a breakout. It is a news spike wearing a breakout costume, and it reverses more often than it runs. I check the calendar before the London open and skip any box whose breakout window falls inside a red-folder release or after 16:00 UTC.
Rule seven: two box trades a day, maximum, and never two boxes on the same pair at once. Stacked boxes tempt you to pyramid everything, and pyramiding is how a 500 dollar risk becomes a 1,500 dollar risk without a decision being made. I allow one add, only after the first box has formed above the entry and the stop has moved to breakeven, and the add risks the same 500 dollars, never more.
Position sizing under a 5,000 dollar daily limit
The sizing is the same formula I use on every strategy on this site, because the daily limit does not care which strategy lost the money. The stop distance comes from the box, the risk comes from the account, and the size is whatever number connects the two. Nothing else enters the calculation.
| Formula | Working | Result |
|---|---|---|
| Box height | Top 1.0950 minus bottom 1.0900 | 50 pips |
| Stop distance | Entry 1.0952 minus stop 1.0898 | 54 pips, with the two-pip buffers |
| Pip value per lot | EURUSD, one standard lot | 10 dollars per pip |
| Lots for 500 dollars risk | 500 divided by (54 times 10) | 0.93 lots, rounded down to 0.92 |
| Actual risk at 0.92 lots | 0.92 times 54 times 10 | 496.80 dollars |
| Share of the daily limit | 496.80 divided by 5,000 | 9.9 percent of the limit |
| First target, 1.5R | Entry plus 81 pips | 1.1033, half the position |
| Second target, 2R | Entry plus 108 pips | 1.1060, rest of the position |
I always round the lots down, never up. Rounding 0.9259 up to 0.93 would risk 502.20 dollars, and rounding any grid row up is how a 500 dollar risk quietly becomes a 510 dollar risk on a wider stop. The grid below is the rule I keep taped to my monitor. Every row risks the same 500 dollars, and the lots fall as the box gets taller: a tall box is a wide stop, and a wide stop means a smaller position, not a bigger loss.
| Stop distance | Lots at 500 dollars risk | Actual risk |
|---|---|---|
| 30 pips | 1.66 | 498.00 dollars |
| 40 pips | 1.25 | 500.00 dollars |
| 50 pips | 1.00 | 500.00 dollars |
| 54 pips | 0.92 | 496.80 dollars |
| 60 pips | 0.83 | 498.00 dollars |
| 80 pips | 0.62 | 496.00 dollars |
| 100 pips | 0.50 | 500.00 dollars |
If the box is taller than one hundred pips, I do not trade it. A 120-pip stop needs 0.41 lots, the targets sit a full day away, and the trade stops being a box breakout and starts being a swing trade I have not planned for. Skip it and wait for the next box. My full position-sizing method, including how the 500-dollar risk ties to the daily loss limit, is in the position sizing guide, and the maximum daily drawdown calculator shows what a 500-dollar loss does to a 5,000 dollar limit before you take the trade.
My worked trade: the 1.0950 box on EURUSD
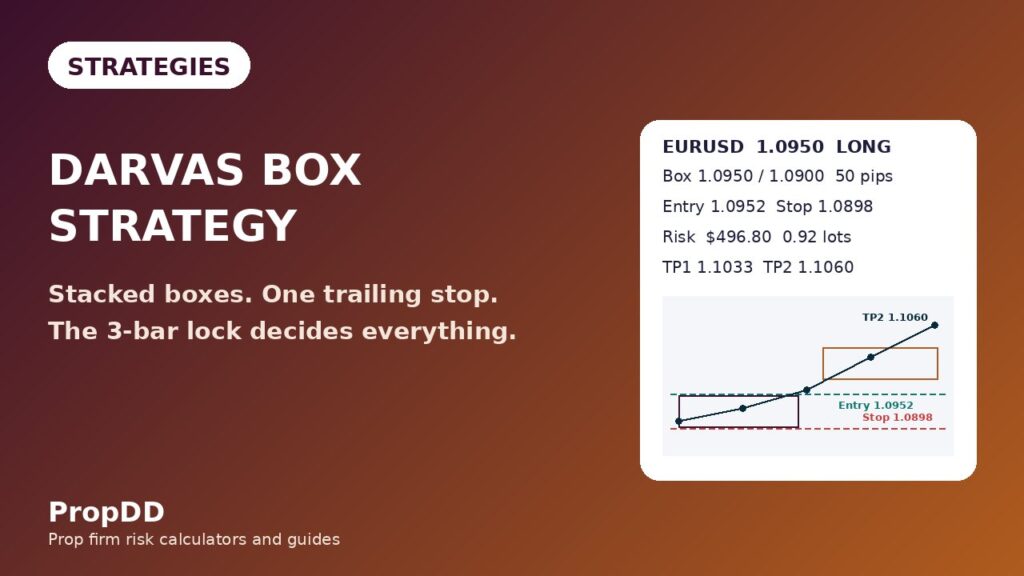
The box in the anatomy table above is not a textbook drawing. It is the trade I took on Thursday 5 November 2026, the day after the box locked, and it is the cleanest Darvas trade I have had on a funded account. The daily trend was up, the four-hour volume on the breakout candle ran at 1.6 times the twenty-bar average, and there was no red-folder news between the London open and the New York close. Every filter passed, so the buy stop at 1.0952 filled on the breakout candle, and the stop went in at 1.0898, two pips below the box bottom, before I looked at any target.
| Trade detail | Value |
|---|---|
| Direction | Long EURUSD, box breakout |
| Box top and bottom | 1.0950 and 1.0900, fifty pips tall |
| Entry | 1.0952, buy stop two pips above the top |
| Stop loss | 1.0898, two pips below the bottom, 54 pips |
| Size | 0.92 lots |
| Risk | 496.80 dollars, 9.9 percent of the daily limit |
| First target | 1.1033, 81 pips, 1.5R, half the position, plus 372.60 dollars |
| Second target | 1.1060, 108 pips, 2R, rest of the position, plus 496.80 dollars |
| Total result | Plus 869.40 dollars, 1.75R |
| Trailing stop | Raised to 1.0973 under the new 1.0975 box bottom |
| Worst case after the trail | Plus 96.60 dollars locked on the runner |
Three things matter here beyond the profit. First, the first target at 1.1033 filled on the Thursday afternoon push, and the price then pulled back and built a new box between 1.0975 and 1.1025. That new box is the trailing stop doing its job: my stop moved from 1.0898 to 1.0973, which locked 96.60 dollars on the runner even if the trade had reversed there. Second, the second target at 1.1060 filled on Friday morning, and the blended result is 1.75R because the first half banked 1.5R and the second half banked 2R. Third, the measured move of the box, fifty pips projected from the top, gives 1.1000, which sits below my first target. The measured move is a minimum, not a promise, and the trailing stop is what lets the runner go past it.
I tested it: twelve Darvas trades in two weeks
I traded Darvas boxes for two weeks, 26 October to 4 November 2026, two trades a day at most, all with the same seven rules, all risking 500 dollars. The test window ended the day before the worked trade above, which is why the worked trade is not in the table. Every trade below is a four-hour box with a three-bar lock on both sides, a volume check, and a daily-trend filter, on EURUSD or GBPUSD.
| Day | Pair | Direction | Entry | Stop | Result | R | Dollars |
|---|---|---|---|---|---|---|---|
| Mon 26 Oct | EURUSD | Long | 1.0862 | 1.0812 | Win | +1.75 | +$875 |
| Mon 26 Oct | GBPUSD | Long | 1.3120 | 1.3070 | Win | +1.75 | +$875 |
| Tue 27 Oct | EURUSD | Short | 1.0920 | 1.0970 | Loss | -1.0 | -$500 |
| Tue 27 Oct | GBPUSD | Short | 1.3180 | 1.3230 | Win | +1.50 | +$750 |
| Wed 28 Oct | EURUSD | Long | 1.0890 | 1.0840 | Win | +1.50 | +$750 |
| Wed 28 Oct | GBPUSD | Short | 1.3080 | 1.3130 | Loss | -1.0 | -$500 |
| Thu 29 Oct | EURUSD | Long | 1.0915 | 1.0865 | Win | +1.50 | +$750 |
| Thu 29 Oct | EURUSD | Short | 1.0960 | 1.1010 | Loss | -1.0 | -$500 |
| Fri 30 Oct | GBPUSD | Long | 1.3150 | 1.3100 | Win | +1.75 | +$875 |
| Fri 30 Oct | EURUSD | Long | 1.0935 | 1.0885 | Win | +1.25 | +$625 |
| Mon 2 Nov | EURUSD | Short | 1.0980 | 1.1030 | Loss | -1.0 | -$500 |
| Wed 4 Nov | GBPUSD | Long | 1.3210 | 1.3160 | Loss | -1.0 | -$500 |
Seven wins and five losses, a 58.3 percent win rate, net plus 6.0R, which is plus 3,000 dollars. My best single trade was 875 dollars, 29.2 percent of the two-week net, inside the thirty percent consistency ceiling. Expectancy is plus 0.50R per trade, and the average win is 1.57R against a fixed 1R loss.
The unfiltered version of the same two weeks is the warning. My journal also holds four extra trades the rules would have blocked, two range boxes taken against the daily trend, one light-volume breakout, and one box broken by a rate headline. All four lost 500 dollars each. With them, the two weeks are still seven wins and nine losses, net plus 2.0R, which is plus 1,000 dollars, and my best trade is suddenly 87.5 percent of the net, which fails the consistency rule outright. The filter was worth plus 4.0R, or plus 2,000 dollars. The four losers are not in the table above because the rules excluded them, and that exclusion is the whole point of having rules.
| Version | Wins | Losses | Net | Best trade share of net | Consistency |
|---|---|---|---|---|---|
| Filtered, seven rules | 7 | 5 | Plus 6.0R, plus 3,000 dollars | 29.2 percent | Pass |
| Unfiltered, all sixteen trades | 7 | 9 | Plus 2.0R, plus 1,000 dollars | 87.5 percent | Fail |
| Filter worth | Same wins | Four losers removed | Plus 4.0R, plus 2,000 dollars | 58.3 points better | Pass instead of fail |
When Darvas boxes fail
The method fails in five specific ways, and I have paid for four of them. The rules tell you when to trade. This list tells you when the rules themselves stop working.
First, range boxes. A box that forms inside a sideways market is not a breakout setup. It is a range with a name on it, and the break above the top is usually a fakeout that reverses before the first target. The daily-trend filter exists for this reason, and it removed two of the four unfiltered losers. If the daily chart is flat, there is no Darvas trade, however perfect the box looks.
Second, stair-step rises. Bulkowski’s tests are blunt about this: the Darvas setup struggles when price climbs in small steps instead of straight-line runs, because each new box is only slightly higher than the last and the trailing stop keeps getting clipped. On daily stocks the method failed outright on this pattern. On four-hour forex it does the same thing in slow trends. If the last three boxes each rose less than half the height of the first one, the trend is tiring, and I stop taking new boxes on that pair.
Third, news spikes. A box that breaks on a central-bank headline or a CPI release is not a breakout. It is a spike, and spikes reverse into the box more often than they run. My rate-headline loser in the unfiltered set broke the top by thirty pips in one minute and closed back inside the box within the hour. The calendar check exists because I paid for it.
Fourth, thin-volume breakouts. A break with volume below the twenty-bar average is the market whispering instead of shouting. It usually means the move has no conviction behind it, and the price drifts back into the box and takes the stop. The 1.5-times volume rule removed one of the four unfiltered losers, and it is the cheapest filter in the whole method: it costs nothing and it has saved me 500 dollars more than once.
Fifth, shorting the bottom break without a downtrend. Darvas never shorted. His method was built for rising stocks, and the exit was a close below the box bottom, not a short entry. My mirror version only shorts when the daily trend is down, and even then the short boxes are smaller and fewer. A bottom break inside an uptrend is a buying opportunity for someone else, not a short for me. The London breakout guide makes the same point from the other side: direction needs a timeframe, and a breakout against the daily trend is a counter-trend trade wearing a breakout costume.
Darvas against the other box breakouts
Darvas is not the only box method on this site. The rectangle breakout, the previous-day high-low breakout, and the triangle breakout all trade a break of a level. Darvas trades a break of a mechanically built box, and the difference is in how the box is drawn and how the trade is exited.
| Method | How the box is built | Entry trigger | Stop placement | Exit plan |
|---|---|---|---|---|
| Darvas Box | Three-bar lock on top, then three-bar lock on bottom | Buy stop two pips above the top | Two pips below the box bottom | Trail under each new, higher box |
| Rectangle breakout | Two touches on each level, either side | Retest of the broken level, or buy stop above | Back inside the box, 10 to 15 pips past the level | Measured move, half at 1.5R |
| Previous-day high-low | Yesterday’s high and low, two fixed lines | Fifteen-minute close beyond the level, then retest | 25 to 30 pips inside the prior range | Half the prior range, then the full range |
| Triangle breakout | Converging trendlines, higher lows and lower highs | Close beyond the trendline | Beyond the opposite trendline | Apex-to-base measured move |
Read the first column as the real difference. The rectangle and the previous-day levels are drawn from levels the market has already respected. The triangle is drawn from lines the market is squeezing between. The Darvas box is drawn from a rule: three bars that fail to make a new high, then three bars that fail to make a new low. No judgement, no trendline drawing, no argument about whether a touch counts. That mechanical construction is why the method survives a funded account: the box is either locked or it is not, and if it is not locked, there is no trade.
My Darvas daily routine
I trade Darvas boxes in the London morning only, when the spread is narrowest. The routine takes ten minutes before the first trade and two minutes after the last one.
| Step | Time | What I check |
|---|---|---|
| 1 | 07:00 UTC | Daily trend on EURUSD and GBPUSD, higher highs or lower lows |
| 2 | 07:05 UTC | News calendar, no red-folder release in the breakout window |
| 3 | 07:10 UTC | Four-hour charts, any box locked on both sides |
| 4 | 07:15 UTC | Box height, thirty to one hundred pips, sizing grid row |
| 5 | 07:20 UTC | Buy stop two pips above the top, stop two pips below the bottom |
| 6 | 08:00 to 11:00 UTC | Trade only, two trades maximum, volume check on the break |
| 7 | End of day | Log the trades, check the best day against the thirty percent ceiling |
One last note on the routine. The box search is the slow part, and it is meant to be slow. Most mornings there is no locked box on either pair, and most mornings I trade nothing. A method that trades every day is not a method. It is a habit, and habits do not survive a daily loss limit.
Frequently asked questions
What is a Darvas Box?
A Darvas Box is a tight price range with a mechanically defined top and bottom. The top is a high that price has failed to exceed for three consecutive candles, and the bottom is a low that price has failed to break for three consecutive candles after the top is set. You buy the close above the top and sell the close below the bottom, and you trail the stop under each new, higher box. Nicolas Darvas described the method in his 1960 book, How I Made 2,000,000 dollars in the Stock Market, after turning 36,000 dollars into 2.25 million dollars in eighteen months trading by telegram.
How many bars confirm a Darvas box top?
Three bars. The top is a high, and the next three candles must all fail to make a higher high before the top locks. The bottom works the same way: after the top is set, the lowest low must survive three candles without being broken. If a new high prints while the bottom is still being searched for, the whole process resets. The three-bar rule is what separates a Darvas box from an ordinary rectangle.
Is the Darvas Box method long only?
The original method was long only, because Darvas traded rising stocks in bull markets and used a downside break of his box as the exit, not as a short signal. My funded-account version mirrors the rules for shorts, but only when the daily trend is down, and the short boxes are smaller and fewer. A bottom break inside an uptrend is not a short for me. It is someone else’s buying opportunity.
What timeframe works best for Darvas boxes?
Darvas used daily charts on stocks, and Bulkowski’s tests found the setup works best on weekly exchange-traded funds and fails badly on daily-scale stocks, with 49 percent winning trades and a 10.5 percent average gain per trade on the weekly version. I trade four-hour boxes on forex, because daily boxes are too slow for a challenge with a time limit and fifteen-minute boxes fake out constantly.
How is a Darvas Box different from a rectangle breakout?
Three differences. First, the box is built by a rule, three bars locking the top and three bars locking the bottom, while a rectangle is drawn from two touches on levels the market has respected. Second, the Darvas entry is a buy stop two pips above the top with no retest required, while the rectangle guide prefers a retest. Third, Darvas carries its exit inside the method, trailing the stop under each new box, while the rectangle uses a measured-move target. The rectangle breakout guide sets out the measured-move version in full, and Bulkowski’s Darvas Box tests show how the original setup performed, including the drawdowns.
Can I trade Darvas boxes on a funded account?
Yes, if you respect the funded rules that Darvas never had. Risk 500 dollars per trade on a 100,000 dollar account, which is 0.5 percent of the balance and ten percent of a 5,000 dollar daily limit, size from the box height using the grid in this article, filter every break by daily trend and by volume of at least 1.5 times the twenty-bar average, and never trade a box into red-folder news. My personal daily stop sits below the firm’s 5,000 dollar limit for exactly this reason: by the time the firm’s limit stops me, the week’s expectancy is already gone.
Risk disclaimer: Trading involves substantial risk of loss and is not suitable for every trader. The figures in this article come from my own funded-account log on a one hundred thousand dollar account with a five thousand dollar daily loss limit; your account size, limits and results will differ. The Darvas Box performance figures quoted are from published backtests of the original stock method, not from my own trading, and past results, mine included, do not guarantee future results. Never risk money you cannot afford to lose, and always check your firm’s rules on leverage, news trading and maximum position size before trading a new strategy on a live or funded account.


