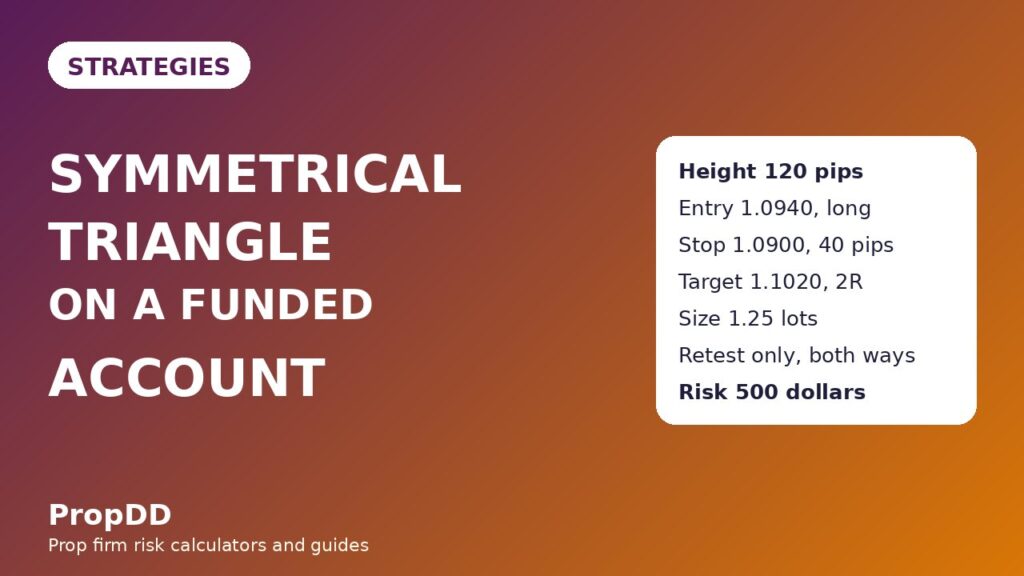
I lost a funded account to a triangle that broke both ways. It was a Tuesday afternoon, EURUSD had been squeezing for two days between falling highs and rising lows, and when price finally pushed above the upper trendline I bought the breakout candle at the top of its range. Price fell straight back inside the triangle, stopped me out, then broke down through the lower trendline an hour later without me — the second breakout was the real one, and I had spent my daily risk on the fake first one. I had read the pattern correctly and traded it wrong, and that distinction cost me the account. The next time the same shape appeared, I did the opposite of everything I had done before: I waited for the breakout to close, waited again for the retest, and only then entered, in whichever direction the retest confirmed, with a stop beyond the last swing inside the pattern and a size calculated from that stop, not from my confidence. That trade paid 1.5R, and the symmetrical triangle has been a funded-account strategy of mine ever since — but only in the retest form, and only with the filters in this guide.
In this article
- What a symmetrical triangle is, and why funded traders like it
- The six rules that make a triangle valid
- Entry, stop loss, take profit and session filter, in both directions
- Position-sizing maths under a daily loss limit
- A worked trade, from squeeze to second target
- The sizing grid: turning a triangle stop into a lot size
- I tested it: retest trades against breakout chasing
- When the strategy fails
- How the symmetrical triangle fits prop firm rules
- Frequently asked questions
This guide covers the symmetrical triangle in full: what the pattern is, the six rules that make it valid, the exact entry, stop loss, take profit and session filter I use for both directions, the position-sizing maths under a 5,000-dollar daily loss limit, a worked EURUSD trade with every number shown, a sizing grid, a fourteen-trade test against unfiltered breakout chasing, when the strategy fails, and how it fits prop firm consistency and drawdown rules. Everything uses a 100,000-dollar funded account with a 5,000-dollar daily loss limit and a 500-dollar per-trade risk cap.
What a symmetrical triangle is, and why funded traders like it
A symmetrical triangle is a consolidation pattern with two converging edges. The top edge falls: each rally tops out lower than the last, because sellers are stepping in earlier every time. The bottom edge rises: each pullback bottoms out higher than the last, because buyers are doing the same. Neither side is winning, and the space between them narrows until one side gives way. Unlike its cousins, the symmetrical triangle has no built-in direction: the ascending triangle guide covers a flat ceiling with rising lows that usually breaks up, while the symmetrical form breaks either way, and that neutrality is exactly what makes it dangerous for funded traders. A trader who picks a direction before the breakout is guessing, and guessing is how a daily limit gets spent on the first fake move.
Funded traders like this shape for a reason that has nothing to do with win rates: it gives you a stop location before you enter, in either direction. On a long, the last higher low is a natural invalidation point; on a short, the last lower high plays the same role. If price falls back through that point after breaking out, the pattern has failed, and you are out for a known, capped loss. That is the opposite of a breakout chased at the top of a candle, where the stop is a guess and the loss is whatever the market decides. The triangle breakout guide covers the family in general, while this guide is only about the symmetrical form, traded on a retest, in the direction the breakout confirms. The MyFundedCapital triangle patterns guide is a useful external check on the same point: a valid triangle needs at least four reversal points, two touches on each trendline, before it is anything more than a shape on a screen.
| Pattern element | What it looks like | Worked example, EURUSD H1 |
|---|---|---|
| Falling highs | Each rally tops out lower than the last | 1.0980, then 1.0960, then 1.0940 |
| Rising lows | Each pullback bottoms higher than the last | 1.0860, then 1.0885, then 1.0910 |
| Height | First high minus first low of the pattern | 1.0980 minus 1.0860, or 120 pips |
| Apex | Where the two trendlines would meet | Breakout arrived before the apex, in the final third of the pattern |
| Volume shape | Contracting during formation, expanding on the breakout | Tick volume fading into the squeeze, then a clear expansion on the breakout close |
One caution belongs here. A symmetrical triangle that forms after a long, one-way trend is not the same trade as one that forms mid-trend. The pattern is a continuation shape more often than a reversal shape, which means a breakout in the direction of the prior trend is the higher-quality trade, while a breakout against the trend needs the retest and the volume expansion to be convincing, not just present. I still take against-trend breakouts, but only when every filter below passes — a breakout against the trend with a weak retest is a pass, not a setup, and passing is the most profitable funded-account skill there is.
The six rules that make a triangle valid
Most symmetrical triangles on a live chart are not tradeable, and the six rules below are how I decide which ones are. A pattern that fails any of the first four is not a setup; it is a shape on a screen, and I leave it alone. Rules five and six are about execution, and they are the ones that protect a funded account when the pattern itself is genuine.
| Rule | Requirement | Why it exists |
|---|---|---|
| 1. Two touches each side | At least two highs on the falling trendline and two lows on the rising trendline | One touch per side is a wedge of noise, not a pattern |
| 2. Converging edges | Highs falling and lows rising toward a shared apex | Parallel edges are a range, and ranges are traded differently |
| 3. Breakout close | A full candle closes outside the trendline, not just a wick | Wicks through a trendline are the most common fakeout in this pattern |
| 4. Breakout position | The breakout comes before the apex, ideally in the final third of the pattern | Breakouts at the apex itself are weak and reverse most often |
| 5. Retest entry | Wait for price to return to the broken trendline and hold | The retest gives a tight, pattern-defined stop instead of a chased entry |
| 6. One trade only | One attempt per pattern; a failed retest ends the setup | Re-entering a failed pattern is how one loss becomes three |
Rule three deserves emphasis, because it is where I lost that first account. A wick above the upper trendline that closes back inside the triangle is not a breakout; it is sellers defending the falling edge one more time, and buying it means entering at the worst price in the pattern with a stop that has no logic behind it. I now require the close, and I require it on H1 or H4 — M15 closes outside a trendline are noise, and noise is not a pattern. Rule six is equally strict: if the retest fails and the stop is hit, the pattern is dead, and I do not flip to the other direction on the same triangle. A failed long breakout does not automatically make a short valid; it makes the pattern untradeable, and I wait for the next one.
Entry, stop loss, take profit and session filter, in both directions
The full strategy, in the order I execute it, is short enough to write on a sticky note, and that is deliberate. A funded strategy with twelve conditions never survives a live morning; this one has six rules for validity and four numbers for execution, and the numbers are all set before the entry, never adjusted after it. The table gives both directions, because a symmetrical triangle strategy that only works long is half a strategy.
| Execution step | Long rule | Short rule | Worked value |
|---|---|---|---|
| Entry | Retest of the broken upper trendline, entered when price holds above it | Retest of the broken lower trendline, entered when price holds below it | Long at 1.0940, after the breakout close above 1.0935 and a retest that held |
| Stop loss | Below the last higher low, minus a 10-pip buffer | Above the last lower high, plus a 10-pip buffer | Last higher low 1.0910, stop at 1.0900, or 40 pips of risk |
| Take profit 1 | Half the position at 1R | Half the position at 1R | 1.0980, 40 pips above entry, half off for 250 dollars |
| Take profit 2 | Rest of the position at 2R, before the full measured target | Rest of the position at 2R, before the full measured target | 1.1020, 80 pips above entry, rest off for 500 dollars |
| Measured target | Breakout point plus pattern height, used as a ceiling, not a promise | Breakdown point minus pattern height, used as a ceiling, not a promise | 1.0935 plus 120 pips, or 1.1055 — just beyond take profit 2 |
| Session filter | London and New York sessions only; no Asia-session breakouts | Same filter, both directions | Breakout and retest both inside 08:00 to 17:00 London time |
| News filter | No entry within 30 minutes of a red-folder release on the pair | Same filter, both directions | Skip the setup entirely if CPI or a central-bank decision lands inside the window |
Two choices in that table need explaining. First, take profit 2 sits at 2R, slightly short of the measured target of 1.1055. That is a funded-account choice, not a maths error: the measured target is a projection, and banking the second half at 2R locks in a known result instead of giving back a winning trade while waiting for a textbook number. Second, the Asia-session ban. Symmetrical triangles that break out in the thin Asian session routinely fall back inside the pattern when London opens, and a retest entry taken in Asia is often just a breakout chase with a nicer name. If the breakout and retest both happen in London or New York hours, the pattern has real volume behind it; if they happen overnight, I wait for the next pattern.
The stop placement is the heart of the strategy, and it is worth stating plainly. The stop goes beyond the last swing inside the pattern, not below the whole pattern and not a round number below the entry. Beyond the last higher low means the pattern has genuinely failed if it is hit — price has fallen through the rising floor that defined the setup. A stop below the pattern’s first low, 1.0860, would be 80 pips of risk and would need a small position to stay inside the cap; a stop 20 pips below the entry would be arbitrary and would get wicked out by the retest itself. The 10-pip buffer beyond the last higher low exists because retests wick: a stop exactly at 1.0910 invites a stop-hunt into the level, while 1.0900 gives the retest room to breathe without changing the logic of the trade.
Position-sizing maths under a daily loss limit
Every symmetrical triangle trade on a funded account is sized backwards from the stop, and the stop is set by the pattern, not by the trader. The formula is the same one the Max Daily Drawdown Calculator applies, and it has exactly three inputs: the risk cap, the stop distance in pips, and the pip value. On EURUSD, one standard lot is worth 10 dollars per pip, so the maths is clean — and the rule that governs it is absolute. If the pattern’s stop needs more size than the cap allows, you take less size or skip the trade; you never move the stop to make the size work.
| Sizing input | Value | How it is derived |
|---|---|---|
| Risk cap per trade | 500 dollars | 10 percent of the 5,000-dollar daily loss limit |
| Stop distance | 40 pips | Entry 1.0940 minus stop 1.0900 |
| Pip value | 10 dollars per pip per lot | EURUSD standard lot |
| Position size | 1.25 lots | 500 dollars / (40 pips x 10 dollars) |
| Actual risk | 500 dollars | 40 pips x 10 dollars x 1.25 lots, exactly at the cap |
| Share of daily limit at risk | 10 percent | 500 dollars / 5,000-dollar daily loss limit |
Rounding down is not a detail; it is the rule. The maths here happens to divide cleanly, but most triangles do not, and the grid below rounds every row down. Rounding up by even a fraction of a lot puts dollars over the cap on every trade, for no reason. Funded accounts are lost by small, repeated overages as often as by large single losses, because an overage on a winning trade teaches the trader that the cap is negotiable, and the next overage happens on a losing trade. The same discipline applies to the short side: the stop sits above the last lower high, the distance sets the size, and the cap never negotiates.
A worked trade, from squeeze to second target
Here is the complete trade, so the maths can be checked rather than trusted. The pattern formed on EURUSD H1 inside an uptrend: falling highs at 1.0980, 1.0960 and 1.0940, rising lows at 1.0860, 1.0885 and 1.0910, and a breakout candle that closed above the upper trendline at 1.0935 in the London session. Price returned to the broken trendline, held above it, and I entered the retest at 1.0940. The stop went below the last higher low, the first target took half at 1R, and the rest ran to 2R, just short of the measured target.
| Trade input | Value | How it is derived |
|---|---|---|
| Pattern height | 120 pips | 1.0980 minus first low 1.0860 |
| Breakout point | 1.0935 | Upper trendline at the breakout close |
| Measured target | 1.1055 | 1.0935 plus 120 pips, a ceiling, not the exit |
| Entry, retest long | 1.0940 | Broken trendline held as support on the retest |
| Stop loss | 1.0900 | Last higher low 1.0910 minus 10-pip buffer |
| Risk distance | 40 pips | Entry 1.0940 minus stop 1.0900 |
| Position size | 1.25 lots | 500 dollars / (40 pips x 10 dollars) |
| Risk at entry | 500 dollars | 40 pips x 10 dollars x 1.25 lots |
| Target 1, half off | 1.0980, plus 250 dollars | 40 pips x 10 dollars x 0.625 lots |
| Target 2, rest off | 1.1020, plus 500 dollars | 80 pips x 10 dollars x 0.625 lots |
| Total result | Plus 750 dollars | 250 plus 500, or 1.5R on a 500-dollar risk |
| Share of daily limit at risk | 10 percent | 500 dollars / 5,000-dollar daily loss limit |
The split exit matters here, and it pairs with the same logic as the partial closes guide. Taking half at 1R banks 250 dollars and removes the psychological pressure to babysit the trade; the second half then has room to reach 2R without the trader moving the stop by hand. If price had reversed after target 1, the second half would have exited at the stop for a 250-dollar loss on that half, leaving the trade roughly flat instead of a full loss — that is the retest entry and the split exit doing their combined job. A single fixed target at the measured 1.1055 would have paid more on this one trade and less across a month of trades, because it gives back winners that stall just short of a textbook number.
The sizing grid: turning a triangle stop into a lot size
Not every symmetrical triangle gives a neat 40-pip stop. Keep this grid beside your platform and size from it instead of guessing, and run every row through the Max Daily Drawdown Calculator before you click. Every row uses the same 500-dollar risk cap, rounded down, and the rule behind the grid is absolute: if the triangle’s stop needs more size than the cap allows, you take less size or you skip the trade.
| Entry to stop | Risk per lot | Size at 500-dollar cap | Actual risk |
|---|---|---|---|
| 30 pips | 300 dollars | 1.66 lots | 498 dollars |
| 40 pips | 400 dollars | 1.25 lots | 500 dollars |
| 50 pips | 500 dollars | 1.00 lot | 500 dollars |
| 60 pips | 600 dollars | 0.83 lots | 498 dollars |
| 80 pips | 800 dollars | 0.62 lots | 496 dollars |
Two rows deserve a second look. At a 30-pip stop, the raw maths gives 1.667 lots, and rounding down to 1.66 leaves 2 dollars of unused risk — that is correct, not a mistake. At an 80-pip stop, the size falls to 0.62 lots, which feels small for a triangle that took days to form, but it is the only size that keeps the trade inside the cap. A triangle stop that is too wide for your cap is not a reason to tighten the stop; it is a reason to trade smaller or not at all, and the break and retest guide makes the same point for range breakouts generally: the pattern sets the stop, the cap sets the size, and neither negotiates with the other.
I tested it: retest trades against breakout chasing
A worked trade proves the maths, not the approach. So I logged symmetrical triangle trades over several weeks and scored them twice: once taking every breakout candle as an entry, in either direction, and once taking only the retest entries in this guide, in London or New York hours, with the split exit above. The filter is deliberately simple — touches, close, retest, split exit — because a filter with six conditions never survives a live morning.
| Test | Trades | Winners / Losers | Net result |
|---|---|---|---|
| Every breakout candle, no filter | 12 | 4 / 8 | Minus 4R = minus 2,000 dollars |
| Retest entries only, with all filters | 14 | 9 / 5 | Plus 9R = plus 4,500 dollars |
The filtered log breaks down as five winners at 2R and four at 1R, or 14R won, against five losers at 1R, or 5R lost: 14R minus 5R is plus 9R, or plus 4,500 dollars at 500 dollars per trade. The best single trade is 900 dollars, which is 20 percent of the net — inside the 30 percent consistency ceiling most firms apply, as the consistency rule guide explains. The unfiltered log made 4R from four winners against 8R lost, a net of minus 4R. The difference is not better pattern-reading; it is eight fewer fakeouts, because a wick through a trendline is not a breakout and a breakout without a retest is not an entry. On the symmetrical triangle, the retest is worth more than the pattern, because the pattern is neutral and the retest is what picks the direction.
When the strategy fails
Every failure below is one I have watched happen, and each one breaks a specific funded rule rather than just losing money. The pattern is consistent: the symmetrical triangle fails funded traders when they trade the shape instead of the rules, or when they let a winning pattern talk them into a second attempt after the first one has already failed.
| Failure mode | What happens | The funded-account cost |
|---|---|---|
| Buying the breakout candle | Entry at the top of the range, then price falls back inside | Full 1R loss on a trade the retest would have avoided entirely |
| Trading a wick as a breakout | Price closes back inside the triangle, the pattern never confirmed | Repeated small losses that look like bad luck and are actually bad rules |
| Picking a direction early | Long before the breakout, then the triangle breaks down | The daily risk spent on a guess, and the real move missed |
| Asia-session breakouts | Thin-volume break, then London reverses it | A stop-out before the real session even starts, and a wasted day |
| Re-entering after a failed retest | The pattern is dead, but the trader trades its ghost | One loss becomes two or three, and the daily limit goes with them |
| Flipping direction on the same triangle | A failed long becomes an unplanned short on a dead pattern | A second full-risk loss on a setup that no longer exists |
The flipping failure deserves its own warning, because it is unique to neutral patterns. On a one-way pattern, a failed breakout ends the trade. On a symmetrical triangle, a failed breakout tempts the trader to reverse, on the logic that the other direction must now be the real one. It is not. A triangle that breaks up, fails, and falls back inside has shown that neither side has control, and the next move is as likely to be a range as a breakdown. The rule is simple: one pattern, one attempt, one direction — the direction the retest confirms, not the direction the trader hoped for.
How the symmetrical triangle fits prop firm rules
The strategy fits funded accounts because every rule in it maps to a rule the firm already enforces. The daily loss limit is protected by the 500-dollar risk cap and the one-trade-per-pattern rule: two trades cannot stack into a 1,000-dollar day, because the second trade on the same pattern is forbidden. The consistency rule is protected by the split exit, which banks half at 1R and keeps any single trade at or below 1.5R on a full win — well inside the best-day ceiling, as the fourteen-trade test showed with a 20 percent best trade. Trailing drawdown is protected by the same split exit: banking half early means an unrealised gain is locked before a reversal can drag the trailing limit up and then trigger it, the exact trap that ends funded accounts on breakout trades held too long. And the pattern itself is news-safe by construction, because the 30-minute news filter keeps entries away from the releases that widen spreads and slip stops. None of this makes the triangle profitable on its own; it makes it survivable, and on a funded account, survivable is what profitable is built from.
Frequently asked questions
How many touches make a symmetrical triangle valid?
At least four reversal points: two touches on the falling upper trendline and two on the rising lower trendline. Three touches on one side and two on the other is stronger, but fewer than two on either side is not a pattern — it is two lines drawn through noise, and no funded risk should ride on it.
Do I trade the breakout in the direction of the prior trend only?
Not only, but with a preference. Breakouts with the prior trend are the higher-quality trade, because the pattern is usually a continuation shape. Against-trend breakouts are still tradeable, but only when the close, the retest and the volume expansion all pass — if any one of them is weak, pass on the trade.
What if price breaks out but never retests?
Then there is no trade. A breakout that runs without a retest is a missed move, not a lost opportunity, and chasing it means entering at the worst price with a stop that has no pattern behind it. Funded accounts are kept by the trades skipped, and this is the most common skip in the whole strategy.
Where exactly does the stop go on a short trade?
Above the last lower high, plus a 10-pip buffer — the mirror of the long rule. If price rises back above that point after breaking down, the pattern has failed, and the loss is capped at the risk you sized from that distance before entering.
Can I trade this pattern on M15?
I do not. The breakout close must come on H1 or H4, because M15 closes outside a trendline are noise and produce fakeouts at a rate no risk cap can survive. M15 is fine for watching the retest form, but the pattern itself is read on H1 or H4.
How does this differ from the ascending triangle?
The ascending triangle has a flat ceiling and rising lows and usually breaks up; the symmetrical triangle has both edges converging and breaks either way, so it needs two-way rules and a strict ban on picking a direction early. The ascending form is covered in its own guide, and the two should never be traded as if they were the same setup.
Risk disclaimer: Trading leveraged products carries a high level of risk and may not be suitable for all investors. This guide is educational only and is not financial advice. Never risk more than you can afford to lose, and always check your prop firm’s current rules before trading any strategy on a funded account.



2 comments
[…] way to stop confusing them: the ascending triangle strategy, the falling wedge strategy, and the symmetrical triangle strategy. The single test that separates a rising wedge from an ascending triangle is the top line. If the […]
[…] “floor” is usually just a pause inside a range, and ranges punish breakout traders. My symmetrical triangle guide covers the converging version of this shape, where both edges slope inward and the breakout […]