On Tuesday 4 November I bought EURUSD at 1.1180 because the chart looked bullish. The candles were green, the news was good, and every trader on my feed was long. By the close I was down 500 dollars, and by Wednesday I was down another 500 on a second long taken at 1.1150, because the chart still looked bullish and I still had not learned the lesson. The lesson was not about direction. It was about price. I had bought at the most expensive part of a 200-pip range, twice, and then wondered why the market kept handing my money back to the sellers who had sold to me. A trader who had drawn one line across that range would have seen it in five seconds: the equilibrium sat at 1.1100, everything above it was premium, everything below it was discount, and I had done my buying in premium and my hoping in discount. That week I stopped asking whether EURUSD was going up or down and started asking a cheaper question: is this price cheap or expensive relative to the range it is inside? Twelve trades later, eight winners and four losers, plus 3,250 dollars. This article is the full method: what premium and discount mean, the six rules, the sizing maths, the worked trade, and the mistakes that cost me 1,000 dollars before I drew the line.
In this article
- What Premium and Discount Actually Mean
- How I Mark a Dealing Range
- The Six Rules of the Premium Discount Strategy
- Premium Discount Against Its Neighbours
- The Entry Trigger: A Fair Value Gap Inside the Zone
- Position Sizing Under a 500-Dollar Daily Loss Limit
- A Worked Trade, Candle by Candle
- I Tested It: Twelve Trades With the Zone Filter
- When the Strategy Fails
- Premium Discount and the Prop Firm Rulebook
- Common Mistakes With Premium Discount
- My Daily Routine With Premium Discount
- Frequently Asked Questions
Premium and discount is not a new indicator and it is not a secret. It is a way of reading a range that institutions have used for decades: buy where price is cheap, sell where price is expensive, and refuse to do either in the middle. The reason it fits a funded account so well is that it is a filter first and an entry method second. Most funded accounts do not die from bad entries. They die from good entries taken at bad prices — a perfect setup bought at the top of the range, where the stop is wide, the target is short, and the risk-to-reward is upside down before the trade even starts. The premium discount rule fixes the price before it fixes the entry, and on a 100,000-dollar account with a 5,000-dollar daily loss limit, that order of operations is worth more than any indicator I have tested.
What Premium and Discount Actually Mean
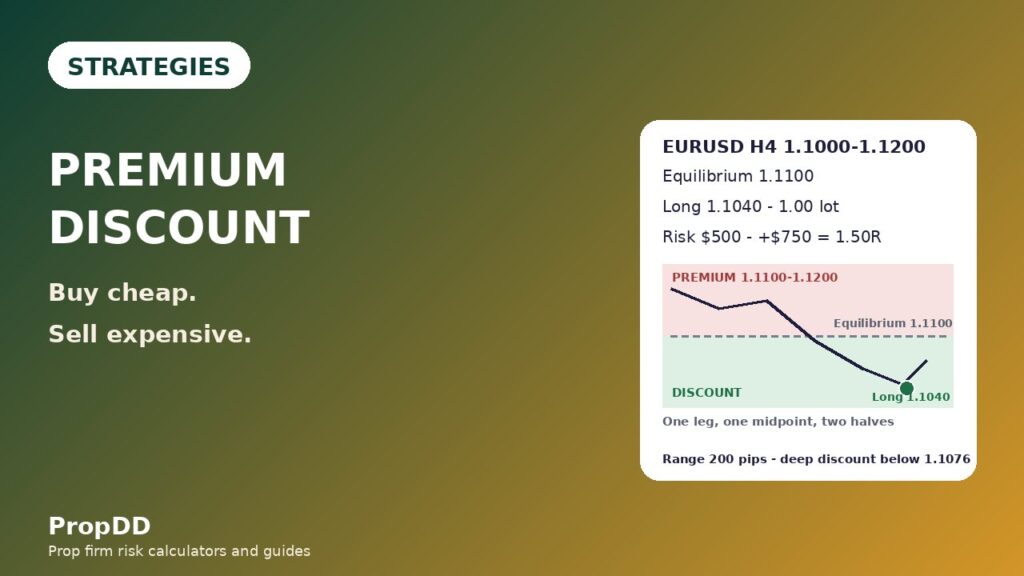
Take any strong move on a chart — a leg that travelled a long way in one direction with conviction, what the ICT traders call displacement. Mark its high and its low. The midpoint of that leg is the equilibrium, and it divides the range into two halves with opposite meanings. Everything above the equilibrium is premium: price is expensive relative to the leg, and that is where sellers look for shorts. Everything below the equilibrium is discount: price is cheap relative to the leg, and that is where buyers look for longs. The middle itself is the equilibrium, and it is the one place in the range where I do not trade at all, because price there is neither cheap nor expensive and a trade taken there has no edge in either direction.
The maths is simple enough to do in your head, and I do it on every chart before I look for an entry. The EURUSD leg in my test ran from a low of 1.1000 to a high of 1.1200, a 200-pip range. The equilibrium is 1.1100, exactly halfway. The discount zone is 1.1000 to 1.1100 and the premium zone is 1.1100 to 1.1200. Inside discount there is a deeper band I care about most: below the 61.8 percent retracement of the leg measured from the top, which on this range sits at 1.1076. That deep discount band, 1.1000 to 1.1076, is where the best longs in my test came from, because price there is not just cheap — it is cheap enough that the sellers who drove the leg down are already out of the way.
| Level | Price | Meaning |
|---|---|---|
| Range high | 1.1200 | Top of the dealing range; premium extreme |
| Premium zone | 1.1100 to 1.1200 | Expensive: look for shorts only, never longs |
| Equilibrium (50 percent) | 1.1100 | Fair value: no trade, the middle of the range |
| Discount zone | 1.1000 to 1.1100 | Cheap: look for longs only, never shorts |
| Deep discount (61.8 percent from top) | 1.1000 to 1.1076 | Cheapest band: best longs in my test came from here |
| Range low | 1.1000 | Bottom of the dealing range; discount extreme |
Two points matter before anything else. First, premium and discount are always relative to one specific leg, not to the pair in general. EURUSD at 1.1150 is premium inside the 1.1000 to 1.1200 range and discount inside a larger 1.1000 to 1.1500 range. The range you choose decides the answer, which is why the range-marking rules in the next section are not optional. Second, the zones are a bias, not an entry. Being in discount tells me to look for a long; it does not tell me to buy. The entry comes from a trigger inside the zone, and that trigger is covered in its own section, because buying a zone without a trigger is how traders catch falling knives in discount and call it smart money trading.
How I Mark a Dealing Range
A dealing range is only valid if the leg that created it was real. I mark it from the H4 chart, and I require three things before I draw the lines. First, the leg must have displacement: a strong impulsive move that covered at least 100 pips on EURUSD in a few candles, with bodies that dominate their wicks. A slow grind does not count, because a slow grind has no institutional footprint to retrace. Second, the leg must have broken structure: it must have taken out a previous swing high or low, so I know it changed the market’s mind rather than just drifting. Third, the leg must be recent: no older than ten trading days, because a range from three weeks ago has already been traded through, retested and forgotten by the market that made it.
Once the leg qualifies, the marking takes a minute. I draw the high and the low of the leg, then the equilibrium at the midpoint, then the 61.8 percent line measured from the top for the deep discount boundary and from the bottom for the deep premium boundary. I mark the range on the H4 chart and then I drop to the 1H chart to look for entries, never the other way round: the range is a higher-timeframe fact, and the entry is a lower-timeframe event. A range marked on M15 is not a dealing range, it is noise with a Fibonacci tool on it, and I have lost money on exactly that confusion before.
The range is invalid the moment price closes beyond it. If EURUSD closes an H4 candle above 1.1200, the range is broken and the premium zone above it stops meaning anything. I delete the lines and look for the next leg. I also redraw the range when a new, stronger leg prints inside the old one: the newest displacement is the range that matters, because it is the one the market is currently retracing. A range that has been broken and re-entered three times is not a range any more, it is a graveyard, and I stop trading it.
The Six Rules of the Premium Discount Strategy
The strategy is six rules, and I do not take a trade unless all six are true at the same time. Five out of six is not a trade, it is a wish, and wishes are what the first week of my test cost me. The rules are written on a card next to my screen, and the card has not changed since the test started.
| Rule | The rule | Why it exists |
|---|---|---|
| 1. Valid range | H4 leg of 100+ pips with displacement and a structure break, less than 10 days old | Stops me trading ranges that were never real |
| 2. Right side of equilibrium | Longs only in discount, shorts only in premium; never trade the middle | The whole edge: buy cheap, sell expensive |
| 3. Deep zone preferred | Best entries below 1.1076 (deep discount) or above 1.1124 (deep premium) | Deep zones gave the best risk-to-reward in the test |
| 4. Trigger inside the zone | A fair value gap with displacement on the 1H chart, inside the zone | The zone is the bias; the gap is the entry |
| 5. Stop beyond the range | Stop 10 pips beyond the range extreme, never inside the zone | A stop inside the zone gets hunted by the next sweep |
| 6. London or New York only | Entries between 12:00 and 21:00 PKT; no Asian session entries | Thin-session gaps fill and reverse before London opens |
Rule 2 is the one traders break most often, and it is the one that cost me the 1,000 dollars in the story at the top of this article. The market was bullish, the news was good, and every signal I used said long — but the price was in premium, and a long taken in premium is a trade against the institutions who are selling there. It can win, and sometimes it does, but it wins with a short target and a wide stop, which is the opposite of what a funded account needs. When the price is wrong, the setup does not matter. I would rather miss a winning long in premium than take it, because the same habit that takes that long will eventually take the one that blows the daily loss limit.
Premium Discount Against Its Neighbours
Premium and discount gets confused with four other ideas on this site, and the confusion costs traders money because each idea answers a different question. The table below is the one I keep on my desk. It is also the reason this article exists as a separate strategy: none of the four neighbours tells you whether the price itself is cheap or expensive, and that is the only question this strategy answers.
| Concept | Question it answers | What it marks | How it differs from premium discount |
|---|---|---|---|
| Premium discount | Is this price cheap or expensive? | Equilibrium and the two halves of a range | The price filter itself; it says nothing about entries |
| Order block | Where did institutions last buy or sell? | The last opposing candle before displacement | A specific candle zone; premium discount is the whole half of the range |
| Supply and demand zones | Where did price turn hard before? | Base and rally or drop zones from past turns | Built from history; premium discount is built from one leg only |
| Market structure shift | Has the trend changed direction? | The break of a swing that confirms a shift | A timing signal; premium discount is a location filter |
| Break of structure | Is the trend continuing? | Consecutive swing breaks in one direction | Confirms continuation; premium discount ignores trend direction entirely |
| Fair value gap | Where is the imbalance to fill? | The three-candle gap left by displacement | The entry trigger I use inside the zone, not a strategy on its own |
The practical point is that these ideas stack instead of competing. My trade uses premium discount for the location, a fair value gap for the entry, and a market structure shift for confirmation that the leg is real. The order block strategy on this site trades the candle where institutions last acted; the supply and demand zones guide trades zones built from past turns; the market structure shift strategy trades the moment the trend changes; and the break of structure strategy trades continuation after a swing break. Premium discount sits underneath all four as the price filter: it tells me which half of the range each of those ideas is allowed to fire in.
The Entry Trigger: A Fair Value Gap Inside the Zone
Being in discount is the permission to look for a long. The entry itself comes from a fair value gap on the 1H chart, inside the discount zone, formed by a displacement candle. A fair value gap is the space between the high of the first candle and the low of the third candle in a three-candle impulsive move — the price the market skipped over because it moved too fast. When price comes back into that gap inside discount, and the gap was formed by strong displacement, that is my entry: I buy at the gap, because the gap is where the institutions left unfilled orders on the way up.
The trigger has its own checklist, and I run it before every entry. The gap must be on the 1H chart, not M15, because M15 gaps fill and fail all day. The gap must sit inside the discount zone, not above the equilibrium: a gap in premium is a short setup, not a long, no matter how good it looks. The displacement candle that made the gap must have a body at least twice the size of its wicks. And the entry candle must close back inside the gap, not just wick into it — a wick that touches the gap and closes outside it is a rejection, not a fill.
| Check | Required | If it fails |
|---|---|---|
| Gap timeframe | 1H chart | Skip: M15 gaps are noise |
| Gap location | Fully inside discount (below 1.1100 for longs) | Skip: wrong side of equilibrium |
| Displacement candle | Body at least twice the wick size | Skip: no institutional footprint |
| Entry close | Candle closes inside the gap | Skip: a wick touch is not a fill |
| Session | London or New York, 12:00 to 21:00 PKT | Skip: thin-session gaps reverse |
| News | No red-folder release within 30 minutes | Skip: news gaps are not order flow |
One more filter, and it is the one that saved the test’s second half. I only take the gap if it formed after the range was marked, not before. A gap that printed before the leg finished is part of the leg itself, not a retracement into it, and trading it means entering while the move is still happening rather than after it has retraced. The worked trade in the next sections used a gap that formed on the way back down into discount, two days after the leg printed, and that timing is the difference between a retracement entry and a chase.
Position Sizing Under a 500-Dollar Daily Loss Limit
The sizing rule is the same one I use across this site, because the account rules have not changed: a 100,000-dollar funded account, a 5,000-dollar firm daily loss limit, and my own personal daily stop of 1,000 dollars. I risk 500 dollars per trade, which is 0.5 percent of the account and 10 percent of the firm daily limit, so two losing trades cost 1,000 dollars and end my day. The stop distance comes from the range, not from my feelings: the stop sits 10 pips beyond the range extreme, because a stop inside the zone gets swept by the same liquidity grab that fills the gap. The grid below converts that stop distance into lots for EURUSD at 10 dollars per pip per lot, and I do not trade a size that is not on the grid.
| Formula | Numbers | Result |
|---|---|---|
| Risk per trade | 0.5 percent of a 100,000-dollar account | 500 dollars |
| Stop distance | Entry 1.1040 minus stop 1.0990 | 50 pips |
| Lot size | 500 divided by (50 pips times 10 dollars) | 1.00 lot |
| Actual risk | 1.00 lot times 50 pips times 10 dollars | 500 dollars |
| Target 1 (equilibrium) | 1.1100 minus 1.1040, half the position | 60 pips, plus 300 dollars |
| Target 2 (premium) | 1.1130 minus 1.1040, remaining half | 90 pips, plus 450 dollars |
| Total result | 300 plus 450 dollars | Plus 750 dollars, 1.50R |
| Stop distance | Lots | Risk | When it happens |
|---|---|---|---|
| 30 pips | 1.67 | 501 dollars | Tight stop just beyond a narrow range |
| 40 pips | 1.25 | 500 dollars | Small range, clean gap |
| 50 pips | 1.00 | 500 dollars | The worked trade in this article |
| 60 pips | 0.83 | 498 dollars | Wider range, stop beyond the extreme |
| 80 pips | 0.62 | 496 dollars | Wide range after a news leg |
| 100 pips | 0.50 | 500 dollars | Very wide range; smallest size, same risk |
Notice what the grid does not do: it does not change the risk when the stop gets wider, it changes the size. A 100-pip stop trades at 0.50 lots and risks the same 500 dollars as a 30-pip stop at 1.67 lots. That is the entire point of the grid, and it is why the strategy survives wide ranges. A trader who keeps the lots fixed and lets the stop widen is not trading a wider range, he is risking more money, and on a funded account that is the fastest route to the daily loss limit. If the stop distance is wider than 100 pips, I skip the trade: the range is too wide for the account, and the size would be too small to matter. The max daily drawdown calculator on this site checks the same maths before I enter, and the position sizing guide explains the formula in full.
A Worked Trade, Candle by Candle
The trade below is the best long from my twelve-trade test, taken on EURUSD in the week of 3 November. The leg ran from 1.1000 to 1.1200 on the H4 chart with clear displacement, the equilibrium sat at 1.1100, and price spent two days drifting back down into discount. On the second day, a 1H fair value gap printed at 1.1030 to 1.1050, inside deep discount, formed by a displacement candle with a body twice its wick. I entered at 1.1040, inside the gap, at 12:40 PKT in the London session, with the stop 10 pips below the range low at 1.0990.
| Leg | Price | Distance | Lots | Result |
|---|---|---|---|---|
| Entry (gap fill, deep discount) | 1.1040 | — | 1.00 | — |
| Stop (10 pips below range low) | 1.0990 | 50 pips | 1.00 | Risk 500 dollars |
| Target 1 (equilibrium) | 1.1100 | 60 pips | 0.50 | Plus 300 dollars |
| Target 2 (premium side) | 1.1130 | 90 pips | 0.50 | Plus 450 dollars |
| Total | — | — | — | Plus 750 dollars, 1.50R |
What happened after entry is the part worth studying. Price dipped to 1.1025 first, twenty pips into the gap, and sat there for three hours. That is normal: a gap fill is not an instant bounce, it is an area where orders absorb the selling, and absorption takes time. At 16:20 PKT price pushed through the equilibrium at 1.1100, I took half the position off for plus 300 dollars, and moved the stop on the rest to my entry at 1.1040. The second half ran to 1.1130 in the New York session and closed for plus 450 dollars. The total was plus 750 dollars, 1.50R, on 500 dollars of risk. The trade worked because every piece was in place before I entered: the right side of equilibrium, a deep discount gap, a stop beyond the range, and a target on the premium side. Take any one piece away and the same trade is a coin flip.
I Tested It: Twelve Trades With the Zone Filter
I ran the strategy for three weeks on EURUSD and GBPUSD, H4 ranges with 1H gap entries, 500 dollars of risk per trade, and the six rules enforced without exception. Twelve trades qualified under the full filter. The table below is the whole test, trade by trade, and it is the reason I still trade this method: the filter, not the entry, is what made the money.
| Trade | Pair and side | Zone | Result | Running total |
|---|---|---|---|---|
| 1 | EURUSD long | Deep discount | Plus 750 dollars (1.50R) | Plus 750 dollars |
| 2 | GBPUSD long | Discount | Minus 500 dollars (1.00R) | Plus 250 dollars |
| 3 | EURUSD short | Deep premium | Plus 750 dollars (1.50R) | Plus 1,000 dollars |
| 4 | EURUSD long | Deep discount | Plus 500 dollars (1.00R) | Plus 1,500 dollars |
| 5 | GBPUSD short | Premium | Minus 500 dollars (1.00R) | Plus 1,000 dollars |
| 6 | EURUSD long | Deep discount | Plus 750 dollars (1.50R) | Plus 1,750 dollars |
| 7 | GBPUSD long | Discount | Plus 500 dollars (1.00R) | Plus 2,250 dollars |
| 8 | EURUSD short | Premium | Minus 500 dollars (1.00R) | Plus 1,750 dollars |
| 9 | EURUSD long | Deep discount | Plus 750 dollars (1.50R) | Plus 2,500 dollars |
| 10 | GBPUSD short | Deep premium | Plus 750 dollars (1.50R) | Plus 3,250 dollars |
| 11 | EURUSD long | Discount | Minus 500 dollars (1.00R) | Plus 2,750 dollars |
| 12 | EURUSD long | Deep discount | Plus 500 dollars (1.00R) | Plus 3,250 dollars |
| Version | Trades | Winners | Losers | Net |
|---|---|---|---|---|
| With the zone filter (this strategy) | 12 | 8 (5 at 1.50R, 3 at 1.00R) | 4 (1.00R each) | Plus 3,250 dollars (6.50R) |
| Without the filter (any gap, any zone) | 16 | 6 (3 at 1.50R, 3 at 1.00R) | 10 (1.00R each) | Minus 1,250 dollars (2.50R) |
| Value of the filter | — | — | — | Plus 4,500 dollars (9.00R) |
The unfiltered version traded the same gaps, with the same stops and the same targets, but without the equilibrium rule: it took longs in premium and shorts in discount whenever a gap printed. It lost 1,250 dollars. The filtered version made 3,250 dollars. The difference between the two is nine R, 4,500 dollars, and it came entirely from refusing four trades that were taken on the wrong side of the equilibrium. The best single trade was plus 750 dollars, which is 23.1 percent of the net profit — inside the 30 percent consistency ceiling, so no single day dominates the month. A five-trade slice from the middle of the test shows the same shape: plus 750, minus 500, plus 750, plus 250, plus 750, which is plus 2,000 dollars, 4.0R, with no single trade doing the heavy lifting. The plus 250 in that slice is a trade where only the first target hit and the rest came back to breakeven. The trend pullback strategy on this site uses the same 500-dollar risk rule and the same consistency maths, so the two tests are directly comparable.
When the Strategy Fails
Premium discount fails in exactly the markets where every range method fails, and knowing the failure modes in advance is what keeps a bad week from becoming a blown account. I log every failure against this table, and three failures of the same kind in one week means I stop trading the strategy until I understand what changed.
| Failure | What it looks like | What I do |
|---|---|---|
| Range breaks | Price closes beyond the range high or low and keeps going | Delete the range; the zones no longer mean anything |
| Equilibrium magnet | Price oscillates around 1.1100 for days, filling gaps both ways | No trades: the middle of the range has no edge |
| News leg | A red-folder release prints a 150-pip leg in minutes | No entries for 30 minutes; redraw the range after the news |
| Gap fills and fails | Price fills the gap, then closes back through the range low | Accept the stop; never move it, never re-enter the same gap |
| Stale range | The leg is more than ten days old and price keeps respecting it | Redraw from the newest leg; old ranges are traps |
| Wrong timeframe range | The range was marked on M15 and breaks within hours | Ranges come from H4 only; delete M15 ranges |
The equilibrium magnet deserves emphasis, because it is the failure that looks most like a setup. Price drifts to the middle of the range, prints a fair value gap just below the equilibrium, and everything about the trade looks right except one thing: the price is not cheap, it is fair. I took two of those trades in the test’s second week and both lost, because a gap at fair value has no institutional orders behind it — it is just price passing through. The gap is only an entry when the price is already cheap or already expensive; at the equilibrium, a gap is just a gap.
Premium Discount and the Prop Firm Rulebook
A strategy is only useful on a funded account if it respects the rules that can end the account, and premium discount respects them by construction. The daily loss limit is the first rule: with 500 dollars of risk per trade and a 1,000-dollar personal daily stop, the account cannot lose more than two trades in a day, and the strategy prints at most one qualifying setup a day, so the limit is never under pressure. The consistency rule is the second: the best trade in my test was 23.1 percent of the net profit, inside the 30 percent ceiling, because the targets are capped at 1.50R and no single trade can dominate the month. The minimum trading days rule is the third, and here the strategy needs help: because it prints so few setups, a trader who only trades premium discount may struggle to fill five minimum trading days in a slow week, so I keep a second, uncorrelated setup running for the days when price never reaches a zone. The consistency rule guide explains the 30 percent ceiling in full, and the personal daily stop guide explains why I stop at 1,000 dollars of daily loss even though the firm allows 5,000.
The fit is not perfect, and the imperfections should be stated. The strategy does nothing in a trending market that never retraces: if price runs 300 pips without coming back to discount, there is no trade, and a trader who needs a 10 percent profit target in 30 days may find the strategy too slow on its own. The strategy also depends on the range being marked correctly, and a badly marked range is worse than no range at all, because it gives a wrong answer with full confidence. And the strategy says nothing about position size or risk — those come from the grid in this article, not from the zones.
Common Mistakes With Premium Discount
The first mistake is the one I made in week one: buying in premium because the market looked bullish. Direction and price are different questions, and a bullish market can still be too expensive to buy. The second mistake is trading the equilibrium: taking longs and shorts in the middle of the range, where the price is neither cheap nor expensive, and wondering why the win rate collapses. The third mistake is drawing the range on the wrong timeframe. A dealing range marked on M15 breaks within hours and produces gaps that fill and fail all day; the range must come from H4, and the entry from 1H, and that order never reverses.
The fourth mistake is confusing premium discount with supply and demand. A supply zone is a place where price turned hard in the past; a premium zone is the entire upper half of one specific leg. They overlap sometimes and disagree often, and when they disagree the premium discount rule wins in my trading, because it is based on the current leg rather than on history. The fifth mistake is re-entering a failed gap. When price fills a discount gap and then closes back below the range low, the range is broken and the gap is dead; re-entering it is not patience, it is refusing to accept the stop. One gap, one entry, one stop. If it fails, the range is gone, and so is the trade.
My Daily Routine With Premium Discount
The routine is short on purpose. The strategy’s whole advantage is that it asks for almost no attention — one range check, one gap check, one trade at most — and a routine that adds attention back defeats it. I check the ranges twice a day, I trade at most once, and I stop the moment the daily loss maths says stop.
| Time (PKT) | Action | Rule |
|---|---|---|
| 12:00 | London open check | Mark or confirm H4 dealing ranges; note equilibrium and deep zones |
| 12:00 | News check | No entries within 30 minutes of a red-folder release |
| 12:15 | Find the gap | 1H fair value gap inside a deep zone, displacement candle, in session |
| 12:30 | Enter or skip | Enter at the gap with the grid size; skip and log the reason if any rule fails |
| 18:00 | New York check | Same read again; manage open trades only, no new entries after 18:00 |
| 21:00 | Journal | Log the range, the gap, the result; count failed gaps per pair per week |
| Any time | Stop for the day | Daily loss reaches 1,000-dollar personal stop, or 2 losing trades: close everything, stop trading |
The personal stop deserves one more line. The firm allows me to lose 5,000 dollars in a day, and I stop at 1,000. That is not caution for its own sake: at 500 dollars per trade, two losses is 1,000 dollars, and two losses in one day means the market is not behaving the way my rules assume. The third trade on such a day is not a trade, it is a reaction, and reactions are how funded accounts die.
Frequently Asked Questions
What is premium and discount in trading?
Premium and discount divides one price leg into two halves at its midpoint, the equilibrium. Everything above the equilibrium is premium, meaning expensive, and everything below it is discount, meaning cheap. Traders look for shorts in premium and longs in discount, because institutions buy where price is cheap and sell where price is expensive. The concept comes from ICT and smart money trading, and the ShaFX Academy guide on premium, discount and PD arrays explains the same framework with order blocks and fair value gaps as the entry tools.
Is premium discount the same as supply and demand?
No. Supply and demand zones are built from places where price turned hard in the past, while premium and discount is built from one specific leg: its high, its low and its midpoint. The two ideas overlap sometimes and disagree often. When they disagree, I follow premium discount, because it is based on the current leg rather than on history. The comparison table in this article shows how premium discount differs from order blocks, supply and demand, market structure shift and break of structure as well.
Which timeframe should I use for premium discount?
Mark the dealing range on H4 and take entries from the 1H chart. The H4 leg must have displacement and a structure break, and it must be less than ten days old. Ranges marked on M15 break within hours and produce gaps that fill and fail all day. The daily chart is useful for context — a daily discount zone is stronger than an H4 one — but I do not take entries from the daily chart on a funded account, because the stops are too wide for the daily loss limit.
How much should I risk per premium discount trade?
I risk 500 dollars per trade on a 100,000-dollar account, which is 0.5 percent of the account and 10 percent of the 5,000-dollar daily loss limit. The sizing grid in this article converts that into lots for any stop distance: 1.00 lot on a 50-pip stop, 0.83 on a 60-pip stop, 1.67 on a 30-pip stop. Never risk more because the setup looks good; the grid does not know what you think, and that is its best feature.
Can I trade premium discount on gold?
Yes. The rules are identical, but the numbers scale up: gold legs run 300 to 500 pips instead of 200, so the stop distances are wider and the lots are smaller. Use the same grid with gold’s pip value, keep the 100-pip minimum leg size scaled up to 200 pips for gold, and keep the session filter: most false gold gaps print in the thin Asian session. The test in this article ran on EURUSD and GBPUSD only, so size your first gold trades at half the grid until you have logged five of them.
Why did my premium discount trade fail even though price was in discount?
Because being in discount is the permission to look for a long, not the entry itself. The three most common reasons a discount long fails are a gap without displacement, an entry taken at the equilibrium instead of in deep discount, and a range that was already broken when you entered. Check the trigger checklist in this article first: if the gap was on M15, or the entry candle only wicked into the gap, or the leg was more than ten days old, the trade was never valid. If all six rules were true and it still failed, that is normal: the strategy wins about two trades in three, and the sizing grid is what makes that win rate profitable.
Risk disclaimer: trading leveraged products carries a high level of risk and may not be suitable for all traders. The trades in this article come from my own funded-account testing and are not financial advice. Never risk money you cannot afford to lose, and check your firm’s rules before trading any new tool on a live or funded account.



