On Tuesday 3 November I bought GBPUSD three times in four hours, and all three trades stopped out before the New York open. The pair had been in a clean uptrend all week, printing higher highs and higher lows, and the last higher low sat at 1.2740. Price broke below it to 1.2722 in the London session, and I treated the break as a dip. I bought the first push back to 1.2735, stopped out. I bought the second at 1.2728, stopped out. I bought the third at 1.2730, stopped out. By 13:00 PKT I was down 1,500 dollars on a 100,000-dollar account with a 5,000-dollar daily loss limit, and I had not broken a single rule except the one that mattered: I never once asked what the break actually was. The break below 1.2740 was not a dip, it was a market structure shift, the first sign the uptrend was ending.
In this article
- The Tuesday I Kept Buying the Dip
- What a Market Structure Shift Actually Is
- MSS vs Break of Structure vs Liquidity Sweep vs Order Block
- The Six Rules I Trade the Shift By
- The Sizing Formula: Risk 500 Dollars, Never More
- The Worked Trade: A Short That Paid 1,500 Dollars
- The Sizing Grid: Every Stop Distance, One Risk
- Twelve Trades With the Filters On
- The Same Twelve Trades Without the Filters
- When the Shift Fails
- My Daily MSS Routine
- Frequently Asked Questions
That evening I went back to the chart and counted what really happened. The higher low at 1.2740 was the low that had produced the last higher high at 1.2795. When price closed an hourly candle below 1.2740, the sequence of higher highs and higher lows broke for the first time in six sessions. The pair then fell to 1.2630 over the next two days, a hundred and ten pips, while I sat in three stopped-out longs. I traded the market structure shift for three weeks after that Tuesday: twelve trades, eight winners, four losers, plus 5,750 dollars with my filters on, and minus 1,250 dollars without them. This article is the full plan I now trade: what the shift is, the six rules, the sizing maths, and the twelve trades that prove the filters are worth 7,000 dollars.
The Tuesday I Kept Buying the Dip
Tuesday 3 November started with GBPUSD already pressing a level from the wrong side. The uptrend had printed higher highs at 1.2760 and 1.2795, and the higher low between them was 1.2740. By the London open the pair was sitting eight pips below that higher low, and every instinct I had said dip. My plan that morning was simple and wrong: buy the return to 1.2740, stop below the sweep low, ride it back to 1.2795. I did not check the hourly close. I did not wait for displacement. I just bought the green candles under a line that had already failed.
| Trade | Entry | Stop | Size | Loss |
|---|---|---|---|---|
| 1 — Long the first return to 1.2735 | 1.2735 | 1.2720, 15 pips | 3.33 lots | 500 dollars |
| 2 — Long the second push to 1.2728 | 1.2728 | 1.2713, 15 pips | 3.33 lots | 500 dollars |
| 3 — Long the third touch of 1.2730 | 1.2730 | 1.2715, 15 pips | 3.33 lots | 500 dollars |
| Total | 1,500 dollars |
Three trades, three stops, 1,500 dollars gone. That is 30 percent of my 5,000-dollar daily loss limit and 60 percent of my 2,500-dollar personal daily stop, spent before lunch on one idea: that a break below a higher low is a buying opportunity. The chart that evening told the real story. The hourly close below 1.2740 was the shift, the next candle was a strong bearish displacement candle down to 1.2705, and the retest of 1.2740 held as resistance twice before price fell to 1.2630. The dip buyers paid for the move. The shift traders took it. The pattern I needed was not another breakout system. It was a rule for telling a continuation break from a reversal break, and that rule is the market structure shift.
What a Market Structure Shift Actually Is
A market structure shift, usually shortened to MSS, is the first break of the swing point that made the last high or low. In an uptrend, price makes higher highs and higher lows. The shift happens when price breaks and closes below the higher low that produced the highest high. In a downtrend it is the mirror image: price breaks and closes above the lower high that produced the lowest low. That single close is the earliest evidence that the side in control has lost it. A wick through the level is not a shift, only a full hourly close beyond it counts.
The shift works because of where the stops sit. In an uptrend, buyers place their stops just below the higher low, and sellers place theirs just above the higher high. When price sweeps above the high it collects the sellers’ stops, and when it then breaks and closes below the higher low, the buyers’ stops become selling fuel for the move down. The sweep is the liquidity event, the close is the proof, and the displacement candle that follows is the confirmation that real flow has changed sides. On a funded account that sequence matters twice over: the shift gives me a fixed invalidation level before I enter, and the retest gives me an entry with a known stop. I never trade the shift candle itself. I trade what price does after it.
| Step | What happens | GBPUSD Tuesday example |
|---|---|---|
| 1 — The sweep | Price pushes past the prior swing high or low and collects stops | High 1.2795 swept to 1.2808, 13 pips above |
| 2 — The shift | An hourly candle closes beyond the higher low or lower high | Hourly close at 1.2732, below the 1.2740 higher low |
| 3 — The displacement | A strong candle in the new direction, body at least 1.5 times the hourly ATR | Bearish candle to 1.2705, 27 pips, 1.9 times the 14-pip hourly ATR |
| 4 — The retest | Price returns to the order block or fair value gap left by the displacement | Retest of 1.2740 held as resistance twice, then price fell to 1.2630 |
| 5 — The invalidation | An hourly close back above the displacement high kills the trade | Hourly close above 1.2808 means the shift failed |
Two details keep me out of trouble. The shift has to happen on the hourly chart or higher, because a fifteen-minute close below a higher low is noise more often than signal, and the displacement candle has to be real: a body of at least one and a half times the hourly average true range, which on GBPUSD is about fourteen pips, so a twenty-one pip body is the minimum. A small-bodied drift below the level is a pause, not a shift. The full sequence, sweep then shift then displacement then retest, is laid out in the GetLogify market structure shift guide, which is the source I checked my own rules against before writing this article.
MSS vs Break of Structure vs Liquidity Sweep vs Order Block
The market structure shift has cousins on this site, and the difference between them is the difference between a trade and a loss. Break of structure, the liquidity sweep and the order block all involve price breaking a level. What separates them is which level breaks, in which direction, and what confirms it. I trade all four, but I never mix up their rules, because an MSS entry taken on a break-of-structure setup has the wrong direction and the wrong stop.
| Setup | Level broken | Direction | Confirmation | Entry |
|---|---|---|---|---|
| Market structure shift | The higher low or lower high | Against the trend | Hourly close beyond it, then displacement | Retest of the order block or gap |
| Break of Structure | The prior swing high or low | With the trend | Hourly close beyond it | Retest of the broken level |
| Liquidity Sweep | Any pool of stops | Either | The sweep itself, no close required | On the sweep candle, aggressively |
| Order Block | The last candle before a displacement | Either | Displacement away from the block | Retest of the block zone |
The practical difference is what the break means. A break of structure says the trend is continuing, so I trade with it. A market structure shift says the trend is ending, so I trade against it, and only after the displacement proves the new side has real flow. The order block is not a setup on its own in my plan, it is the entry zone the shift leaves behind: the last up-close candle before the bearish displacement, or the last down-close candle before the bullish one. The swing failure pattern is the closest relative, a sweep and a close back inside, but it needs no displacement and no higher-timeframe bias, so it fires two or three times a day while a clean shift fires two or three times a week. Frequency is not edge, and the filters in this article are what turn a common event into a tradeable one.
The Six Rules I Trade the Shift By
Six rules, no exceptions, and I write them on the same sticky note as my sizing grid. A setup that breaks any one of them is not a setup, it is a story I am telling myself about a chart. The rules exist because every one of them was paid for: rule one cost me the Tuesday losses, rule three cost me a 900-dollar winner I chased into a news spike, and rule five cost me a funded account review in my first month.
| Rule | The rule | Why it exists |
|---|---|---|
| 1 — Higher timeframe bias first | The 4-hour structure sets the direction, the hourly shift only fires with it | A shift against the 4-hour trend is a counter-trend guess |
| 2 — Sweep before the shift | The prior extreme is swept before the level breaks | A break with no sweep collected no stops, so no fuel follows |
| 3 — Hourly close confirms | A full hourly candle closes beyond the higher low or lower high | A wick through the level is noise, the close is the proof |
| 4 — Displacement follows | The next candle is a strong body, at least 1.5 times the hourly ATR | Without displacement there is no flow behind the shift |
| 5 — Enter only on the retest | Enter at the order block or fair value gap retest, never on the shift candle | The retest is where the trapped traders exit |
| 6 — No news for 30 minutes | No trade 30 minutes either side of red-folder news, one shift trade per pair per session | News moves ignore levels and eat stops |
Rule five is the one traders argue about, so let me be plain about the cost. Entering on the retest means I miss the first leg from the shift to the block, which on Tuesday was about thirty pips. What I buy with those thirty pips is confirmation that the level now holds as resistance, a stop that sits beyond a real extreme instead of a guess, and a trade I can size properly because the stop distance is known before I enter. The traders who enter on the shift candle get the full move when it works and a stop hunt when it does not, and on a funded account the second outcome costs more than the first one pays.
The Sizing Formula: Risk 500 Dollars, Never More
Every market structure shift trade on my funded account risks the same amount: 500 dollars, which is 0.5 percent of the 100,000-dollar account and 10 percent of the 5,000-dollar daily loss limit. The stop distance changes with every setup, so the position size changes with it. The formula is one division, and I do it before I enter, never after.
| Step | Calculation | Result |
|---|---|---|
| 1 — Risk per trade | 0.5 percent of a 100,000-dollar account | 500 dollars |
| 2 — Stop distance | Entry 1.0948 to stop 1.0973 | 25 pips |
| 3 — Pip value | One lot of EURUSD is 10 dollars per pip | 10 dollars per pip per lot |
| 4 — Position size | 500 divided by (25 times 10) | 2.00 lots |
| 5 — The check | 25 pips times 10 dollars times 2.00 lots | 500 dollars of risk, exactly at the cap |
The stop sits five pips beyond the displacement high, not at it. A stop placed exactly on the displacement extreme gets hunted by the next wick; five pips of air costs me a little size and buys me a stop that survives normal noise. The target comes from the same measurement: the first target is two times the stop distance, the second is four times it, which is why the worked trade below pays 3.0R when both targets hit. If the stop distance is so wide that the size drops below 0.50 lots, I skip the trade: a setup that needs a 100-pip stop to survive is a setup I do not understand well enough to trade. The max daily drawdown calculator is where I check the same maths before every session, and my personal daily stop of 2,500 dollars is the hard line that ends my day, five losing trades or not.
The Worked Trade: A Short That Paid 1,500 Dollars
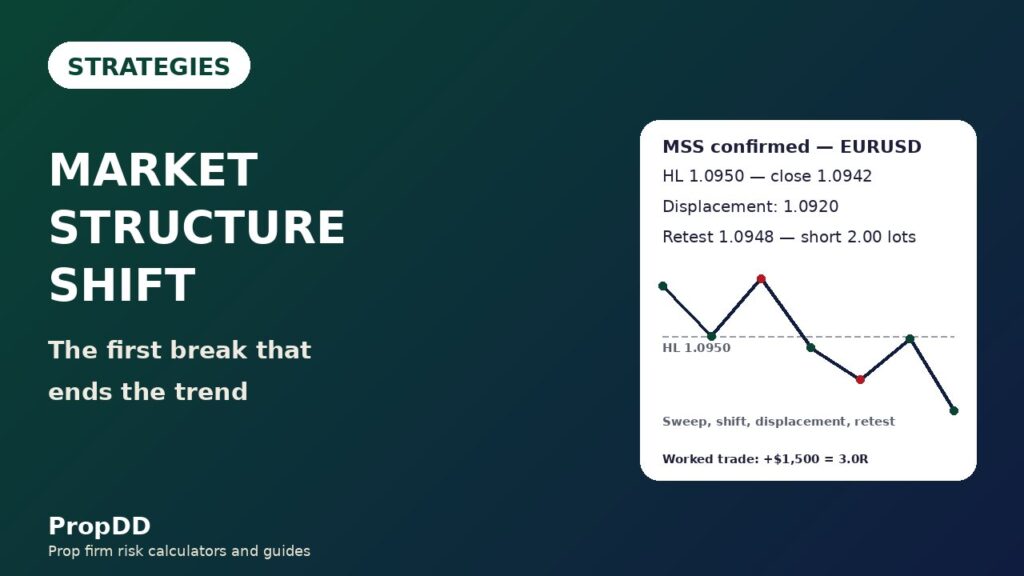
Thursday 5 November, the week after the Tuesday losses, EURUSD printed the same setup in reverse and this time I was ready for it. The uptrend’s last higher low was 1.0950, printed after the high at 1.0985. Price swept the high to 1.0990, then broke below 1.0950 and the hourly candle closed at 1.0942. The next candle was a strong bearish displacement: it pushed up to 1.0968 first, then sold off to close at 1.0920, a 22-pip body. I waited. Price drifted back to the order block at 1.0948 in the early New York session, the level held as resistance, and I shorted 2.00 lots with the stop five pips above the displacement high at 1.0973. The first target was 1.0898, fifty pips away, where I closed half. The second target was 1.0848, a hundred pips away, where I closed the rest. The whole trade took nine hours and paid 1,500 dollars.
| Leg | Price | Size | Result |
|---|---|---|---|
| Higher low swept and broken | 1.0950, swept high 1.0990, close 1.0942 | Close 8 pips below the level, displacement to 1.0920 | Shift confirmed on the hourly close |
| Entry — short on the retest | 1.0948 | 2.00 lots | Risk 500 dollars |
| Stop — above the displacement high | 1.0973, 25 pips | 5 pips of air above 1.0968 | Invalidation: hourly close above 1.0990 |
| Target 1 — half closed | 1.0898, 50 pips | 1.00 lot | Plus 500 dollars, 1.0R |
| Target 2 — rest closed | 1.0848, 100 pips | 1.00 lot | Plus 1,000 dollars, 2.0R |
| Total | Plus 1,500 dollars, 3.0R |
Two details made the trade work. The first was the sweep: price took out the high at 1.0985 before breaking the low, so real stops sat above that high and real fuel was released when price came back below the higher low. The second was the retest: price touched 1.0948 twice and failed twice before I entered, which is the confirmation the pattern promises. If price had closed above 1.0990 at any point I would have been out for the full 500 dollars, and that is the point: the loss was fixed, known and capped before I entered, while the win was three times the loss. That asymmetry is the whole strategy.
The Sizing Grid: Every Stop Distance, One Risk
The stop distance on a shift trade is whatever the displacement gives me, and it changes with the pair and the session. The grid below is the one taped to my monitor. Find the stop distance, read the size, and the risk is 500 dollars or a few dollars under it. I never round up: a size that risks 501 dollars is a size I do not take.
| Stop distance | Position size | Actual risk |
|---|---|---|
| 15 pips | 3.33 lots | 499.50 dollars |
| 20 pips | 2.50 lots | 500 dollars |
| 25 pips | 2.00 lots | 500 dollars |
| 30 pips | 1.66 lots | 498 dollars |
| 40 pips | 1.25 lots | 500 dollars |
| 50 pips | 1.00 lot | 500 dollars |
The grid also tells me when to stay out. A 60-pip stop would need 0.83 lots, and a 100-pip stop would need 0.50 lots, and at that size the spread and the commission eat a quarter of the first target before the trade even moves. My rule is simple: if the displacement is wider than fifty pips, the shift belongs to the daily chart, not to my hourly session, and I wait for the next one. There are two or three clean setups a week on EURUSD and GBPUSD together, and I do not need the wide ones.
Twelve Trades With the Filters On
I traded the pattern for three weeks after the Tuesday losses, from 4 to 24 November, and I logged every trade the same way: pair, direction, stop, size, result, and whether every rule was followed. Twelve trades qualified. Eight won, four lost, and the net was plus 5,750 dollars. The table below is the real log, and the maths under it is the reason I still trade this pattern.
| Trade | Pair | Direction | Result | Running total |
|---|---|---|---|---|
| 1 — 4 Nov | EURUSD | Short | Plus 1,000 dollars, 2.0R | Plus 1,000 dollars |
| 2 — 5 Nov | EURUSD | Short | Plus 1,500 dollars, 3.0R | Plus 2,500 dollars |
| 3 — 6 Nov | GBPUSD | Long | Minus 500 dollars, 1.0R | Plus 2,000 dollars |
| 4 — 9 Nov | EURUSD | Long | Plus 500 dollars, 1.0R | Plus 2,500 dollars |
| 5 — 10 Nov | EURUSD | Short | Plus 1,250 dollars, 2.5R | Plus 3,750 dollars |
| 6 — 11 Nov | GBPUSD | Short | Minus 500 dollars, 1.0R | Plus 3,250 dollars |
| 7 — 12 Nov | EURUSD | Long | Plus 750 dollars, 1.5R | Plus 4,000 dollars |
| 8 — 13 Nov | EURUSD | Short | Plus 1,000 dollars, 2.0R | Plus 5,000 dollars |
| 9 — 17 Nov | GBPUSD | Long | Minus 500 dollars, 1.0R | Plus 4,500 dollars |
| 10 — 18 Nov | EURUSD | Long | Plus 750 dollars, 1.5R | Plus 5,250 dollars |
| 11 — 20 Nov | EURUSD | Short | Plus 1,000 dollars, 2.0R | Plus 6,250 dollars |
| 12 — 24 Nov | GBPUSD | Short | Minus 500 dollars, 1.0R | Plus 5,750 dollars |
Read the log the way a funded account reads it. Eight winners paid 15.5R, four losers cost 4R, and the net is plus 11.5R, which is 5,750 dollars at 500 dollars of risk per trade. The best single trade paid 1,500 dollars, which is 26 percent of the net, inside the 30 percent consistency ceiling my firm enforces. The worst day was a single 500-dollar loss, 10 percent of the daily limit and 20 percent of my personal stop. And the five-trade slice from trades one to five, plus 1,000 plus 1,500 minus 500 plus 500 plus 1,250, totals plus 3,750 dollars, or 7.5R, which is the week that convinced me the pattern was real. Nothing in this log is cherry-picked: the four losers are in it, in order, and they are the reason the filters exist.
The Same Twelve Trades Without the Filters
Filters are easy to praise and hard to price, so here is the price. I replayed the same three weeks with the filters switched off: trading the shift candle instead of waiting for the retest, taking every break including the wick-only ones, and trading through the news. Fifteen trades qualified instead of twelve, five won, ten lost, and the net was minus 1,250 dollars. The filters did not make me clever. They removed the trades that were never mine to take.
| Version | Trades | Winners | Losers | Net |
|---|---|---|---|---|
| With filters on | 12 | 8 | 4 | Plus 5,750 dollars, plus 11.5R |
| Without filters | 15 | 5 | 10 | Minus 1,250 dollars, minus 2.5R |
| Filters are worth | 3 fewer trades | 3 more wins | 6 fewer losses | Plus 7,000 dollars, plus 14.0R |
Three trades explain most of the gap. The first was a shift into a red-folder CPI release that ran forty pips past my stop before the close, a 500-dollar loss that the news filter removes entirely. The second was a wick below a minor higher low that never closed beyond it, another 500-dollar loss that the hourly-close rule removes. The third was a shift taken against the 4-hour trend, a counter-trend guess that the bias rule removes. Those three trades cost 1,500 dollars between them, and the remaining gap is the smaller targets and wider stops that come from entering on the shift candle instead of the retest. The filters are worth 7,000 dollars in three weeks, and they cost me nothing but patience.
When the Shift Fails
The market structure shift fails in five ways, and I have paid for all five. The first is the strong trend: in a trend that is genuinely running, price breaks the higher low, closes below it for one candle, and then reclaims it, and the retest never holds. The second is the news spike: a shift caused by a data release is not a structural change, it is volatility, and the close below the level means nothing. The third is the range: in a tight range the same higher low gets broken five times a day and none of them mean anything, because there is no trend to end. The fourth is the double shift: price shifts down, then shifts back up an hour later, and both sides lose. The fifth is the retest that never comes: price shifts and runs to target without ever pulling back to the block.
| Failure mode | What it looks like | What I do |
|---|---|---|
| Strong trend reclaims the level | Close below the higher low, then price reclaims it | Exit on the reclaim, never add to the loser |
| News spike shift | Shift inside 30 minutes of red-folder news | No trade, the news filter already excluded it |
| Tight range, endless shifts | Same level broken three times in one session | One trade per pair per session, then stand aside |
| Double shift, both sides | Shift down, then shift back up an hour later | Take the first loss, skip the second setup entirely |
| Retest never comes | Price runs straight to target without pulling back | Let it go, chasing it is a market order into air |
The failure I respect most is the retest that never comes. On 9 November price shifted below the higher low, closed under it, and fell eighty pips without ever coming back to the block. I watched the whole move from the sidelines, and it hurt, because the move was there and my rule kept me out of it. The rule is right anyway: entering without a retest means entering without a known stop, and a trade without a known stop is a trade I cannot size. The trend pullback strategy is the better tool for that kind of move, and the London breakout is the better tool when the break is real. The market structure shift is for the days when the trend ends, and knowing which day it is matters more than the entry.
My Daily MSS Routine
The shift is only as good as the routine around it, and mine takes twenty minutes a day. I mark the structure before the London open, I wait for the sweep and the close, and I write down every setup whether I trade it or not. The journal is the edge: without it I would remember the winners and forget the losers, and the log would slowly turn into a story instead of a record.
| Time (PKT) | What I do | What I write down |
|---|---|---|
| 12:30 | Mark the 4-hour structure and the hourly higher lows and lower highs on EURUSD and GBPUSD | Level, date printed, hourly ATR |
| 13:00 | London open: watch for the sweep, do nothing until the hourly close | Sweep depth in pips, close beyond the level yes or no |
| 14:00 | New York session: wait for the retest, size from the grid, enter or skip | Entry, stop, size, targets, risk in dollars |
| 17:00 | Close of session: log the trade, the result, and any rule broken | Result, R multiple, rule broken or none |
| 21:00 | Evening review: count the setups I skipped and why | Skipped setups, filter that removed them |
Three habits keep the routine honest. The first is marking the levels before the session, never after the shift, because a level drawn after the fact is not a level. The second is logging the skipped setups, because the filters only look valuable when I can see what they removed. The third is the news check: I read the calendar at 12:30 and mark the red-folder releases, and any setup that lands within thirty minutes of one is crossed out before it happens. The routine is boring, and that is the point. Boring routines survive funded accounts. Exciting ones do not.
Frequently Asked Questions
What is a market structure shift in trading?
A market structure shift is the first break and hourly close beyond the swing point that made the last high or low: below the higher low in an uptrend, or above the lower high in a downtrend. It is the earliest evidence that the side in control has lost it. A wick through the level is not a shift. Only a full hourly close beyond it counts, and the shift is confirmed by a strong displacement candle and traded on the retest of the order block or fair value gap it leaves behind.
How is a market structure shift different from a break of structure?
A break of structure breaks the prior swing high or low in the direction of the trend, so it confirms continuation. A market structure shift breaks the higher low or lower high against the trend, so it signals a possible reversal. The practical difference is direction: I trade break of structure with the trend and market structure shift against it, and only after the displacement proves the new side has real flow behind it.
Is a market structure shift the same as a change of character?
Mostly yes, with one difference I insist on. A change of character is any first break of the opposing swing point. A market structure shift, the way I trade it, is a change of character that comes after a liquidity sweep of the prior extreme and is followed by a displacement candle. The sweep collects the stops, the close proves the break, and the displacement proves the flow. Without the sweep and the displacement it is a change of character, not a shift I will trade.
Can I trade the market structure shift on a prop firm challenge?
Yes, and it fits prop firm rules well, because the stop is fixed beyond a real extreme before entry, the risk is capped at 0.5 percent per trade, and the pattern produces a small number of high-quality setups instead of constant trading. The rules that matter are the daily loss limit, the consistency rule, and the news rule: no trade within thirty minutes of red-folder news, one shift trade per pair per session, and a personal daily stop at half the firm limit.
What is the best timeframe for the market structure shift?
The 4-hour chart sets the bias and the hourly chart is where I trade the shift. The sweep, the close and the displacement all need an hourly candle to mean anything, and the retest usually arrives in the next session. The daily chart gives cleaner setups but only one or two a week. The fifteen-minute chart gives more setups but the closes beyond the level are noise more often than signal, and the stops are too tight to survive normal spread.
What invalidates a market structure shift?
An hourly close back above the displacement high, for a short, or below the displacement low, for a long. That close means the shift failed and the old trend was real after all. I exit on that close for the full planned loss and I do not re-enter the same level in the same session. Chasing the level after invalidation is how one loss becomes two.
Risk disclaimer: Trading on a funded account involves the risk of losing the challenge fee and the account. This article describes my own experience and is not financial advice. Never risk money you cannot afford to lose, and always check your firm’s rules before trading any strategy.


