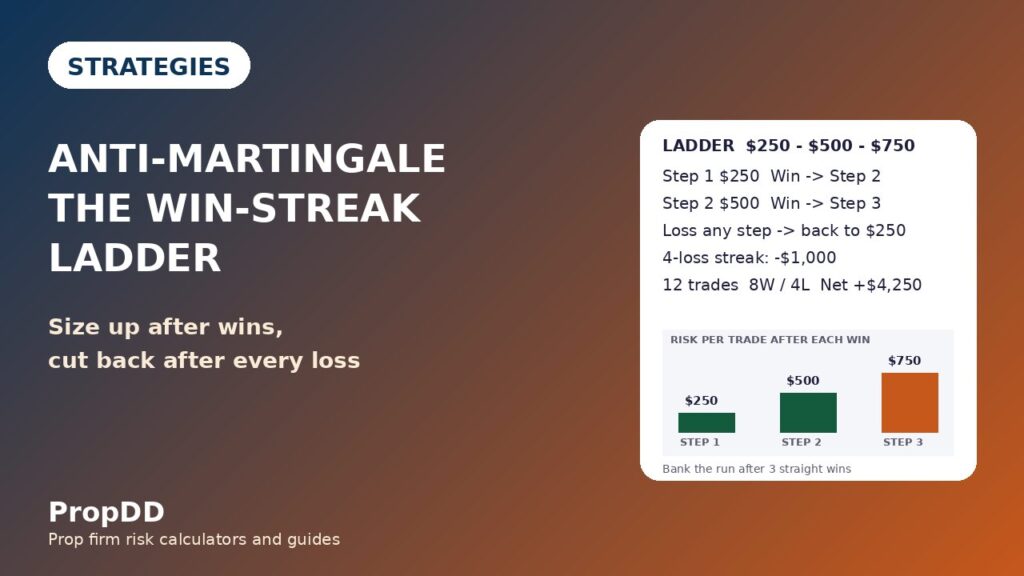
In the spring I watched a trader in my challenge group blow a funded account in four trades. His first three trades of the week had all been winners — then one loss arrived and he doubled his size to win it back. The next loss doubled it again, and by the fourth trade he was risking four thousand dollars on a single trade. The daily limit took the account before lunch. I had written about why that doubling fails in my martingale guide: doubling after a loss is a breach with a timetable. That afternoon I asked the opposite question — what if I grow size only after wins, and shrink it after every loss? The answer became the only sizing ladder I have traded since.
In this article
- What anti-martingale actually means
- The three-step ladder I trade
- The sizing formula and the lot grid
- The worked trade: step two, two lots, three R
- Twelve trades on the ladder: what I tested
- The losing streak test: four losses in a row
- When the ladder fails
- My daily routine with the ladder
- Frequently asked questions
I trade a one hundred thousand dollar account with a five thousand dollar daily loss limit and a ten percent maximum drawdown, risking two hundred and fifty dollars per trade at base. Every number here comes from that account and the twelve-trade test I ran on the ladder in October. Anti-martingale is not a magic edge — it puts more money behind the days when my read is working, and less behind the days when it is not, while keeping every loss small enough that no streak can touch the daily limit.
What anti-martingale actually means
Anti-martingale — the reverse martingale, or Paroli system — is the mirror image of the doubling rule that kills funded accounts. After a win, you increase your risk on the next trade; after a loss, you cut it back to base, immediately, with no negotiation. The classic Paroli doubles after each win and banks the run after three straight wins. My version is slower on purpose: two hundred and fifty, five hundred, and seven hundred and fifty dollars, never above step three. My largest single loss is seven hundred and fifty dollars — fifteen percent of my daily limit — and it can only happen after two wins have already paid for it twice over.
Three things it is not. It does not recover losses faster — a loss always resets the ladder to base, so a bad week grinds slowly by design. It is not a substitute for an edge — if your entries lose more often than they win, growing size after wins only grows the losses that follow. And it is not free money: a streak that ends at step three costs you the biggest loss of the run. What it is, is a structure that makes your best days bigger than your worst days without ever letting one bad sequence near the daily limit.
The maths that matters most is the losing-streak maths: four straight losses cost one thousand dollars on my ladder, two thousand at fixed risk, and seven thousand five hundred on a martingale ladder — one hundred and fifty percent of the daily limit, a breach before the fourth trade even closes. That comparison decided it for me.
The three-step ladder I trade
The ladder has three steps. Step one risks two hundred and fifty dollars. Win, and the next trade risks five hundred. Win again, and the next trade risks seven hundred and fifty. Win a third time and I bank the run — the ladder resets to step one whether I want it to or not. Lose at any step and it resets immediately. There is no step four, no “one more to make it count”, and no carrying a hot streak into a new session. The reset after three wins stops a good run turning into an oversized gamble, because the fourth trade of a streak is where overconfidence does its damage.
| Ladder step | Risk per trade | Share of daily limit | What moves me here |
|---|---|---|---|
| Step 1 (base) | $250 | 5% | Session start; every loss returns here |
| Step 2 | $500 | 10% | One straight win |
| Step 3 (cap) | $750 | 15% | Two straight wins; never higher |
The ladder follows the trade sequence, not the clock. Win on Tuesday and your next trade is Thursday, Thursday is still step two; lose on Monday and Tuesday starts at step one. Only a win advances it, only a loss or a banked third win resets it. I keep it on a sticky note next to my journal, one line per trade — the moment I reconstruct it from memory is the moment I start inventing exceptions. And it needs a session rule: London and New York only, written setups with a twenty-five to fifty pip stop, never inside thirty minutes of a red-folder release.
The sizing formula and the lot grid
The lot size for any step comes from one formula, calculated before every trade: divide the step’s risk dollars by the stop distance in pips multiplied by the pip value — ten dollars per pip per standard lot on EURUSD — then round down to two decimal places, never up. The step is a ceiling, not a suggestion.
| Formula | What it means |
|---|---|
| Lots = Risk $ / (Stop in pips x $10 per pip per lot) | Risk dollars for the ladder step, stop distance, EURUSD pip value |
| 25-pip stop: step one 250 / 250 = 1.00 lot; step two 500 / 250 = 2.00 lots; step three 750 / 250 = 3.00 lots | Step three is the biggest loss the ladder ever allows — fifteen percent of the daily limit |
Here is the grid I keep printed beside the ladder — every lot size rounded down, so no row risks more than its step. The fifteen-pip row is the one people get wrong: one point six seven lots at step one would risk two hundred and fifty dollars and fifty cents, so I trade one point six six.
| Stop distance | Step 1 ($250) | Step 2 ($500) | Step 3 ($750) |
|---|---|---|---|
| 15 pips | 1.66 lots ($249) | 3.33 lots ($499.50) | 5.00 lots ($750) |
| 20 pips | 1.25 lots ($250) | 2.50 lots ($500) | 3.75 lots ($750) |
| 25 pips | 1.00 lot ($250) | 2.00 lots ($500) | 3.00 lots ($750) |
| 30 pips | 0.83 lots ($249) | 1.66 lots ($498) | 2.50 lots ($750) |
| 40 pips | 0.62 lots ($248) | 1.25 lots ($500) | 1.87 lots ($748) |
| 50 pips | 0.50 lots ($250) | 1.00 lot ($500) | 1.50 lots ($750) |
Margin is the last number here. A two-lot EURUSD position is two hundred thousand dollars of notional, and at one-to-thirty funded leverage the margin is about six thousand six hundred and sixty-seven dollars — under seven percent of the account. If your firm cuts leverage overnight, check the margin before the step-three trade, not after it. SignalForge’s martingale guide shows the other side of this coin — why firms flag doubling after losses — and my position sizing guide covers the same formula for other pairs.
The worked trade: step two, two lots, three R
The trade that taught me the ladder works was a step-two trade on EURUSD in October, after a step-one win, so this one risked five hundred dollars. The setup was a trend pullback off a level I had marked the day before, the one-hour candle closing back above it with a full body. I entered long at one point zero nine two zero with a stop at one point zero eight nine five — twenty-five pips, two lots, exactly five hundred dollars of risk.
| Worked trade | Level | Maths |
|---|---|---|
| Entry (long) | 1.0920 | Step two, after one straight win |
| Stop loss | 1.0895 | 25 pips x 2.00 lots x $10 = $500 risk |
| First target (half off) | 1.0970 | 50 pips x 1.00 lot x $10 = +$500 |
| Second target (rest off) | 1.1020 | 100 pips x 1.00 lot x $10 = +$1,000 |
| Total result | — | +$1,500 = 3.0R on a $500 risk |
Price hit the first target in London and I took half off for five hundred dollars; the rest ran to the second target in New York for another one thousand — plus one thousand five hundred in total, three R on a five hundred dollar risk — and the ladder moved to step three. Here is the part people skip: the next trade lost. Step three, seven hundred and fifty dollars of risk, stopped out in full. The run banked five hundred, then one thousand five hundred, paid seven hundred and fifty, and finished plus one thousand two hundred and fifty dollars. A fixed-risk trader taking the same three trades would have finished plus one thousand five hundred, because his third trade risked five hundred instead of seven hundred and fifty. The ladder cost me two hundred and fifty dollars of profit on that sequence, and bought the discipline that keeps my losing streaks at base size.
Twelve trades on the ladder: what I tested
In October I ran the ladder for twelve trades over six days, two a day, logging every step, risk and reset. Eight wins, four losses — a sixty-six point seven percent win rate — every win paying two R at the risk of that step. I checked the expectancy on my strategy expectancy calculator: the same win rate at fixed risk would project higher monthly profit. The ladder is a risk control, not a profit maximiser.
| Trade | Result | Ladder step | Risk | Outcome | Running net |
|---|---|---|---|---|---|
| 1 | Win | Step 1 | $250 | +$500 | +$500 |
| 2 | Win | Step 2 | $500 | +$1,000 | +$1,500 |
| 3 | Win | Step 3 | $750 | +$1,500 | +$3,000 |
| 4 | Loss | Step 1 | $250 | -$250 | +$2,750 |
| 5 | Win | Step 1 | $250 | +$500 | +$3,250 |
| 6 | Loss | Step 2 | $500 | -$500 | +$2,750 |
| 7 | Win | Step 1 | $250 | +$500 | +$3,250 |
| 8 | Win | Step 2 | $500 | +$1,000 | +$4,250 |
| 9 | Loss | Step 3 | $750 | -$750 | +$3,500 |
| 10 | Win | Step 1 | $250 | +$500 | +$4,000 |
| 11 | Win | Step 2 | $500 | +$1,000 | +$5,000 |
| 12 | Loss | Step 3 | $750 | -$750 | +$4,250 |
The twelve trades netted plus four thousand two hundred and fifty dollars — eight wins totalling six thousand five hundred, four losses totalling two thousand two hundred and fifty, about three hundred and fifty-four dollars per trade. At fixed risk the same sequence would have netted plus six thousand: the ladder gave up one thousand seven hundred and fifty dollars of profit, and bought a worst day of minus two hundred and fifty dollars against a five thousand dollar daily limit. The best day was plus one thousand five hundred dollars, thirty-five point three percent of the net — inside my firm’s forty percent cap, though above the thirty percent line I prefer; the honest fix is to split a three-win ladder across two days when the firm caps best days at thirty percent.
The losing streak test: four losses in a row
The twelve-trade log had its losses spread out, so I stress-tested the ladder the way a funded account actually dies: four losses in a row. All three systems start at a five hundred dollar base risk — the only difference is what each one does after a loss.
| System | Loss 1 | Loss 2 | Loss 3 | Loss 4 | Total hole | Share of daily limit |
|---|---|---|---|---|---|---|
| Martingale (double after loss) | -$500 | -$1,000 | -$2,000 | -$4,000 | -$7,500 | 150% — breached |
| Fixed risk ($500 every trade) | -$500 | -$500 | -$500 | -$500 | -$2,000 | 40% of the limit |
| Anti-martingale (reset to base) | -$250 | -$250 | -$250 | -$250 | -$1,000 | 20% of the limit |
Read the martingale row twice. Seven thousand five hundred dollars is one hundred and fifty percent of a five thousand dollar daily limit — the account is gone before the fourth trade closes, and most firms would have flagged the doubling pattern even earlier. Fixed risk is survivable at forty percent of the limit. Anti-martingale costs half of that, one thousand dollars, because every loss resets the risk to base. On the winning side it flips: three straight wins pay three thousand dollars on both the ladder and fixed risk, and only one thousand five hundred on martingale, because martingale resets to base after every win. My risk of ruin calculator shows the same story from the other end: shrink the loss size and the probability of ruin falls faster than any win-rate gain can match.
When the ladder fails
The ladder fails in three specific ways, and I have met all three. First, in a choppy market, where wins and losses alternate and the ladder never climbs past step one — you pay the discipline cost of small base trades and never collect the bigger wins. In a range I skip the ladder or accept a flat week. Second, when a step-three loss follows a step-two win and the trader decides the ladder “owes” him a recovery trade. It owes nothing — the one time I broke the reset rule with a revenge trade at step two, I lost another five hundred dollars in eleven minutes. Third, when wins are small and losses are full size: a trade that banks half a R and reverses to a full stop is still a loss at step-three size.
Three rules save it, written on the same sticky note as the ladder. One: no step-three trade in the first hour of a session, when spreads are wide and the level is untested. Two: if the daily loss reaches one thousand dollars I stop for the day — that personal stop sits well below the firm’s limit, and the logic is in my personal daily stop guide. Three: a step-three trade needs a written reason beyond “the ladder says so” — a level, a session, a stop I can point to. My losing streak guide covers the psychology of the reset: the hardest part of this system is taking a base-size trade the morning after a step-three loss.
My daily routine with the ladder
The routine is boring, and boring is the point. I check the ladder before I check the charts, and I write the step down before I place the order — never after, because after is when the justifications start. The table below is the routine I actually follow, including the two checks that have saved me more money than any indicator: the news blackout and the hard stop at one thousand dollars of daily loss.
| Time (PKT) | Step | What I do |
|---|---|---|
| 12:30 | Check | Read yesterday’s ladder line; today starts at the step the sequence says |
| 13:00 | Plan | Mark EURUSD H1 levels; note red-folder news and the thirty-minute blackout |
| 13:30 – 16:00 | London | Written setups only; lots from the grid; step logged before ordering |
| 18:30 – 21:00 | New York | Only if London followed the plan; no new step-three trade after 20:00 |
| 21:30 | Close | Log every trade; daily loss at $1,000 means stop for the day |
The one thousand dollar daily stop is twenty percent of the firm’s limit, and it is what makes the ladder safe rather than merely clever. How much to risk per trade is the guide I point new traders to first — the ladder only moves between risk levels, and the levels have to be right.
Frequently asked questions
Is anti-martingale allowed on prop firm accounts?
Yes, in general — it is the opposite of what firms ban. Martingale is banned because doubling after losses breaches daily limits by design; anti-martingale never increases risk after a loss, so it cannot produce that signature. I still check the fine print of any new firm.
How is anti-martingale different from the Paroli system?
It is the same idea with a slower ladder. The classic Paroli doubles after every win and banks after three wins; mine steps two hundred and fifty, five hundred, seven hundred and fifty dollars. The rules are identical: up after a win, back to base after a loss, bank after three straight wins.
Does anti-martingale make more money than fixed risk?
On a winning run, no — my twelve-trade test made four thousand two hundred and fifty dollars against six thousand at fixed risk. It earns its place on losing runs, where four straight losses cost one thousand dollars instead of two thousand.
What happens if I lose the step-three trade?
You lose seven hundred and fifty dollars and the ladder resets to step one — the designed cost, possible only after two wins. In my worked example the three-trade sequence still finished plus one thousand two hundred and fifty dollars. The dangerous version is inventing a fourth step to win it back: martingale wearing a different name, and the ladder forbids it.
Does the ladder work for scalping or news trading?
No. Scalping stops are too tight for the grid, and news moves can jump a stop by more than the step allows, breaking the ceiling the ladder depends on. It belongs on planned trades with real stops — twenty-five to fifty pips on EURUSD — in London and New York, with a thirty-minute blackout around red-folder news.
Risk disclaimer: Trading funded accounts involves substantial risk of loss and is not suitable for every trader. The ladder, the figures and the twelve-trade log here describe my own account and my own test, not a promise of similar results.



