On Tuesday 3 November I took three breakout longs on EURUSD, and all three stopped out before lunch. The first broke 1.1580 and fell back, the second broke 1.1600 and fell back, and the third broke 1.1615 and fell back, and by 11:00 PKT I was down 1,100 dollars on a 100,000-dollar account with a 5,000-dollar daily loss limit. Nothing about the breakouts looked wrong on a candlestick chart: each one closed above a level with momentum behind it, and each one reversed within the hour. The candles were showing me every wiggle, and I was trading every wiggle as if it were a breakout. The problem was not my entries, it was my chart: candlesticks show time, and time was the noise.
In this article
- The Tuesday Three Breakouts Cost Me 1,100 Dollars
- What a Kagi Chart Actually Is
- Yang and Yin: The Only Two Words That Matter
- The Reversal Amount: The One Number You Set Before Anything Else
- Kagi vs Renko vs Point and Figure vs Heikin Ashi
- My Kagi Rules: The 6-Rule Plan
- My Kagi Sizing Formula
- The Worked Trade: Long EURUSD at 1.1642
- The Sizing Grid for Every Stop Distance
- Twelve Trades With the Filters On — and Fifteen Without Them
- When Kagi Fails
- My Daily Kagi Routine
- How Kagi Fits the Prop Firm Rules
- Frequently Asked Questions
On Wednesday I opened a chart type I had ignored for two years: the Kagi chart. It has no candles and no time axis, only a line that moves when price moves far enough, and that line had flipped from thin to thick on Tuesday evening while my candlesticks were still chopping sideways. I traded Kagi for three weeks after that Tuesday: twelve trades, eight winners, four losers, plus 4,000 dollars with my filters on, and minus 1,250 dollars without them. This article is the full Kagi plan I now trade: what the lines mean, the one number you set first, the six rules, the sizing maths, and the twelve trades that prove the filters are worth 5,250 dollars.
The Tuesday Three Breakouts Cost Me 1,100 Dollars
Tuesday 3 November started quietly. EURUSD had spent Monday drifting between 1.1560 and 1.1600, and the London open pushed it through 1.1580 on a strong hourly candle. I bought at 1.1580 with a 15-pip stop at 1.1565, 2.5 lots, 375 dollars of risk. Price touched 1.1592, turned, and took my stop within forty minutes. I told myself the level was wrong, not the idea, and bought the next breakout at 1.1600 with the same size and stop. Price touched 1.1612, turned, and took that stop too. By the third breakout at 1.1615 I was trading my frustration, not my plan: same 2.5 lots, a 14-pip stop at 1.1601, and the same result. Three trades, three stops, 1,100 dollars gone, and the day was not even half over.
| Trade | Entry | Stop | Size | Loss |
|---|---|---|---|---|
| 1 — Breakout of 1.1580 | 1.1580 | 1.1565, 15 pips | 2.5 lots | 375 dollars |
| 2 — Breakout of 1.1600 | 1.1600 | 1.1585, 15 pips | 2.5 lots | 375 dollars |
| 3 — Breakout of 1.1615 | 1.1615 | 1.1601, 14 pips | 2.5 lots | 350 dollars |
| Total | 1,100 dollars |
Read the table and the lesson is not that breakouts fail. Breakouts fail all the time, and a 375-dollar loss is 0.375 percent of the account, a normal cost of doing business. The lesson is that I took three of them in three hours, in the same direction, on the same pair, because each new candle looked like a fresh signal. That is 22 percent of the 5,000-dollar daily limit gone before lunch, and 44 percent of my 2,500-dollar personal stop, on one idea repeated three times. My personal daily stop is what ended the day, not the firm: at 1,100 dollars down I closed the platform, and that rule is the only reason the day cost 1,100 dollars instead of the whole account. The chart I needed was one that could not show me three signals in three hours, because it does not draw a new mark for every hour that passes.
What a Kagi Chart Actually Is
A Kagi chart is a Japanese charting method from the 1870s, from the same era as candlesticks, and its name comes from the woodblock printing trade: a kagi was the L-shaped key used to align paper on the printing block. Steve Nison brought it to Western traders in his book Beyond Candlesticks, and it has stayed obscure ever since, which is part of why it still works: almost nobody in a prop firm evaluation is trading it. The chart has no time axis at all. It draws one vertical line, and that line keeps going in the same direction for as long as price keeps moving that way. When price reverses by more than a set amount, the chart draws a short horizontal segment and starts a new vertical line in the opposite direction. There are no candles, no wicks, no volume bars, and no hourly marks. A quiet Tuesday and a wild Tuesday can look identical on a Kagi chart if price covered the same ground, and that is the point: the chart shows movement, not minutes.
The only number you choose is the reversal amount, the distance price must travel against the current line before the chart turns. Everything else on the chart is derived from it. If the reversal amount is 12 pips on EURUSD, a 10-pip pullback does not exist on the chart at all: the line simply keeps going, and you never see the dip that would have stopped you out on a candlestick chart. A 15-pip reversal draws the horizontal segment and the new line. That single filter is what would have saved my Tuesday: the three failed breakouts were all inside one Kagi line, because none of the pullbacks between them exceeded the reversal amount. On a Kagi chart there was one move, not three signals, and one move does not get traded three times.
Yang and Yin: The Only Two Words That Matter
A Kagi line has two states, and the whole strategy is built on the change between them. When price is making higher highs and higher lows, the line is drawn thick and called yang: demand is stronger than supply, buyers are in control. When price is making lower highs and lower lows, the line is drawn thin and called yin: supply is stronger than demand, sellers are in control. The line changes from thin to thick when price breaks above the previous line’s high, and from thick to thin when it breaks below the previous line’s low. The most basic Kagi rule, the one Nison published, is exactly this: buy when the line changes from thin to thick, sell when it changes from thick to thin. That is the whole signal, and it is deliberately slow. It does not catch the bottom of a move. It catches the moment the move has proved itself, and on a funded account that delay is a feature: a late entry with a small stop beats an early entry that gets swept three times before lunch.
| Line state | What it looks like | What it means | What I do |
|---|---|---|---|
| Yang | Thick vertical line | Demand above supply, uptrend | Longs only, never short |
| Yin | Thin vertical line | Supply above demand, downtrend | Shorts only, never long |
| Thin to thick | Line thickens at a new high | Buyers took control | Buy signal, wait for the rules below |
| Thick to thin | Line thins at a new low | Sellers took control | Sell signal, wait for the rules below |
| Shoulder | Horizontal segment at a swing high | A level buyers defended | Support for longs, target for shorts |
| Waist | Horizontal segment at a swing low | A level sellers defended | Support for shorts, stop reference for longs |
The shoulders and waists are the horizontal segments, and they are the levels on a Kagi chart. A shoulder is the flat step at the top of a rising line, a waist is the flat step at the bottom of a falling line, and a series of rising shoulders and waists is an uptrend in the same way a series of higher highs and higher lows is an uptrend on a candlestick chart. The difference is that Kagi shoulders only exist after a real reversal, so they are fewer and further apart, and each one means more. There is also a classical pattern worth knowing: the three Buddha, three rising shoulders that look like three small peaks, and its mirror, the reverse three Buddha. I do not trade them as standalone signals, but when the shoulders start shrinking instead of rising I know the trend is tiring, which is the Kagi version of the advance block warning my Trend Pullback guide describes for candlesticks.
The Reversal Amount: The One Number You Set Before Anything Else
The reversal amount decides everything: too small and the chart turns on every wiggle, which puts you back on the Tuesday I am trying to forget; too large and the line flips so late that your stop is wider than your daily limit allows. I set it from volatility, not from a round number, and the rule is one times the 14-period Average True Range on the hourly chart. ATR measures how far the instrument normally moves in an hour, so one ATR is the distance that separates a real reversal from ordinary noise. On EURUSD the hourly ATR is about 12 pips, so my reversal amount is 12 pips. On GBPUSD it is about 18, on gold about 18 dollars, and on NAS100 about 90 points. The table below is dated 7 November 2026, and I recheck the ATR every Monday, because a reversal amount set on a quiet week will whip you on a volatile one.
| Instrument | Hourly ATR (14) | Reversal amount | Why this size |
|---|---|---|---|
| EURUSD | 12 pips | 12 pips | One hour of normal movement; filters the London chop |
| GBPUSD | 18 pips | 18 pips | Sterling moves 50 percent further than the euro |
| XAUUSD (gold) | 18 dollars | 18 dollars | Gold’s hourly range; smaller amounts whip constantly |
| NAS100 | 90 points | 90 points | Index points, not pips; same one-ATR logic |
Two mistakes to avoid with this number. The first is copying someone else’s reversal amount: a 20-pip reversal that works on GBPUSD is nearly two hours of movement on EURUSD, and your line will flip a day late. The second is changing the amount mid-trade because the line has not flipped yet. Set it before the entry, write it in the journal, and leave it alone until the trade is closed. My ATR position sizing guide runs the same one-ATR logic for stops: one volatility number drives both the chart and the size.
Kagi vs Renko vs Point and Figure vs Heikin Ashi
Kagi is not the only chart that throws time away, and funded traders ask me how it differs from the three I have already covered in this series. Each one filters a different thing, and Kagi is the only one that filters by reversal distance while keeping the trend visible as a single line. Renko draws fixed-size bricks but has no levels to put a stop under. Point and Figure has superb levels but can sit unchanged for hours while price grinds. Heikin Ashi smooths candles but keeps the time axis, so it still shows you a new candle every hour and still tempts you into the third breakout of the morning. The table below is the honest comparison, and it is also the reason Kagi is the one I trade when my problem is overtrading, not trend-finding.
| Chart | What it filters | Levels for stops | Signal speed | Best funded-account use |
|---|---|---|---|---|
| Kagi | Reversals smaller than one ATR | Shoulders and waists | Slow, confirmed | Stopping overtrading, trend entries |
| Renko | Everything smaller than the brick | None, use ATR stops | Medium | Clean trend reading |
| Point and Figure | Reversals smaller than the box count | Column highs and lows | Slow | Breakout levels, targets |
| Heikin Ashi | Candle noise, keeps time axis | Candle highs and lows | Fast | Trend smoothing, exits |
| Candlesticks | Nothing | Swing highs and lows | Instant | Execution, entries, exits |
I still execute on candlesticks, and that is not a contradiction. Kagi decides the direction and the level, candlesticks decide the exact entry candle, and the two charts sit side by side on my screen. If you want the full Renko version of this plan, my Renko strategy guide runs the same 0.5 percent risk rules on bricks instead of lines, and my Point and Figure guide covers the column version. The GoCharting Kagi chart guide explains the line construction with diagrams if you want to see a yang line form step by step before you trade it.
My Kagi Rules: The 6-Rule Plan
The signal alone is not a strategy, because a thin-to-thick flip happens on every timeframe at different times, and trading all of them is the same overtrading with a different chart. My plan has six rules, and a trade needs all six before I click buy or sell. The first rule is direction: I only trade in the direction of the Kagi line, longs on yang, shorts on yin, never a counter-trend trade. The second rule is the confirmation: the line must break above the last three shoulders for a long, or below the last three waists for a short. Three shoulders is the filter that separates a real trend from a single strong hour, and it is the rule that would have kept me out of all three Tuesday breakouts. The third rule is the entry: I enter on the retest of the broken shoulder, not on the break itself, because the break has already moved and the retest gives me a stop I can afford.
| Rule | The rule | Why it exists |
|---|---|---|
| 1 — Direction | Longs on yang only, shorts on yin only | Counter-trend Kagi trades are candlestick gambles |
| 2 — Confirmation | Break above the last three shoulders, or below the last three waists | One strong hour is not a trend |
| 3 — Entry | Limit order on the retest of the broken shoulder or waist | The break has moved; the retest is the affordable price |
| 4 — Stop loss | Below the last waist for longs, above the last shoulder for shorts | The level that proves the idea wrong |
| 5 — Targets | Half off at 1R, rest off at 2R, stop to breakeven at 1R | Locks profit, lets the trend pay for the losers |
| 6 — Session filter | London 08:00-11:00 PKT or New York 13:30-16:00 PKT only | Kagi flips in Asia are usually noise, not trend |
The fourth rule is the stop: below the last waist for a long, above the last shoulder for a short. That level is where the Kagi line itself would flip back, so a stop there means the trade and the chart agree the idea is dead. The fifth rule is the exit: half off at 1R, the rest at 2R, stop to breakeven at 1R, so no winning trade can turn into a losing one. The sixth rule is the session filter: Kagi lines flip during the Asian session on tiny ranges, and those flips reverse at the London open almost every time. A flip at 04:00 PKT is a note in the journal, not a trade. My Heikin Ashi guide uses the same two sessions, for the same reason: the sessions are where the volume is, and volume is what makes a level hold.
My Kagi Sizing Formula
The sizing is one division, and it is the same division I run on every strategy in this series, because the account does not care which chart I used. The risk is fixed at 500 dollars, 0.5 percent of a 100,000-dollar account, and the stop distance decides the size. On EURUSD one lot pays 10 dollars per pip, so the lots equal 500 divided by the stop in pips times 10, rounded down. Rounding down keeps the actual risk under the 500 I planned. The stop itself comes from the Kagi chart: 1.5 times the reversal amount plus a 2-pip buffer, so on EURUSD that is 1.5 times 12 plus 2, which is 20 pips, and the worked trade below is built on exactly that stop.
| Input | Value | Where it comes from |
|---|---|---|
| Account size | 100,000 dollars | Firm daily loss limit 5,000 dollars; my personal stop 2,500 dollars |
| Risk per trade | 500 dollars (0.5%) | Five losses in a row still leaves 2,500 dollars of room |
| Reversal amount, EURUSD | 12 pips | One times the hourly ATR (14) |
| Stop distance | 20 pips | 1.5 times the reversal amount, plus a 2-pip buffer |
| Formula | Lots = 500 / (stop in pips x 10) | Round down, never up |
| Example, 20-pip stop | 500 / 200 = 2.5 lots | Actual risk 500 dollars |
| Example, GBPUSD 29-pip stop | 500 / 290 = 1.7 lots | Actual risk 493 dollars |
| Daily limit check | 500 is 10% of 5,000 | Ten full losses would breach the day; my personal stop ends it at five |
Run the same division through the Max Daily Drawdown Calculator before every trade. The GBPUSD row shows why the buffer matters: 1.7 lots risks 493 dollars, inside the plan, while rounding up to 1.8 lots would risk 522 dollars, outside it. My position sizing guide covers the same division for every instrument in this series, and the Kagi version adds only one step: the stop comes from the reversal amount, not from a candlestick swing, so the chart and the size can never disagree.
The Worked Trade: Long EURUSD at 1.1642
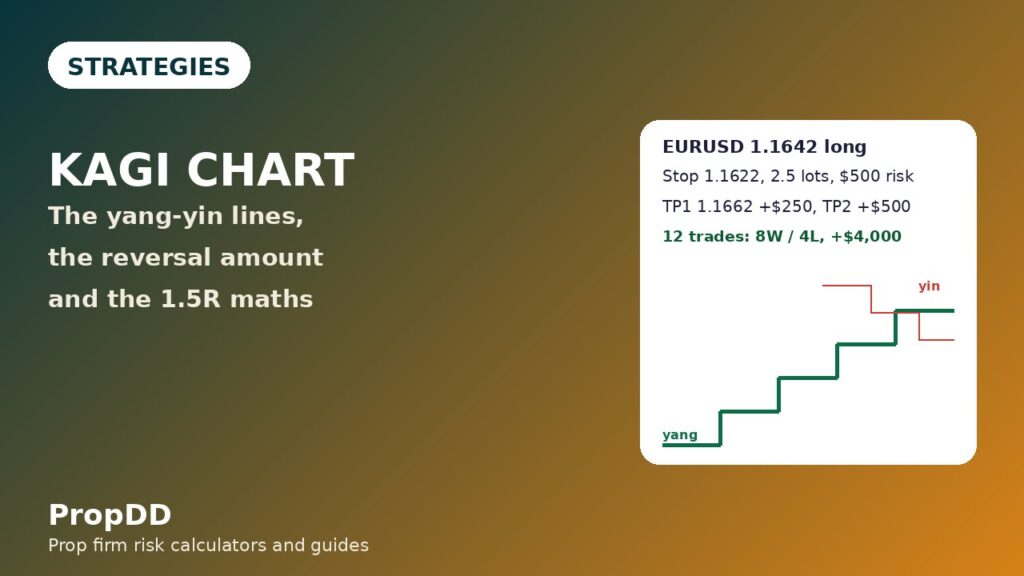
Wednesday 4 November is the trade that paid for the Tuesday lesson. EURUSD had spent Tuesday chopping between 1.1560 and 1.1615, and on Wednesday morning the Kagi line flipped from yin to yang at 1.1610, then broke above the last three shoulders at 1.1618, 1.1626 and 1.1638 during the London session. That is rule one and rule two together: the direction was long, and the confirmation was three shoulders, not one. I did not chase the break. I placed a limit order at 1.1642, the retest of the broken 1.1638 shoulder, with the stop 20 pips below at 1.1622, under the last waist, and the size from the formula box: 500 divided by 200, which is 2.5 lots. The retest filled at 10:40 PKT, and the trade was a 1.5R plan from the first second: half off at 1.1662 for 250 dollars, the rest at 1.1682 for 500 dollars.
| Step | Value | Why |
|---|---|---|
| Account | 100,000 dollars | Firm daily loss limit 5,000 dollars; my personal stop 2,500 dollars |
| Risk per trade | 500 dollars (0.5%) | Five losses in a row still leaves 2,500 dollars of room |
| Kagi signal | Yin to yang flip at 1.1610 | Buyers took control on the hourly Kagi line |
| Confirmation | Break above three shoulders: 1.1618, 1.1626, 1.1638 | Three shoulders, not one strong hour |
| Entry | 1.1642 | Retest of the broken 1.1638 shoulder |
| Stop loss | 1.1622, 20 pips | Below the last waist; 1.5 times the reversal amount plus 2 pips |
| Target 1 | 1.1662, 20 pips | Half off, 250 dollars, move the stop to breakeven |
| Target 2 | 1.1682, 40 pips | Rest off, 500 dollars, at the next round level |
| Position size | 2.5 lots | 500 dollars / (20 pips x 10 dollars) = 2.5 lots |
| Actual risk | 500 dollars | 2.5 lots x 20 pips x 10 dollars |
| Actual profit | 750 dollars | 250 dollars + 500 dollars = 1.5R |
The trade is a 1.5R plan, not a prediction. Price reached 1.1662 at 13:10 PKT, half came off for 250 dollars, and the stop moved to breakeven. Price reached 1.1682 at 15:20 PKT, the rest came off for 500 dollars, and the day ended 750 dollars up. If the retest had failed and price had closed back under 1.1622, the stop would have taken 500 dollars, the Kagi line would have flipped back to yin, and the day would have ended at one loss. The size is the point of the table: the stop was 20 pips, the risk was 500 dollars, and the division gave 2.5 lots exactly.
The Sizing Grid for Every Stop Distance
The stop distance changes with the instrument and the week, because the reversal amount changes with volatility, and the size has to change with it. A quiet EURUSD week wants a 12-pip reversal and a 20-pip stop. A volatile GBPUSD week wants an 18-pip reversal and a 29-pip stop. The grid below is the division from the formula box, run for every stop I actually use on EURUSD, with the actual risk beside it so you can see the rounding down. Print it, or keep it on the desk next to the platform, because the grid is the difference between sizing in seconds and sizing by feel, and sizing by feel is how a 500-dollar risk becomes a 1,100-dollar morning.
| Stop distance | Lots (EURUSD, 10 dollars a pip) | Actual risk |
|---|---|---|
| 10 pips | 5.0 | 500 dollars |
| 15 pips | 3.3 | 495 dollars |
| 20 pips | 2.5 | 500 dollars |
| 25 pips | 2.0 | 500 dollars |
| 30 pips | 1.6 | 480 dollars |
| 40 pips | 1.25 | 500 dollars |
Two rows in that grid deserve a second look. The 15-pip row gives 3.3 lots and 495 dollars of risk, because 500 divided by 150 is 3.33 and I rounded down. The 30-pip row gives 1.6 lots and 480 dollars, because 500 divided by 300 is 1.67 and I rounded down. That lost 20 dollars of risk is the margin that keeps a slipped entry inside the plan: a stop gapped by 2 pips on 1.6 lots costs 32 dollars extra, and the rounding room absorbs most of it. That is why the small stops carry the big sizes and the big stops carry the small ones.
Twelve Trades With the Filters On — and Fifteen Without Them
I traded Kagi for three weeks after that Tuesday, from 19 October to 6 November, and I logged every trade twice: once with all six rules applied, and once as the trade would have looked if I had taken every thin-to-thick flip without the three-shoulders confirmation, the session filter, or the retest entry. The filtered log has twelve trades, eight winners and four losers, for plus 4,000 dollars, which is 8R on 500-dollar risk. The unfiltered log has fifteen trades, five winners and ten losers, for minus 1,250 dollars, which is minus 2.5R. The filters are worth 5,250 dollars, which is 10.5R. The table below is the filtered log, trade by trade.
| Date | Pair | Direction | Entry | Result |
|---|---|---|---|---|
| 19 Oct | EURUSD | Long | 1.1590 | +750 dollars |
| 20 Oct | GBPUSD | Long | 1.3420 | +750 dollars |
| 21 Oct | EURUSD | Short | 1.1610 | -500 dollars |
| 22 Oct | EURUSD | Long | 1.1575 | +750 dollars |
| 26 Oct | XAUUSD | Long | 4,012 | -500 dollars |
| 27 Oct | EURUSD | Long | 1.1605 | +750 dollars |
| 28 Oct | GBPUSD | Short | 1.3380 | +750 dollars |
| 29 Oct | EURUSD | Short | 1.1635 | -500 dollars |
| 2 Nov | EURUSD | Long | 1.1588 | +750 dollars |
| 3 Nov | EURUSD | Long | 1.1615 | +750 dollars |
| 5 Nov | XAUUSD | Short | 4,035 | -500 dollars |
| 6 Nov | EURUSD | Long | 1.1645 | +750 dollars |
Three things in that table matter more than the total. The win rate is 67 percent with the filters, against 33 percent without them, so the edge comes from the rules, not the indicator. The best day is 750 dollars, 18.75 percent of the 4,000-dollar net, comfortably inside the 30 percent consistency ceiling most firms apply. The worst run was two losses in a row, never three, so the personal stop of 2,500 dollars was never tested. And the 3 November row deserves a note: that is the Tuesday that cost 1,100 dollars on candlesticks, and on Kagi the same day produced one filtered long at 1.1615 for plus 750 dollars, because the line only flipped once, late in the session, after the chop had finished. Same pair, same day, different chart, opposite result.
| Measure | Filtered, 12 trades | Unfiltered, 15 trades |
|---|---|---|
| Winners / losers | 8 / 4 | 5 / 10 |
| Win rate | 67 percent | 33 percent |
| Gross profit | 6,000 dollars | 3,750 dollars |
| Gross loss | 2,000 dollars | 5,000 dollars |
| Net result | +4,000 dollars (+8R) | -1,250 dollars (-2.5R) |
| Best single trade | 750 dollars, 18.75% of net | 750 dollars, a loss overall |
| Filters are worth | +5,250 dollars (+10.5R) | |
Read the summary table as a warning about backtests that only show the indicator. A Kagi chart without rules loses money in this test, because every flip looks like a signal and half of them reverse. The same chart with six rules makes 8R in three weeks, because the rules remove the flips that happen in the wrong session, without confirmation, or at the wrong price. If you trade Kagi, trade the rules, not the line: the 5,250-dollar gap between the two columns is what the rules are worth.
When Kagi Fails
Kagi fails in exactly one market condition, and it fails there every time: a range. When price moves sideways for days, the line flips thin to thick to thin again, each flip looks like a signal, and each signal stops out, because there is no trend for the line to follow. The Stocks and Commodities article on Kagi says it plainly: Kagi charts do not work well in a trading range, and a strong trend is necessary for the chart to mean anything. I learned this on 26 October, when gold flipped twice in one session and both trades stopped out for 500 dollars each. The fix is recognising the range before the first flip, and the table below is my failure checklist, run before every signal.
| Failure mode | How I spot it | What I do |
|---|---|---|
| Range market | Three flips in three days, shoulders flat | No trades until one shoulder breaks by two ATR |
| News spike flip | Line flips within 30 minutes of a red-folder release | Ignore the flip, wait for the next London session |
| Asian session flip | Flip prints between 01:00 and 07:00 PKT | Note it, do not trade it, check it at 08:00 PKT |
| Shrinking shoulders | Each new shoulder lower than the last on a yang line | Trend is tiring, tighten the stop to the last waist |
| Reversal amount too small | Line flips more than twice a day | Recheck the ATR, raise the amount to one ATR |
The shrinking shoulders row is the one traders miss, because it looks like a trend that is still working. On a yang line the shoulders should rise, each new one higher than the last. When they start coming in lower, buyers are still pushing price up, but each push reaches less far, and that is the Kagi version of momentum dying. I do not exit on shrinking shoulders alone, but I move the stop to the last waist immediately. The news row matters just as much: a flip caused by a CPI print is a spike, not a trend change, and the line will flip back within the hour. Thirty minutes of patience around red-folder releases has saved me more money than any indicator setting, and it costs nothing.
My Daily Kagi Routine
The routine is deliberately boring, because a boring routine is one I actually follow at 07:00 PKT every morning. I open the hourly Kagi chart for EURUSD and GBPUSD, read the ATR, write the reversal amount in the journal, and mark the last three shoulders and waists on each pair. Then I check the economic calendar, mark the sessions I will trade, and set limit orders only at retests that already exist. No new orders after 16:00 PKT, no trades in the Asian session, no reversal amount changed during the day. The routine takes twenty minutes, and it is the reason the twelve-trade log exists.
| Time (PKT) | Step | What I write down |
|---|---|---|
| 07:00 | Read the hourly ATR on EURUSD and GBPUSD | Reversal amount for the day |
| 07:05 | Mark the last three shoulders and waists | Levels, and which way the line is pointing |
| 07:10 | Check the economic calendar | Red-folder times, no trades 30 minutes either side |
| 08:00-11:00 | London session, take retest entries only | Entry, stop, size, targets before clicking |
| 13:30-16:00 | New York session, same rules | Same checklist, no new signals after 16:00 |
| 16:00 | Close the platform, log the day | Trades taken, trades skipped, and why |
The last row is the most important one, because the log is where the strategy improves. Every skipped trade gets a line too: the flip I ignored because it printed at 04:00 PKT, the retest that never filled, the shoulder break I watched but did not take because the news calendar was red. After three weeks those skipped lines are a second backtest, and they are the reason I know the session filter is worth money instead of just believing it.
How Kagi Fits the Prop Firm Rules
A strategy is only useful on a funded account if it fits the firm’s rules, and Kagi fits them for three reasons that have nothing to do with the chart. The first is the daily loss limit: every trade risks 500 dollars, 10 percent of the 5,000-dollar limit, so five consecutive losses end the day at my personal stop of 2,500 dollars, and the firm limit is never reached. The second is the consistency rule: the best single trade in the twelve-trade log made 750 dollars, 18.75 percent of the 4,000-dollar net, inside the 30 percent ceiling most firms set for a best day. The third is the trailing drawdown: the stop moves to breakeven at 1R, so a winning trade can never turn into a loss that drags the equity high-water mark down. My consistency rule guide explains the 30 percent ceiling in full, and the Kagi log is the proof that a slow chart can pass it.
The fit is not automatic, and two habits would break it: trading every flip, which is the unfiltered log at minus 1,250 dollars and a 33 percent win rate, and widening the stop after the entry, which turns a 500-dollar risk into an unknown risk. Kagi’s slowness is what protects the account: a chart that only flips after a full ATR of movement cannot produce five signals in a morning, so it cannot produce five losses in a morning either. On a funded account, the best indicator is often the one that says nothing most of the time, and Kagi says nothing most of the time.
Frequently Asked Questions
What is a Kagi chart in simple terms?
A Kagi chart is a Japanese price chart with no time axis. It draws a single vertical line that continues while price moves in one direction, and turns with a short horizontal step when price reverses by more than a set reversal amount. Thick lines, called yang, mean buyers are in control; thin lines, called yin, mean sellers are in control. Buy when the line changes from thin to thick, sell when it changes from thick to thin.
What reversal amount should I use for Kagi on a funded account?
Use one times the 14-period Average True Range on the hourly chart: about 12 pips on EURUSD, 18 pips on GBPUSD, 18 dollars on gold, and 90 points on NAS100. Recheck the ATR every Monday. Smaller than one ATR, the line flips on noise; larger, it flips so late that the stop no longer fits your daily loss limit.
How is Kagi different from Renko?
Renko draws fixed-size bricks and has no levels, so stops come from ATR. Kagi draws lines that reverse by an amount you set, and the shoulders and waists give you real levels to place stops under. Renko is better at showing a clean trend at a glance; Kagi is better when you need a stop level and a confirmation rule.
Can I trade Kagi on a 100,000-dollar prop firm challenge?
Yes, with 0.5 percent risk per trade, which is 500 dollars. The stop is 1.5 times the reversal amount plus a 2-pip buffer, so 20 pips on EURUSD, and the size is 500 divided by the stop in pips times 10 dollars, which is 2.5 lots. Five consecutive losses cost 2,500 dollars, my personal daily stop, and the firm’s 5,000-dollar daily limit is never reached.
When does the Kagi strategy fail?
In ranging markets, every time. When price moves sideways for days, the line flips thin to thick to thin again, each flip looks like a signal, and each signal stops out. The tell is three flips in three days with flat shoulders: when you see it, stop trading until one shoulder breaks by two ATR. Kagi also fails on news spikes and Asian-session flips, which is why the plan only takes signals in the London morning and the New York afternoon.
Do I need a special platform to trade Kagi?
Most charting platforms include Kagi as a chart type, including TradingView and MetaTrader 5, and the reversal amount is set in the chart settings. You do not need an indicator or an expert advisor: the chart itself is the tool. I run Kagi beside a normal candlestick chart, use Kagi for direction and levels, and execute the entry on candlesticks.
Risk disclaimer: Trading on a funded or prop firm account carries a substantial risk of loss, including the loss of the challenge fee. Kagi charts are a technical analysis tool, not a prediction device, and past results, including the twelve trades in this article, do not guarantee future results. Always size every trade so that a single loss stays inside your daily loss limit, and never trade with money you cannot afford to lose.



