Fixed-pip stops have a problem that shows up on volatile days. A 20-pip stop that’s sensible on a quiet Tuesday is just noise on the day of a big release. The market hits it, you take a loss, and the trade you’d have won with a wider stop moves on without you. Place the stop too wide, on the other hand, and your position has to shrink so much that the trade isn’t worth the effort.
In this article
- What average true range is
- From ATR to a stop
- From the stop to a position size
- Choosing the timeframe
- Choosing the multiple
- Why this suits prop accounts
- A worked day
- Using ATR with structure
- Gold, indices and other instruments
- Where the method goes wrong
- A simple routine
- Mistakes to avoid
- Practice drill: five ATR sizing exercises
- What to do when the ATR is huge
- Comparing fixed stops and ATR stops
- Document it in your plan
- Pairing ATR sizing with a daily cap on risk
- Check the ATR against reality
- Keep a log of stop distances
- A word on simplicity
- Frequently asked questions
- The short version
Volatility-based sizing solves part of this. Instead of a fixed number of pips, you measure how much the market is currently moving and set the stop relative to that. The position size then follows from the stop, so your dollar risk stays the same however wild the market is. This guide explains average true range, how to turn it into a stop and a size, and where the method goes wrong. Use the drawdown calculator alongside it to see how a given risk fits your daily limit.
What average true range is
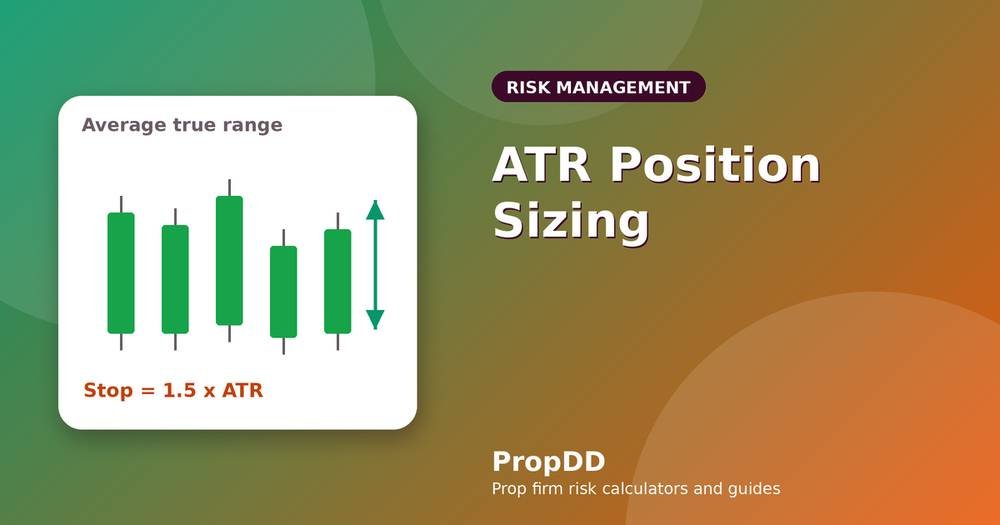
True range for a bar is the largest of three distances: the bar’s high minus its low, the high minus the previous close and the previous close minus the low. The average true range, or ATR, is a moving average of the true range over some number of bars, commonly fourteen. It’s a measure of how far price typically moves in a bar, not of direction. Investopedia has a concise explanation of the average true range if you want a second source.
From ATR to a stop
A common approach is to place the stop a multiple of the ATR away from your entry: for example, 1.5 times the ATR. If the ATR on your chart is 12 pips, a 1.5 multiple gives an 18-pip stop. When the market is quiet and the ATR falls to 8 pips, the stop becomes 12 pips. When a release inflates the ATR to 20 pips, the stop widens to 30. The stop breathes with the market, which keeps ordinary noise from stopping you out.
From the stop to a position size
The rest is the familiar formula: position size equals dollar risk divided by stop distance times pip value. Suppose you risk $400 on EURUSD at about $10 per pip per lot.
| ATR (pips) | Stop at 1.5 × ATR | Lots for $400 risk |
|---|---|---|
| 8 | 12 pips | 3.33 |
| 12 | 18 pips | 2.22 |
| 20 | 30 pips | 1.33 |
| 30 | 45 pips | 0.88 |
The dollar risk is $400 in every row. What changes is the size, which shrinks as volatility rises. That’s the whole idea, and it’s an elegant way to keep a loss at the same size on quiet days and wild ones. The sizing basics are in position sizing for prop firm challenges.
Choosing the timeframe
The ATR depends on the chart’s timeframe, so use the one you actually trade. A trader taking entries on a 15-minute chart uses that chart’s ATR. A swing trader uses the daily ATR. Mixing them, for example sizing from a daily ATR on a 5-minute entry, produces stops that are far too wide. Decide on one timeframe for your stop calculations, and write it in your plan.
Choosing the multiple
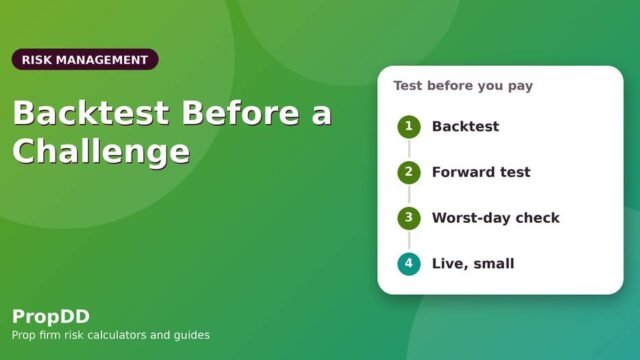
There’s no magic number. Many traders use something between 1 and 2.5 times the ATR. A smaller multiple gives tighter stops and bigger size but more stop-outs; a bigger multiple gives fewer stop-outs and smaller size. Test candidates on a demo or in a backtest and compare the results net of costs, then fix one multiple for a while. Changing it every day makes your results impossible to read. Our guide to testing is in how to backtest and forward-test a strategy.
Why this suits prop accounts
The daily loss limit cares about dollars, not pips. Constant dollar risk per trade means a run of losses costs roughly the same on a volatile day as on a quiet one, so your plan’s arithmetic holds up. It also automatically reduces your size when the market becomes more dangerous, which is exactly when slippage and fast stops threaten your daily room. That connects naturally to how much to risk per trade.
A worked day
Account $100,000, risk 0.4% ($400), daily limit 5% ($5,000), personal stop at $3,500. In the morning, the 15-minute ATR on EURUSD is 9 pips. A setup with a 1.5 multiple gives a 13.5-pip stop, so lots are $400 ÷ (13.5 × $10) = 2.96, which rounds down to 2.9. The trade is stopped out, −$400. Before the US data release, the ATR jumps to 22 pips. The trader decides to skip it, but if they’d traded, the stop would be 33 pips and the size 1.2 lots. After the release, spreads normalise and ATR settles near 14. A second setup, 21-pip stop, 1.9 lots. A winner at 1.5R, +$600. Net +$200, and no trade was larger in risk than any other.
Using ATR with structure
ATR gives you a distance, but price has structure: swing highs and lows, levels, ranges. A stop placed at 1.5 × ATR might sit right in the middle of a busy zone. Many traders combine both: they identify the structural invalidation point and then check that it’s roughly in line with the ATR-based distance. If the structural stop is much tighter than 1× ATR, it might be too tight for the current noise. If it’s much wider than 3× ATR, the trade may need a smaller size than is worthwhile. Either way, the ATR is a sanity check.
Gold, indices and other instruments
The method works on any instrument, as long as you use the right units and value per point. For gold, the ATR is in dollars and a lot may carry $100 per dollar of movement. For indices, it’s in points, and the point value comes from the contract specification. See trading gold within a daily drawdown limit and trading indices within a daily limit for the contract details.
Where the method goes wrong
ATR is backward-looking: it measures recent movement, not what’s coming. A sudden news spike can move price far beyond a stop sized from a quiet ATR. Gaps can skip stops entirely. A very large ATR can imply a stop so wide that the lot size becomes tiny, and the trade not worth taking. And the ATR changes within a session, so a stop calculated at entry might be different an hour later. These are reasons to keep an allowance for slippage and to combine ATR with a cap on open risk and a personal stop.
A simple routine
- Note the ATR on your trading timeframe before the session.
- Compute the stop distance from your fixed multiple.
- Compute the lot size from your fixed dollar risk and round down.
- Check total open risk and room left for the day.
- Re-check the ATR after major releases or if the market changes character.
Mistakes to avoid
Using the wrong timeframe’s ATR. Changing the multiple after each loss. Sizing from the ATR but ignoring spreads on tight stops. Treating the ATR stop as a guarantee. Holding through a news release on a stop sized for a quiet market. Forgetting that very wide stops may not fit your daily limit.
Practice drill: five ATR sizing exercises
Assume $10 per pip per lot and a multiple of 1.5. Work them out first. (1) Risk $300, ATR 10 pips. (2) Risk $500, ATR 16 pips. (3) Risk $250, ATR 7 pips. (4) Risk $400, ATR 25 pips. (5) Risk $200, ATR 12 pips.
Answers: (1) stop 15 pips, $300 ÷ $150 = 2.0 lots. (2) stop 24 pips, $500 ÷ $240 = 2.08, so 2.0 lots. (3) stop 10.5 pips, $250 ÷ $105 = 2.38, so 2.3 lots. (4) stop 37.5 pips, $400 ÷ $375 = 1.06, so 1.0 lot. (5) stop 18 pips, $200 ÷ $180 = 1.11, so 1.1 lots. Notice how the lots fall as the ATR rises, and how every answer is rounded down.
What to do when the ATR is huge
If the ATR implies a stop that would force your size to a fraction of normal, you have a choice: take the trade with the small size, or skip it. A trade with a tiny size makes little money if it works, and its costs, as a share of risk, can be large. On days of extreme volatility, many traders simply wait. The ATR is information, and sometimes the information says the market is too violent for your plan.
Comparing fixed stops and ATR stops
Run both methods on your last fifty trades and compare. How many trades would have been stopped out by noise under the fixed stop but survived under the ATR one? How much smaller would your size have been on volatile days? Did the ATR version reduce your worst day? You’ll learn more from your own data than from any general claim, and it will tell you whether the extra step is worth it for your style.
Document it in your plan
Write the method as a short recipe in your trading plan: the timeframe, the ATR period, the multiple and the rule for rounding the size. When you’re tempted to improvise during a volatile session, the recipe is there to follow. A written method is a method you can test, improve and defend.
Pairing ATR sizing with a daily cap on risk
Because ATR sizing keeps dollar risk constant, it combines well with a cap on total open risk and a personal daily stop. A simple scheme: each trade risks a fixed dollar amount, no more than two trades are open at once, total open risk never exceeds three times a single trade’s risk, and the personal stop is at 60% to 70% of the daily limit. With a framework like that, volatility can change as it wishes, and your worst-case day stays roughly the same. See how to set a personal daily stop for the last piece.
Check the ATR against reality
From time to time, compare the ATR figure with what price actually did over the last few hours. If the market has moved far more than the ATR suggests, because of a release or a headline, your stop and size may be out of date. Recalculate. It’s a small habit that keeps the method honest, and it’s especially useful on days with unscheduled news.
Keep a log of stop distances
Add two columns to your journal: the ATR at entry and the stop in multiples of ATR. After a month, look at which multiples performed best and how often stops were hit by noise. If trades with a stop under 1× ATR lose far more often, your multiple is too tight. If trades with stops above 2× rarely pay for the smaller size, it’s too wide. The data will usually point to a range that suits your style.
A word on simplicity
Volatility-based sizing is a refinement, not a requirement. Plenty of successful prop traders use fixed stops and simply reduce size or skip trading on wild days. If the ATR method feels like extra complexity that you’ll abandon in a week, start with the simple version and add the ATR once your routine is stable. A simple rule that you follow beats a clever one that you don’t.
Frequently asked questions
What ATR period should I use?
Fourteen is the common default. What matters more is using the same period consistently and testing it on your own data.
Is ATR sizing better than fixed-pip stops?
It adapts to changing volatility, which keeps dollar risk constant and reduces noise stop-outs. Fixed stops are simpler, and they can be fine in stable conditions.
Can I use ATR for targets too?
Many traders do, for example by setting targets at a multiple of the ATR. Test it before relying on it.
Does ATR sizing remove the risk of slippage?
No. It sizes the position for the distance you’ve chosen, but fills can still be worse than the stop price, especially around news.
The short version
Measure volatility with the ATR on your trading timeframe, set the stop at a fixed multiple of it, size the position from the stop and keep the dollar risk constant. Combine it with structure, allow for slippage and keep your personal stop. For the rule that your dollar risk is measured against, read the prop firm max daily drawdown explained, and for free background lessons, BabyPips is a good place to continue.