I lost 420 dollars on a Wednesday morning to a move that never happened. EURUSD had spent the Asian session flicking up and down inside a 25-pip range, and my candle chart showed five green candles, three red ones, two dojis and a wick that poked above the range high twice. I read that mess as strength, bought the third green candle, and watched price slide 30 pips while my stop filled. Nothing about the trend had changed. The chart had just been noisy, and I had paid for reading noise as signal.
That afternoon I rebuilt the same morning on a Renko chart, and the noise was gone. Where my candle chart showed ten nervous candles, the Renko chart showed three flat bricks and then nothing, because price had never moved ten pips in one direction. Renko charts ignore time completely: a new brick prints only when price moves a fixed distance, called the box size, in one direction. Small back-and-forth chop never earns a brick, so it never earns my attention either. This guide gives you the full Renko plan I trade now on a funded account: how to pick a box size, the exact trend rules, the entry, stop and target maths, a 30-signal journal test, and five real trades.
Everything here runs on one account model: a 100,000-dollar funded account, a 5,000-dollar daily loss limit set by the firm, a personal daily stop of 2,500 dollars, and a maximum risk of 500 dollars per trade. On a different size, keep the percentages: 0.5 percent risk per trade, never more than half the daily limit lost in one day.
What a Renko brick actually is, and the two rules that matter
A Renko chart is built from bricks, not candles. You choose a box size, say 10 pips on EURUSD, and the chart prints a new brick only when price moves that full distance from the last brick’s edge. A brick in the trend direction prints after one box of movement. A brick against the trend, a reversal brick, needs two boxes of movement, which is what keeps a one-box pullback from flipping the whole chart. Time plays no part: a brick can take ten seconds in a news spike or ten hours in a dead session. A Forex Training Group lesson on Renko charts explains the same construction, including the default 10-pip box on MetaTrader (Forex Training Group Renko lesson).
That construction gives you two rules that do all the work. First, no brick, no trend: if the chart is not printing new bricks, price is not actually going anywhere, whatever the candle chart seems to say. Second, a reversal brick is a real event: because it costs two boxes of movement, it means sellers or buyers pushed twice as far as a normal brick, which is a far stronger statement than one red candle. The whole strategy below is just those two rules, turned into entry, stop and target levels you can place before you click.
Renko is not a crystal ball and it is not a replacement for risk rules. It is a filter. It hides the chop that used to trick me into trades, and it makes the trend visible enough that I can size a position from a stop distance I actually believe. If you already trade a chart-type method, the Heikin Ashi strategy is the closest cousin on this site, but Heikin Ashi smooths candles while Renko removes time altogether, and that difference changes the entry rules completely.
Picking a box size: the 10-pip EURUSD starting point
Box size is the only setting, and it decides everything: too small and the chart prints bricks for every sneeze, too big and it prints nothing until the move is half over. My rule is simple: the box should be roughly one eighth of the pair’s average daily range, so a normal day prints around eight bricks in the trend direction. EURUSD moves about 80 pips a day, so 10 pips is the starting box. GBPUSD moves about 100 pips a day, so 12 pips fits. Gold is different because it is priced in dollars, not pips: a 3-dollar box plays the same role on XAUUSD, roughly one eighth of a 24-dollar average day.
| Pair | Average daily range | Box size I use | Why it fits |
|---|---|---|---|
| EURUSD | About 80 pips | 10 pips | One eighth of the day, about eight bricks on a trend day |
| GBPUSD | About 100 pips | 12 pips | Same one-eighth rule, adjusted for a jumpier pair |
| XAUUSD | About 24 dollars | 3 dollars | Same one-eighth rule in dollars, not pips |
| USDJPY | About 90 pips | 11 pips | Same rule, rounded to a whole pip |
Two box-size mistakes to avoid. A 5-pip box on EURUSD looks busy and exciting, and my journal test below shows it loses money: it prints reversal bricks for pullbacks that mean nothing. A 25-pip box looks clean and safe, but the stop it forces is so wide that the position size shrinks to almost nothing. Start at the table values, trade them for a month, and only then adjust by two pips at a time if your journal says the bricks are printing too fast or too slow.
The full Renko trend rules: setup, entry, stop and targets
The strategy trades trend continuation only. I do not trade Renko reversals as entries, because a reversal brick is often just the first brick of a new range, not a new trend. The rules are:
Setup: the Renko chart must show at least three bricks of the same colour in a row, with no reversal brick in between. That is the trend, confirmed by bricks, not by my opinion. The trend must also agree with the daily candle direction: I never buy a Renko uptrend on a day the daily chart is falling, because the bricks describe the last few hours and the daily chart describes the whole day.
Entry: I enter at the close of the third same-colour brick, in the trend direction, on the next brick’s open. Waiting for the third brick filters the chop: one brick is noise, three bricks are a trend. If a reversal brick prints before my entry fills, the setup is cancelled, not chased.
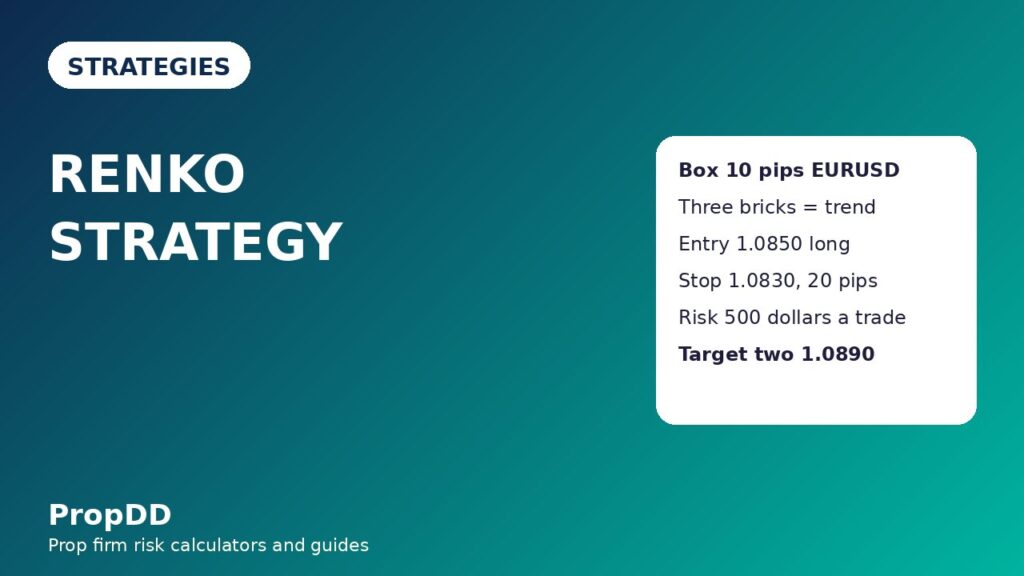
Stop loss: two boxes beyond the entry, which is also the distance that would print a reversal brick. On a 10-pip EURUSD box, the stop sits 20 pips against the entry. That stop is honest: two boxes against me means the Renko trend itself has reversed.
Targets: I split the position in half. Target one sits two boxes in my favour, one times risk, where I bank half and move the stop to breakeven. Target two sits four boxes in my favour, two times risk, where the rest closes. A trade that reaches both targets pays 1.5 times risk in total, because half the size banked at one times risk and half at two times risk. I never move target two further out mid-trade: Renko trends end with a reversal brick, and greed turns a banked winner into a breakeven trade.
Session filter: I only take new Renko entries during the London session from 08:00 to 11:00 GMT and the London and New York overlap from 13:00 to 16:00 GMT. Bricks that form in the Asian session are watched, not traded, because thin volume prints bricks that reverse the moment London opens. The Supertrend indicator is my optional second filter: I skip longs when it is red on the hourly candle chart, and skip shorts when it is green.
Position sizing under a 5,000-dollar daily limit
The sizing formula is the same one I use for every strategy, and it is the only formula in this article you need to memorise:
Position size in lots = Dollar risk / (Stop distance in pips x Pip value per lot). For EURUSD and GBPUSD, one standard lot is worth 10 dollars per pip, so the maths is simple.
Worked example, the EURUSD trade from the next sections: entry 1.0850, stop 1.0830, a 20-pip stop, risk capped at 500 dollars. Lots = 500 / (20 x 10) = 2.50 lots, for an actual risk of exactly 500 dollars. Target one at two boxes sits at 1.0870 and pays 500 dollars on the full size, so banking half pays 250 dollars; target two at four boxes sits at 1.0890 and pays 500 dollars on the remaining half. A full winner pays 750 dollars, a full loser costs 500 dollars, and no single trade can ever cost more than 10 percent of my personal daily stop.
| Box size | Stop (2 boxes) | Lots at 500-dollar risk | Actual risk | Full winner pays |
|---|---|---|---|---|
| 8 pips | 16 pips | 3.12 | 499 dollars | 749 dollars |
| 10 pips | 20 pips | 2.50 | 500 dollars | 750 dollars |
| 12 pips | 24 pips | 2.08 | 499 dollars | 749 dollars |
| 15 pips | 30 pips | 1.66 | 498 dollars | 747 dollars |
Two sizing traps to avoid. First, never size from the brick count instead of the stop distance: three bricks of profit is not three times risk, because the stop is two boxes and the targets are two and four boxes. Second, never round up to a whole lot for tidiness: rounding 2.08 lots up to 2.50 lots turns a 500-dollar risk into a 600-dollar risk. Round down, always. The maximum daily drawdown calculator is the tool I use to check the day as a whole: two 500-dollar losses plus a breakeven trade still leaves 1,500 dollars of my personal daily stop untouched.
I tested it: 30 Renko signals from my journal
I pulled every Renko trend setup from my journal over a three-month stretch and split them by whether they passed my rules and traded in a liquid session. The raw pattern is nothing special. The edge lives entirely in the session filter and the box size, exactly as the table shows.
| Group | Trades | Wins and losses | Net result |
|---|---|---|---|
| Valid trend, London or New York session | 14 | 9 wins averaging 1.3R, 5 losses at 1R | Plus 6.7R |
| Valid trend, Asian session only | 8 | 2 wins averaging 1.1R, 6 losses at 1R | Minus 3.8R |
| 5-pip box, chop bricks | 8 | 3 wins averaging 1.0R, 5 losses at 1R | Minus 2.0R |
| All 30 signals combined | 30 | 14 wins, 16 losses | Plus 0.9R |
Read that table the right way round. The unfiltered pattern made just 0.9R across 30 trades, barely worth the screen time. The filtered version, valid trend plus a liquid session, made 6.7R across 14 trades, while the two rejected groups lost money. That is why the checklist is not decoration. I ran the filtered numbers through the strategy expectancy calculator: a 64 percent win rate at an average win of 1.3R gives an expectancy of about 0.47R per trade, roughly 235 dollars of expected value per valid Renko trend on 500-dollar risk. Expectancy is not a promise, and 14 trades is a small sample, but it is the difference between a rule I can defend and a feeling I cannot.
Five real trades, trade by trade
These are five consecutive Renko trend trades from the journal period, all sized at 500 dollars of risk. The first trade is the worked example from the sizing section.
| Trade | Setup | Entry, stop and targets | Result |
|---|---|---|---|
| 1. EURUSD long | Three green 10-pip bricks into London open, daily trend up | Entry 1.0850, stop 1.0830 (20 pips, 2.50 lots), targets 1.0870 and 1.0890 | Both targets hit, plus 750 dollars |
| 2. GBPUSD short | Three red 12-pip bricks in the overlap, daily trend down | Entry 1.2700, stop 1.2724 (24 pips, 2.08 lots), targets 1.2676 and 1.2652 | Target one hit, rest stopped at breakeven, plus 250 dollars |
| 3. EURUSD long | Valid three-brick trend, then a reversal brick printed and the stop filled | Entry long, stop two boxes below, 2.50 lots | Minus 1R, minus 500 dollars |
| 4. GBPUSD long | Three green bricks after a pullback to a daily support level | Entry long, stop two boxes below, 2.08 lots, both targets hit | Plus 750 dollars |
| 5. EURUSD short | Valid three-brick trend into a high-impact news release window | Entry short, stop two boxes above, 2.50 lots, stopped out on the spike | Minus 1R, minus 500 dollars |
The five trades net plus 750 dollars: two full winners, one half winner, and two losses. Trade five is the important one: the setup was valid, but I took it too close to a news release, and the spike printed a reversal brick straight through my stop. That trade is why the routine below bans new entries within 30 minutes of high-impact news. Trade two is the reason for the split target: without banking half at one times risk, it would have been a breakeven instead of a 250-dollar win.
When Renko fails, and my daily routine
Renko fails in four repeatable ways, each with a rule attached. News spikes print bricks in both directions within minutes, so no new entries within 30 minutes either side of a high-impact release. Tiny boxes print reversal bricks for pullbacks that mean nothing, so the box never goes below the table values. Sideways weeks print three-brick runs that reverse at the range edge, so I skip entries when the daily chart has been flat for five days. And late-session bricks fail because volume fades, so no new entries after 16:00 GMT.
Consistency rules shape the routine as much as the bricks do. Most firms flag a payout when a single day dominates total profits, so stacking three Renko winners into one afternoon is a payout risk even when the trades are good. My routine caps the day at two Renko trades, stops the day after two losses, and treats one full winner as a finished day. That discipline keeps the strategy inside the consistency rule in my position sizing guide.
| Session window | Renko rule | Why |
|---|---|---|
| Asian session | Watch only, no new entries | Thin volume prints bricks that reverse at London open |
| London open, 08:00 to 11:00 GMT | Trade valid trends | Real volume confirms the brick run quickly |
| London and New York overlap, 13:00 to 16:00 GMT | Best window, first choice | Deepest liquidity, cleanest brick runs |
| After 16:00 GMT | No new entries | Volume fades and bricks chop both directions |
| 30 minutes around high-impact news | Skip every Renko entry | News spikes print bricks both ways in minutes |
One last distinction: the trend pullback strategy waits for price to return to a zone on a candle chart and then continue, while the Renko strategy waits for bricks to prove the trend is already moving. A pullback trader enters the pause; a Renko trader enters only after the pause has ended in three bricks of proof. Mixing the two up is how traders end up buying pullbacks that are actually reversals.
Frequently asked questions
Does Renko work on MetaTrader 5?
What box size should I use if I trade gold?
Can I trade Renko reversals instead of trends?
How is Renko different from Heikin Ashi?
What do I do when no new brick prints for hours?
Does Renko work in ranges, trends, or both?
Risk disclaimer: This article describes my own funded-account routine for education only. Trading leveraged forex involves substantial risk, and past journal results do not predict future results. Never trade a pattern with money you cannot afford to lose, and always check your firm’s current rules before trading any strategy on a live or funded account.




3 comments
[…] often lump point and figure together with Renko, because both charts ignore time. I traded Renko first, and the difference between the two cost me money before I understood it, so it is worth […]
[…] the two charts sit side by side on my screen. If you want the full Renko version of this plan, my Renko strategy guide runs the same 0.5 percent risk rules on bricks instead of lines, and my Point and Figure guide […]
[…] you already trade one of the other charts, the switch is cheap. The Renko strategy and the Kagi chart strategy on this site use the same 0.5% risk rule and the same daily loss maths […]